

After being asked repeatedly to explain how dealer gamma and market structure can be used in real-world portfolio management, I’m launching the Gamma Report.
Every Monday morning, I’ll publish this report to help investors and advisors see how liquidity, positioning, and volatility interact beneath the surface of the market and how to translate those dynamics into smarter allocation decisions. Alongside the weekly analysis, I’ll also be building a systematic, long-term trading strategy in real time, sharing each adjustment and tracking performance as it develops.
The reason this matters today is that markets move a lot differently than your father’s stock market. Over 85% of daily trading volume now comes from algorithms and systematic strategies, which means the short-term structure of the market drives most of the price action. Traditional valuation and macro narratives still matter, but they move far slower than the mechanical flows that now dominate intraday and weekly market behavior.
Because of that, focusing on structural signals like dealer gamma, realized volatility, and systematic flow positioning is no longer just for traders; it’s essential for portfolio managers, financial advisors, and long-term investors who want to understand when liquidity is providing a tailwind or becoming a headwind.
The Dealer Gamma Report is designed to make that structure visible and actionable. It translates institutional flow data into practical, tactical decisions investors can actually deploy.
Each week, the framework looks at five key components that define the real-time market regime:
Dealer Gamma: identifies whether dealer hedging suppresses or amplifies volatility.
Realized Volatility: tracks short-term volatility trends to gauge market stability.
Systematic Flows (CTA and Vol-Control): measure liquidity expansion or contraction from rule-based strategies.
Breadth: shows the strength and participation behind market trends.
Composite Regime and Tactical Allocation: combines the data into a single, actionable signal that defines the tactical portfolio mix between offense and defense.
By following this report weekly, you’ll start to see why markets accelerate or calm down, how positioning shapes intraday behavior, and when to lean into or away from risk based on the actual flow of liquidity, not headlines or emotions.
Gamma Regime
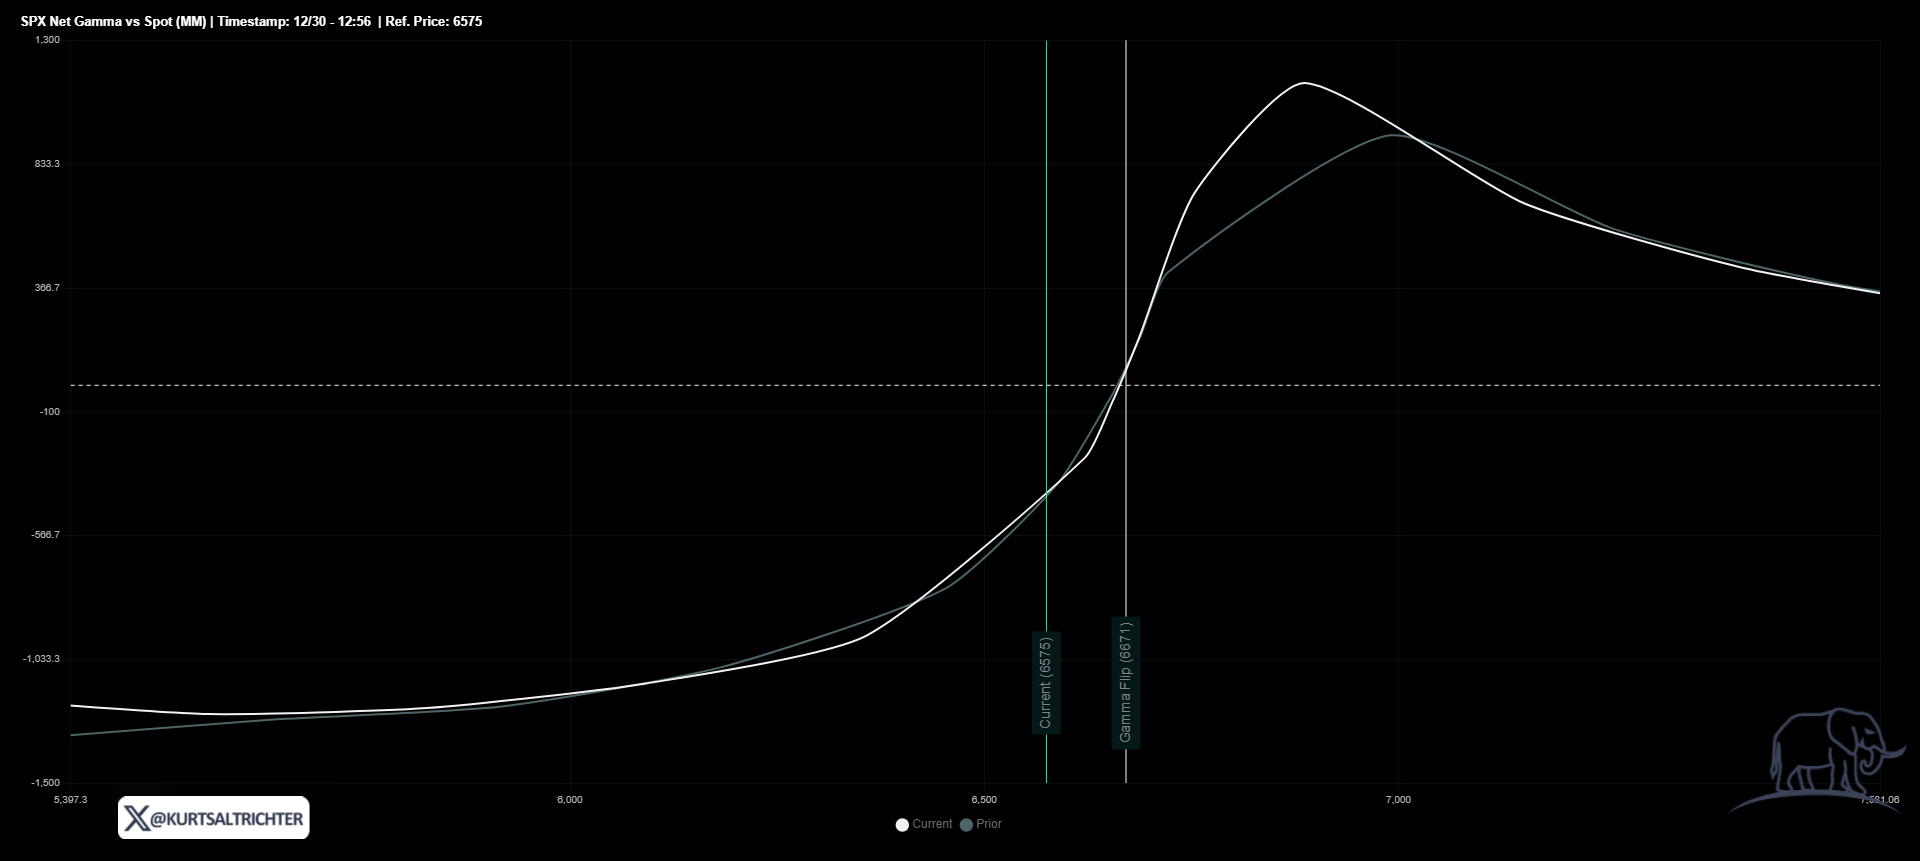
The S&P 500 closed at 6,575 (green line), while the Gamma Flip Line (white line) sits at 6,671. That means the index is trading about 1.5% below the flip line, a level that defines the point where dealer hedging behavior changes direction.
What is the gamma flip line:
The gamma flip line is the price level at which dealer hedging transitions from suppression to amplification. When SPX trades above the flip line, dealers are long gamma, meaning they hedge by selling into strength and buying into weakness. This suppresses volatility and provides a liquidity cushion for the market.
When SPX trades below the flip line, dealers are short gamma. In that state, they hedge in the same direction as price, selling into weakness and buying into strength, which amplifies volatility and accelerates market moves.
Right now, with SPX roughly 1.5% percent below the flip, dealers are mechanically selling into weakness and buying into strength. That behavior accelerates both downside and upside moves, which is why markets often feel faster, more erratic, and harder to fade in negative gamma conditions.
For portfolio management, that means risk control takes priority over conviction. In this environment, risk management and position sizing matter more than conviction. Below the flip, rallies are less stable, and pullbacks can deepen faster than expected. Until SPX closes back above the flip level, volatility expansion and unstable liquidity remain the base case.
Volatility Signals
The 30-day realized volatility (blue line) of the S&P 500 spiked sharply at the end of the week, jumping from roughly 7.5%, while the 90-day realized volatility (red line) jumped to 6.81%. That surge represents a volatility shock, the kind of move that resets the short-term volatility regime and directly impacts systematic exposure.
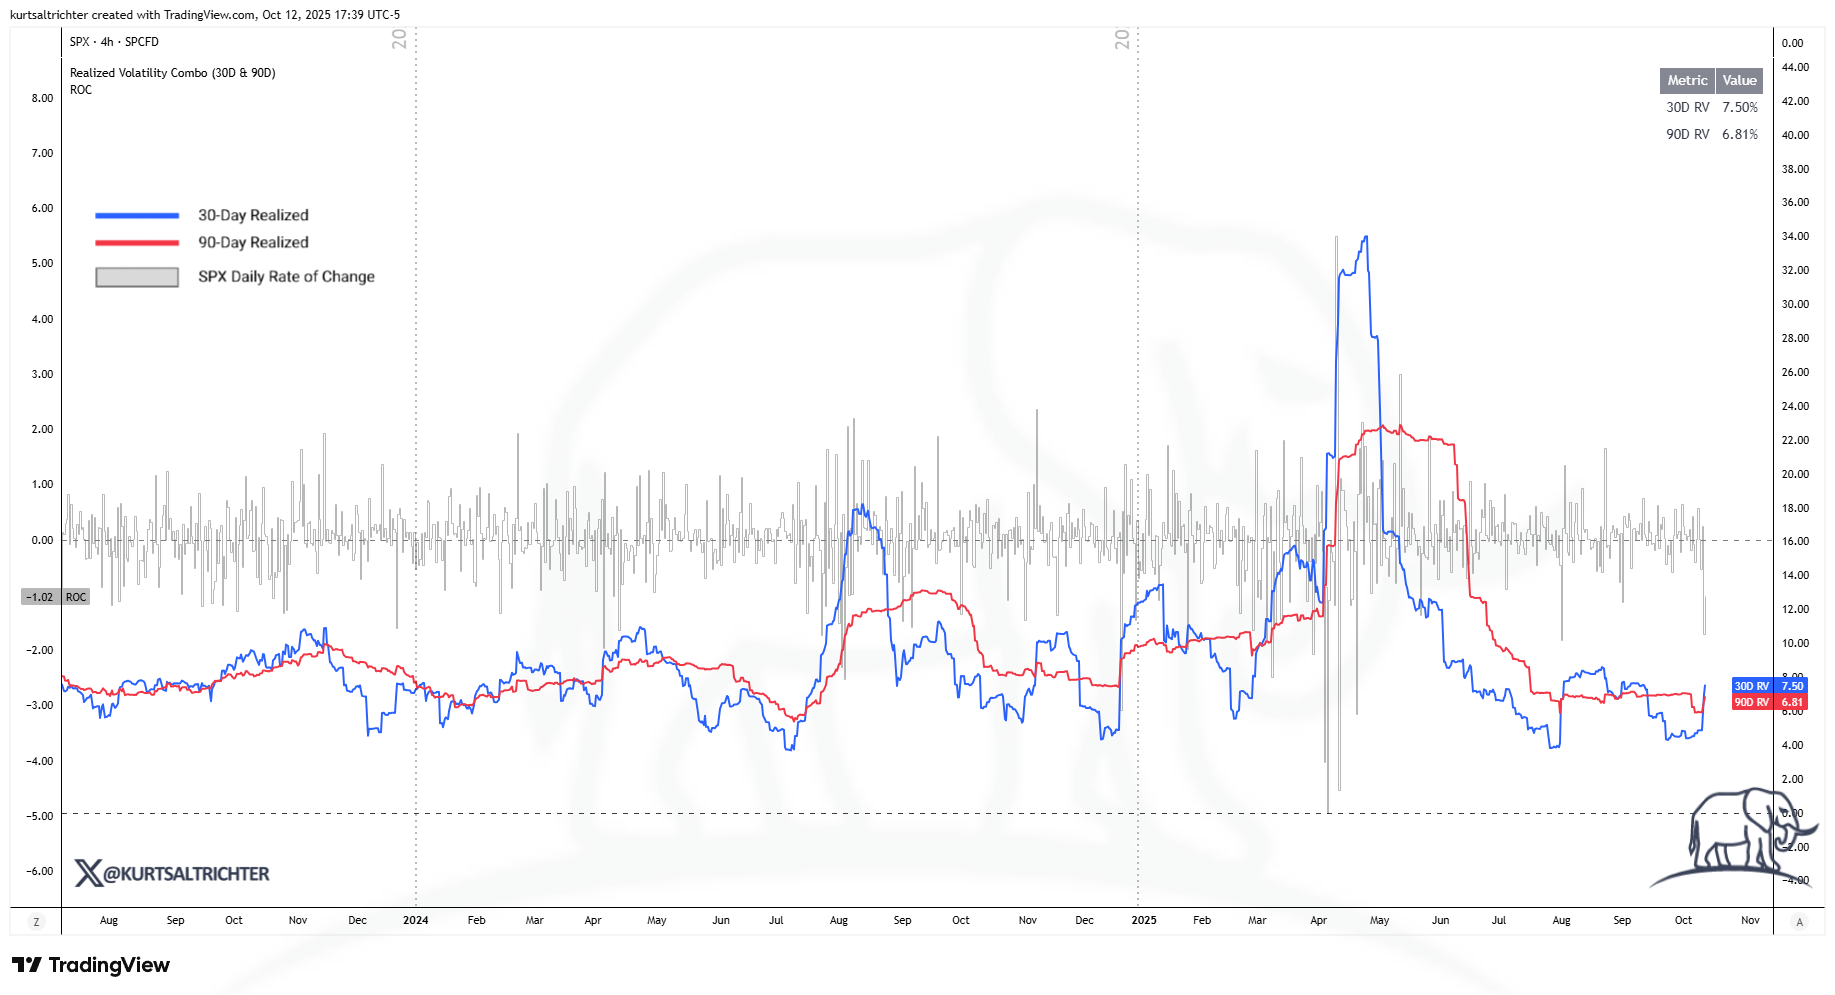
When realized volatility rises this quickly, it tells us that price swings over the past month just expanded dramatically. It’s not about one big down day; it’s about how that day changes the trailing window of returns. This matters because volatility-targeting strategies, vol-control funds, and risk-parity models all key off realized volatility.
When realized volatility spikes, these strategies cut exposure to stay within their risk limits
That selling pressure often amplifies drawdowns over the following few sessions as mechanical selling plays out.
This jump effectively ends the calm, declining volatility trend that had been building since August. It signals a potential transition from a stable to an unstable environment. If realized volatility remains above 7%–8%, systematic selling pressure will likely persist until the data stabilizes.
From a portfolio management perspective, this is a short-term caution flag. It does not mean panic, but it does mean the volatility component of our composite equity model has shifted from supportive to restrictive. In this state, volatility acts as a headwind to risk assets, tightening liquidity and increasing the odds of whipsaw price action.
If realized volatility compresses back toward 6% in the coming days and weeks, markets will normalize quickly. But if it stays elevated or rises further, you can expect continued pressure from systematic players, reinforcing the negative gamma environment already in place.
Systematic Flows
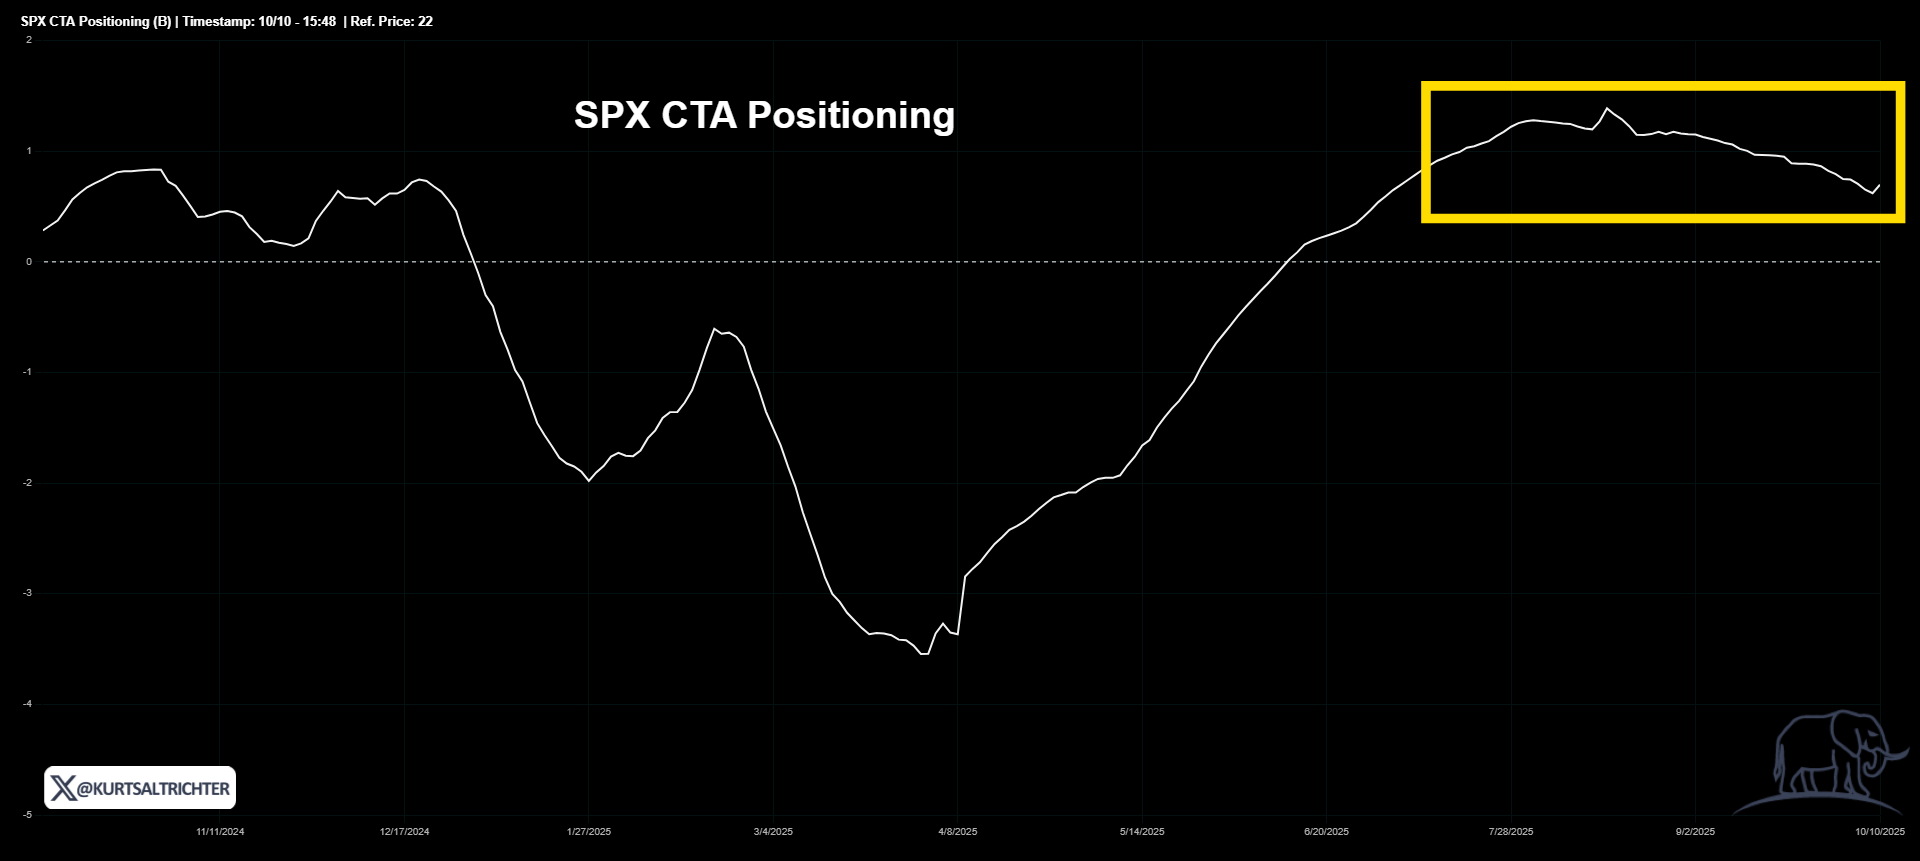
The volatility spike is already showing up in systematic flow models. Both CTA positioning and Vol-Control exposure are trending lower, consistent with a short-term pullback in mechanical risk appetite.
CTAs adjust exposure based on trend and momentum. When volatility rises, price direction becomes less predictable, and these models typically reduce exposure to maintain drawdown control. The same is true for volatility-control funds, which mechanically cut equity exposure as realized volatility rises.
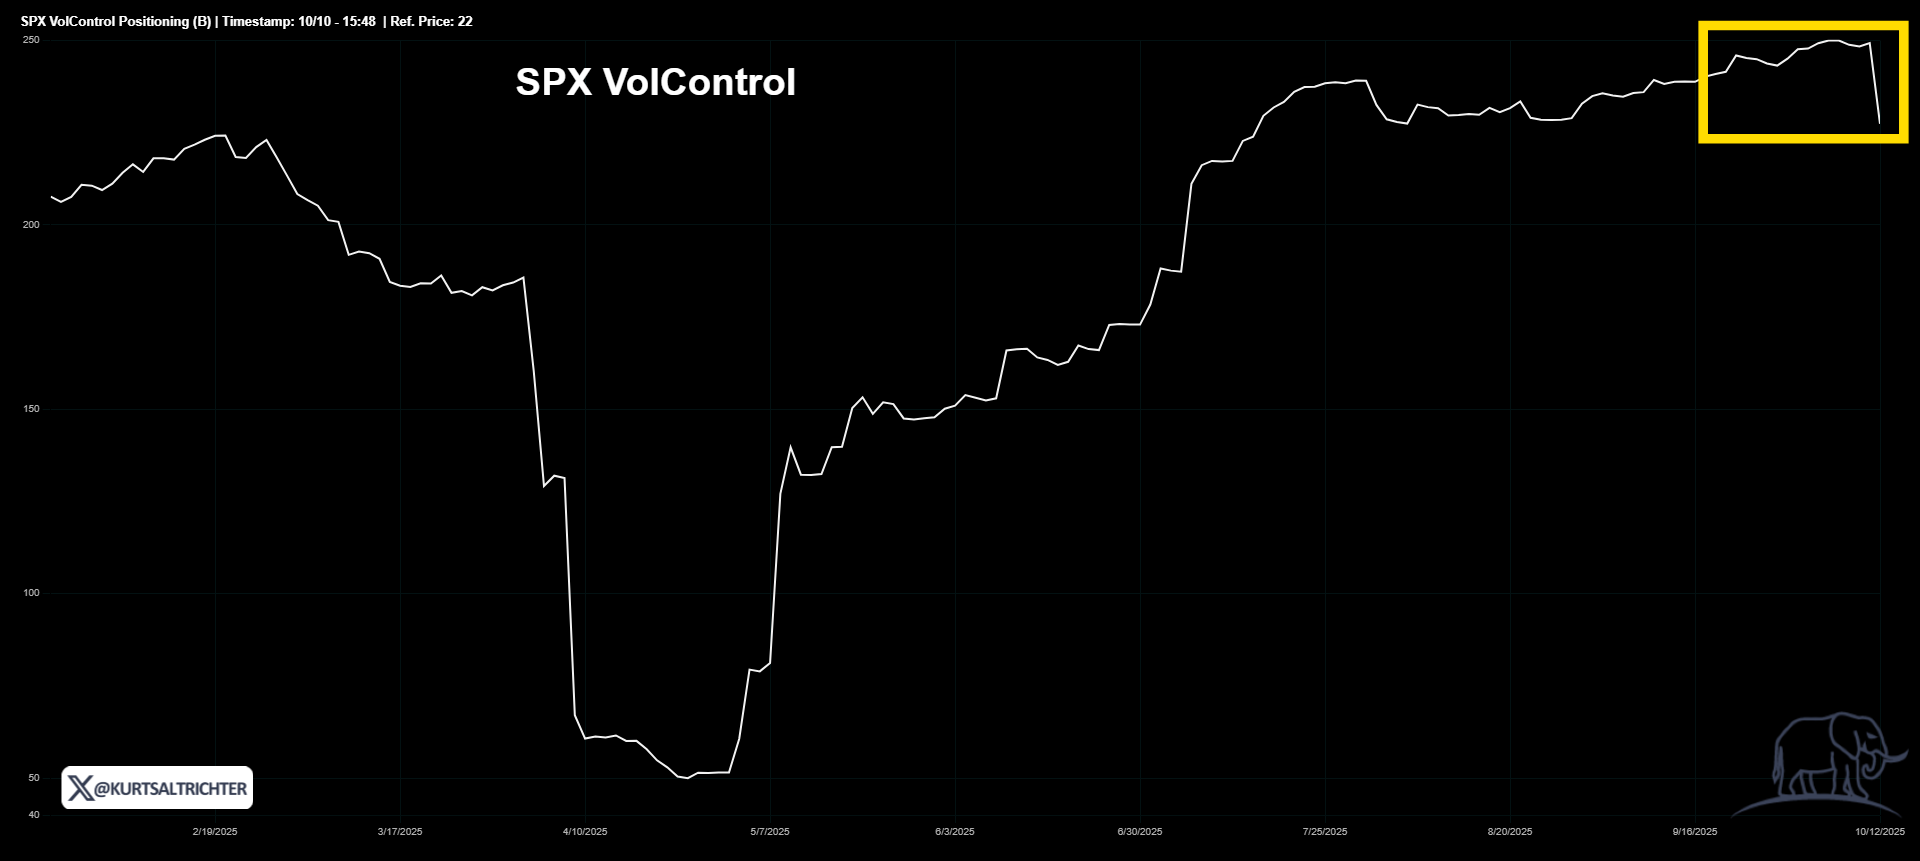
Last week’s spike likely forced modest deleveraging across both models. The impact is not catastrophic, but it is enough to thin liquidity and increase the probability of choppy price action. In practice, this means that market rallies may fade faster, and dips may overshoot before stabilizing.
The behavior of these systematic strategies is why volatility and flows move hand in hand. When volatility rises, liquidity providers become liquidity takers; they step back just as hedging demand increases, amplifying intraday swings.
If volatility settles quickly, flows will stabilize and start rebuilding exposure within days. If volatility stays high, systematic selling will continue to suppress upward momentum.
Market Breadth
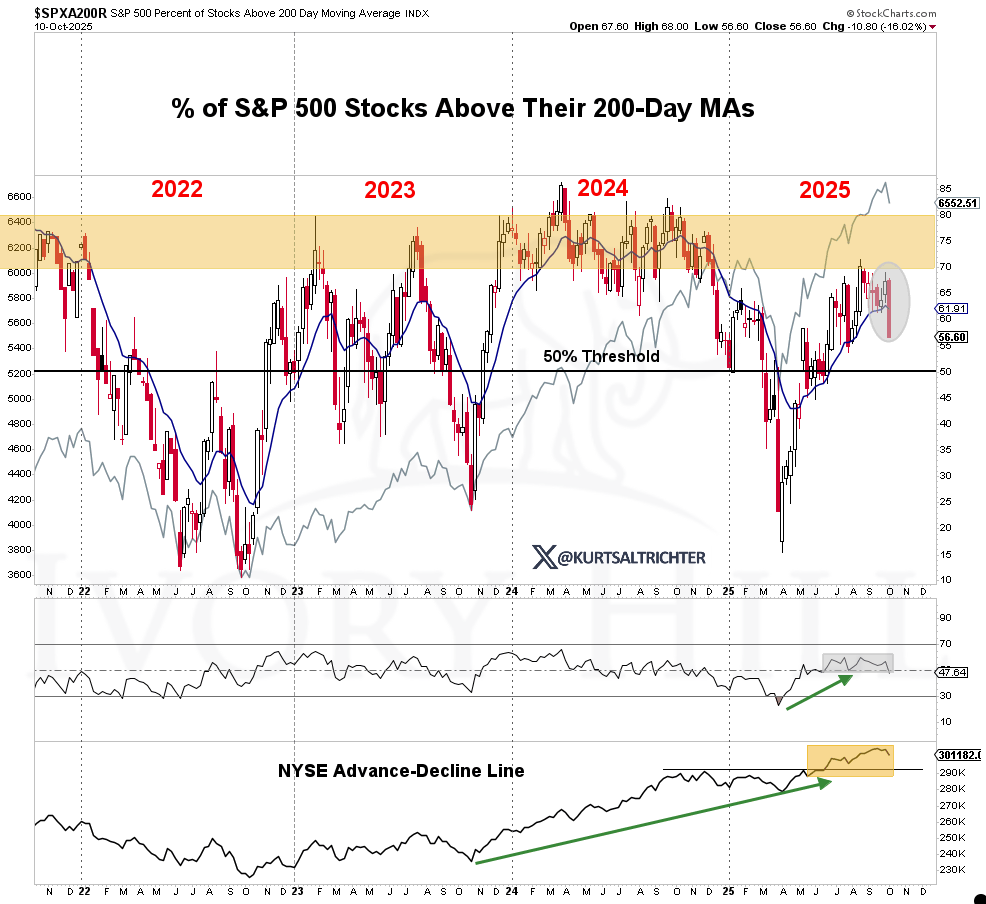
About 56.6% of S&P 500 stocks remain above their 200-day moving average. Breadth has flattened after improving steadily through September. This plateau means that while leadership stocks remain strong, participation under the surface has stopped expanding.
Breadth acts as the internal check on market health. Above 65% confirms broad participation. Below 50% signals deterioration. At current levels, the market sits in neutral territory, resilient but not broad enough to absorb new volatility shocks without weakness.
If volatility stabilizes and breadth improves back toward 60%+, it would signal the market can absorb the next round of systematic flow selling. If breadth weakens further while volatility stays high, it would confirm a transition toward a defensive environment.
Composite Regime
The weighted composite score is slightly negative, placing the model in a Neutral regime this week. While the S&P 500 remains below the gamma flip level at 6,971, signaling that market makers are still in a short-gamma environment, improving breadth and stable realized volatility are offsetting the negative flow dynamics.
This balance between stabilizing internals and fragile structure leaves the market in a holding pattern, neither supportive enough for a full risk-on posture, nor weak enough to justify going defensive.
The Neutral regime represents an equilibrium where liquidity and volatility are counteracting each other, and tactical flexibility is key.
From a portfolio management perspective, this is a wait-and-see environment:
Position sizing should remain moderate, and conviction should rise only if SPX moves closer to the gamma flip or volatility resumes compressing.
Tactical Allocation
Given the Neutral composite reading, the tactical allocation remains balanced between defensive and cyclical risk exposure:
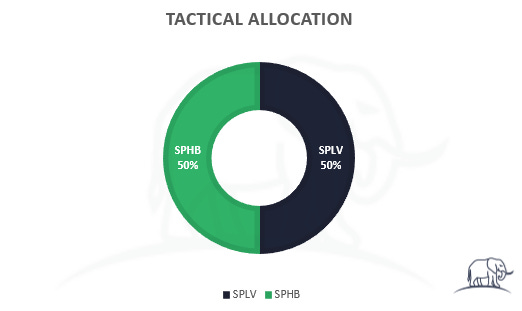
This mix allows participation if market breadth broadens further, while maintaining downside stability if volatility persists.
SPLV provides a low-beta anchor to reduce drawdown sensitivity, while SPHB captures cyclical upside if the market transitions back toward positive gamma.
If volatility continues to trend higher or breadth deteriorates, the model would shift toward a more defensive tilt (75% SPLV / 25% BTAL).
On the other hand, if SPX regains the gamma flip and volatility compresses, exposure would rotate back toward higher-beta components (75% SPHB / 25% SPXL).
Understanding The Tactical Allocation
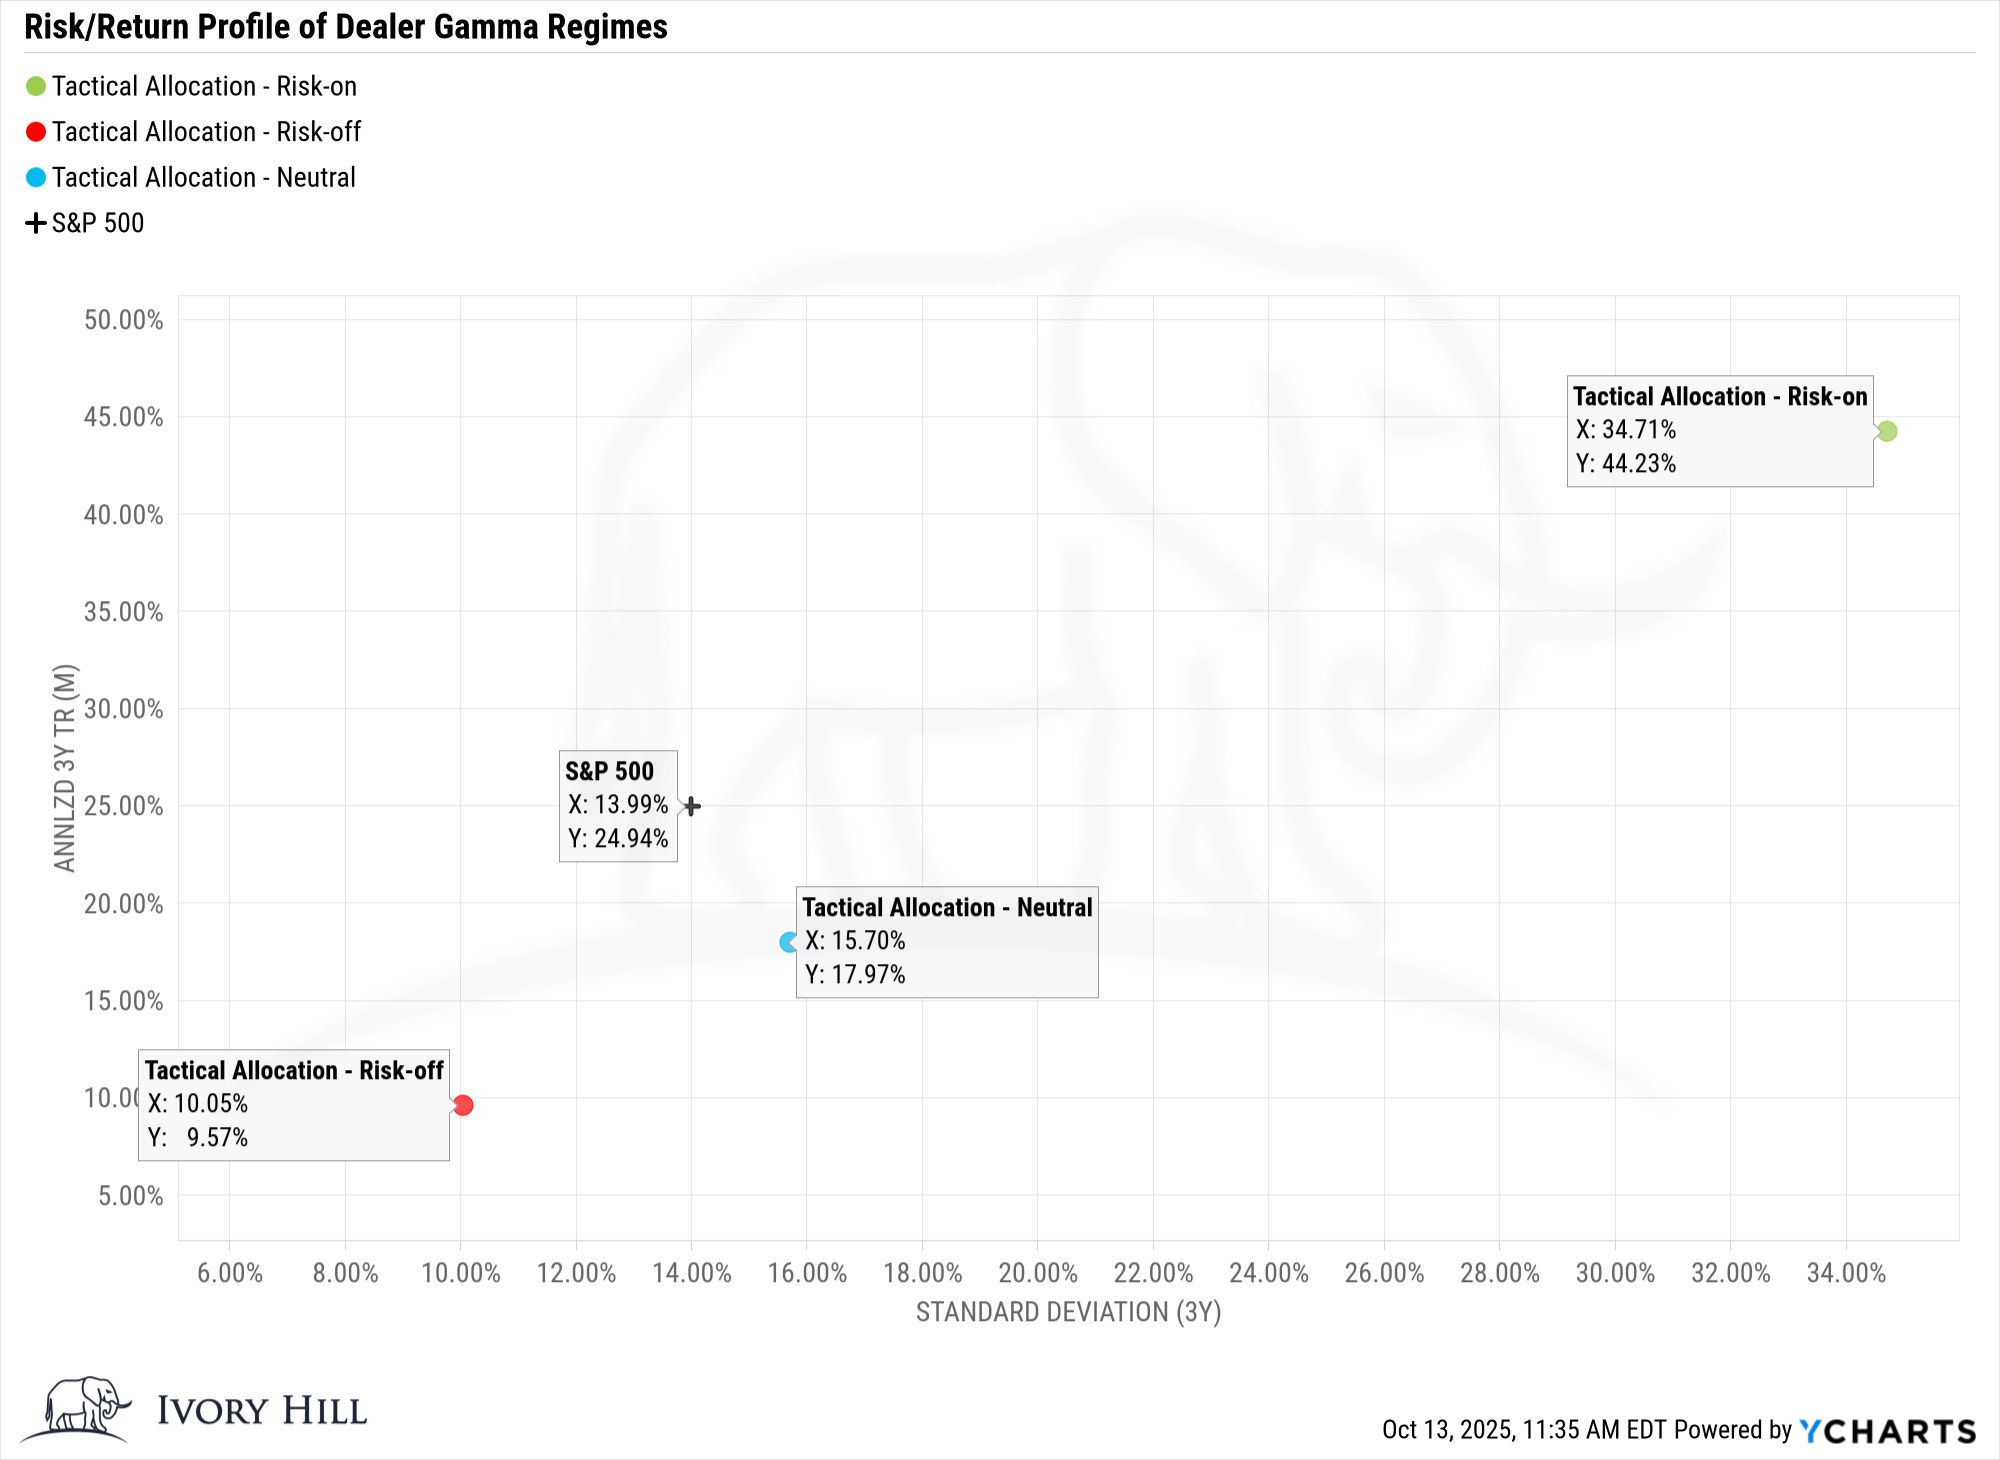
The Tactical Allocation framework is designed to translate complex market structure signals into actionable portfolio positioning.
Each week, I blend quantitative inputs on volatility, dealer gamma, systematic flows, and market breadth to determine the market’s Composite Regime: Risk-On, Neutral, or Risk-Off.
The tactical allocation model is designed to remain fully invested in equities at all times, but it shifts the mix between low-beta and high-beta exposures based on changes in market structure. The objective is to keep exposure constant while adjusting how that equity risk is expressed as volatility, liquidity, and dealer positioning evolve.
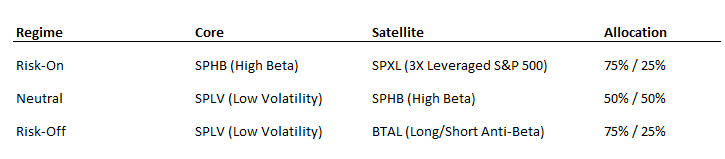
The satellite allocation changes dynamically depending on the current regime identified by the composite model:
Risk-On: 75% SPHB (high-beta factor) and 25% SPXL (3X leveraged S&P exposure). This combination targets accelerated upside capture when liquidity is improving, volatility is falling, and dealer gamma turns positive.
Neutral: 50% SPLV and 50% SPHB. This balanced mix allows participation in rallies while maintaining downside protection when signals conflict.
Risk-Off: 75% SPLV and 25% BTAL, which provides a market-neutral hedge that benefits when high-beta equities underperform.
This structure ensures the model stays continuously exposed to equities without relying on timing or cash positions. Instead of deciding whether to be “in or out” of the market, the model adjusts what kind of equity exposure is most efficient for the current liquidity regime.
The result is a portfolio that rotates naturally between offense and defense, guided entirely by quantifiable shifts in volatility, gamma positioning, and systematic flows, the same structural forces that drive more than 80% of daily market movement today.
The goal isn’t to predict short-term price action; it’s to align portfolio exposure with structural forces that dominate daily market behavior.
When dealer positioning, volatility trends, and systematic flows align positively, liquidity cushions price moves and volatility declines, creating a supportive backdrop for risk assets.
On the other hand, when those conditions deteriorate, liquidity evaporates, and volatility spikes tend to cascade.
By leaning into that reality, this model treats the market more like a liquidity ecosystem than a traditional valuation-driven environment and allocates accordingly.
Let me know what you thought of this week’s report. Your feedback helps me keep improving these each Monday.
Follow me on X for more updates.
And remember - The one fact pertaining to all conditions is that they will change.
Best regards,
-Kurt
Schedule a call with me by clicking HERE
Kurt S. Altrichter, CRPS®
Fiduciary Advisor | President
Disclosure
The Gamma Report is published by Ivory Hil, LLC. All opinions and views expressed in this report reflect our analysis as of the date of publication and are subject to change without notice. The information contained herein is for informational and educational purposes only and should not be considered specific investment advice or a recommendation to buy or sell any security.
The data, models, and tactical allocations discussed in this report are designed to illustrate market structure and positioning trends and may differ from portfolio decisions made by Ivory Hill, LLC or its affiliates. Investing involves risk, including the possible loss of principal. Past performance is not indicative of future results.
Ivory Hil, LLC, and its members, officers, directors, and employees expressly disclaim any and all liability for actions taken based on the information contained in this report.
Nice summary Kurt!