

Welcome to the second issue of the Gamma Report!
After being asked by many readers to help bridge the gap between market structure and practical portfolio management, I’m rolling out the Dealer Gamma Report.
Each week, this report will walk you through how liquidity, positioning, and volatility shape market behavior and, more importantly, how to turn those insights into smarter allocation decisions.
In a market where over 80% of daily volume comes from algorithmic trading, things move faster than ever. The key isn’t predicting headlines, it’s understanding the structural flows driving the tape.
Every Monday morning, I’ll publish this report with a clear read on the current regime, where risk is expanding or contracting, and how the model is positioning.
Important: I’m actively building and refining this model in real time. Each week, I’ll continue improving how the inputs are weighted, how the composite regime is scored, and how the tactical allocation responds.
That means the process will evolve sometimes slightly, sometimes significantly.
If you want to stay aligned with how this model develops, make sure to read each Monday’s report. Each version is one step closer to a fully adaptive system that reflects how today’s market truly trades.
Model Change: Enhancing Signal Accuracy with Dual-Gamma Inputs
Until recently, the model tracked only SPX dealer gamma. I’ve since added SPY dealer gamma as a secondary confirmation input to better capture ETF-driven flows that influence intraday volatility. The composite gamma signal now uses a 70/30 weighting between SPX and SPY, maintaining the institutional bias of SPX while integrating SPY’s broader liquidity footprint.
This approach improves stability without overreacting to short-term ETF flow noise.
Market Recap:
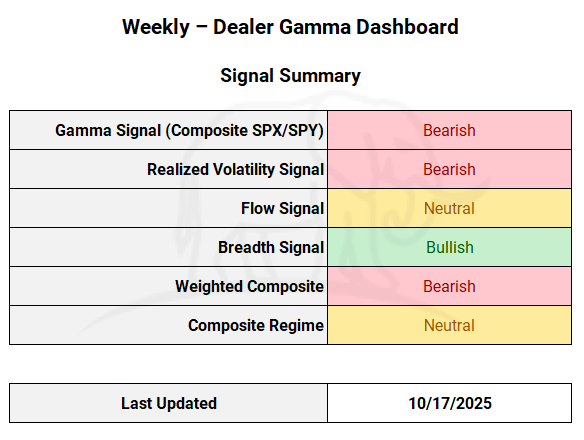
Last week closed with the Ivory Hill Composite Regime holding Neutral with a defensive tilt. Despite choppy intraweek action, both SPX and SPY ended higher week-over-week, while volatility remained stable and breadth improved modestly.
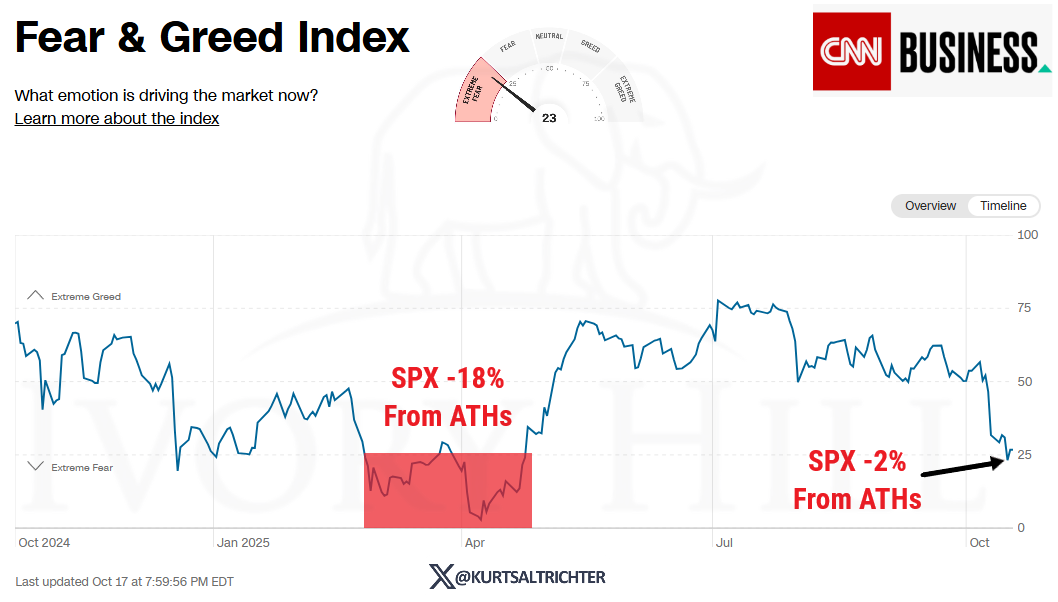
The market still feels more uncertain than fearful, caught in a tug-of-war between stabilizing risk and lingering hedging pressure.
Gamma Signal (SPX/SPY)
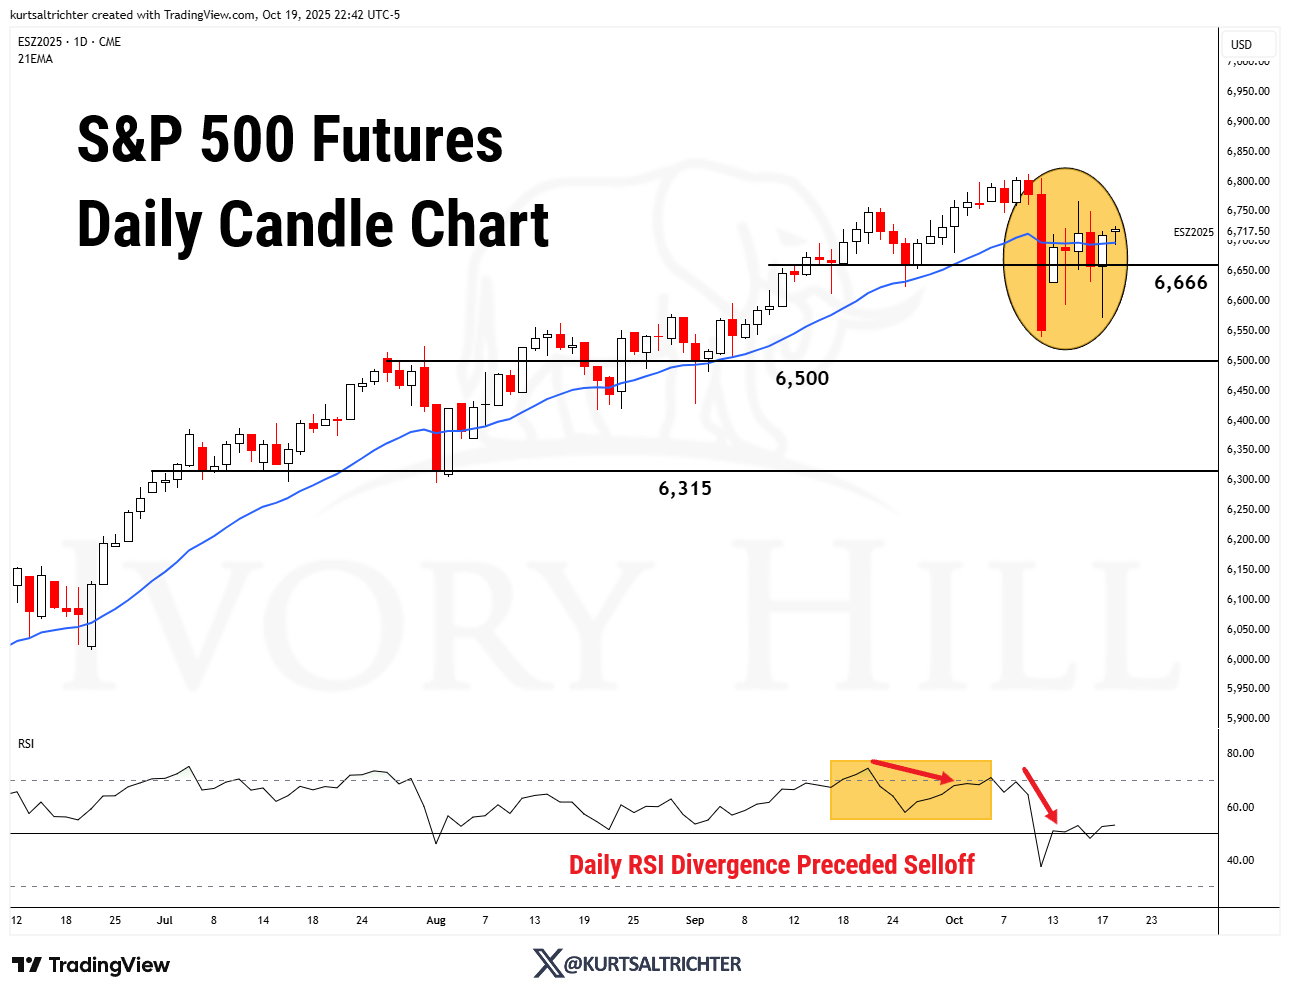
SPX Spot: 6,659
SPX Gamma Flip: 6,663
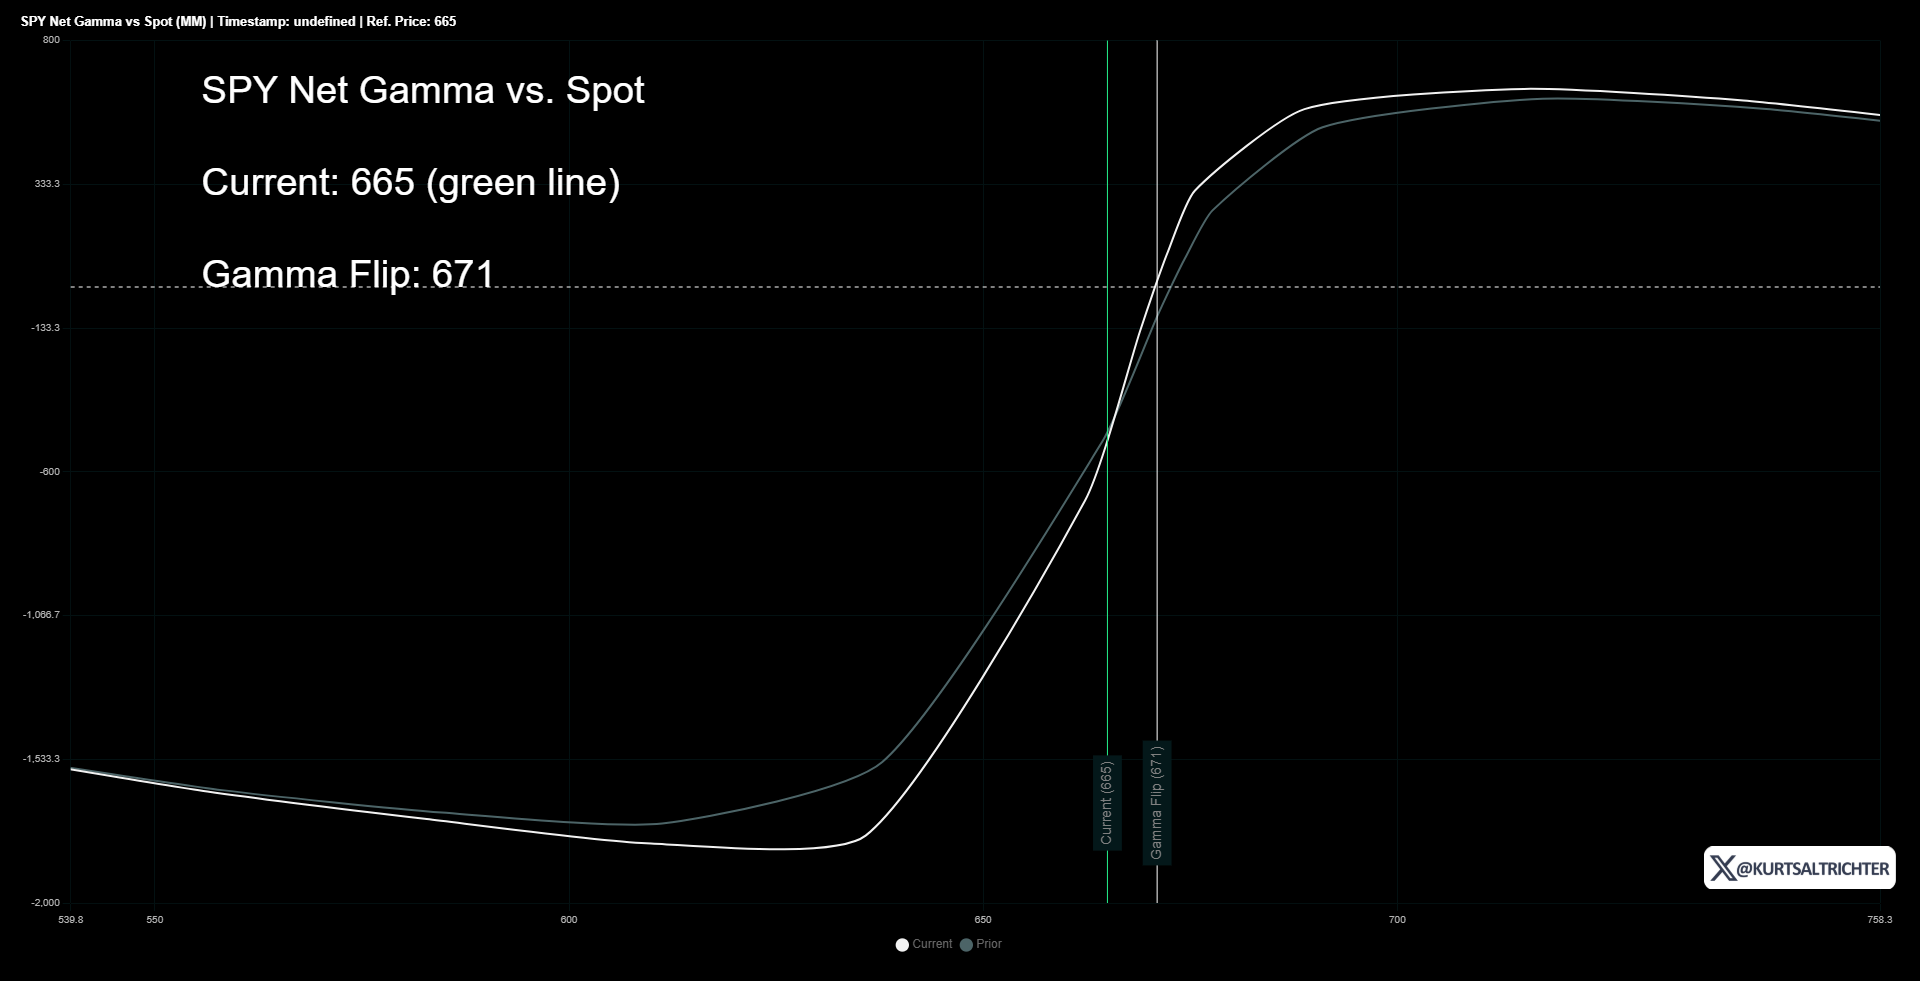
SPY Spot: 665
SPY Gamma Flip: 671
Regime Score: Neutral
SPX and SPY both spent most of the week near their respective gamma flip lines (SPX ~6,663 and SPY ~ 671).
While price levels oscillated around those key thresholds, dealer gamma exposure stayed negative, keeping intraday volatility elevated but contained within the expected ranges.
This structure typically supports short-term whipsaws as dealers dynamically hedge, and price moves are amplified in both directions until the spot decisively clears the flip line.
The inclusion of both SPX and SPY dealer gamma inputs (previously only SPX) has made the signal more robust. SPY tends to reflect broader ETF flow sensitivity, while SPX captures institutional hedging dynamics. The model now applies 70/30 weighting between SPX and SPY gamma to better measure the full options landscape.
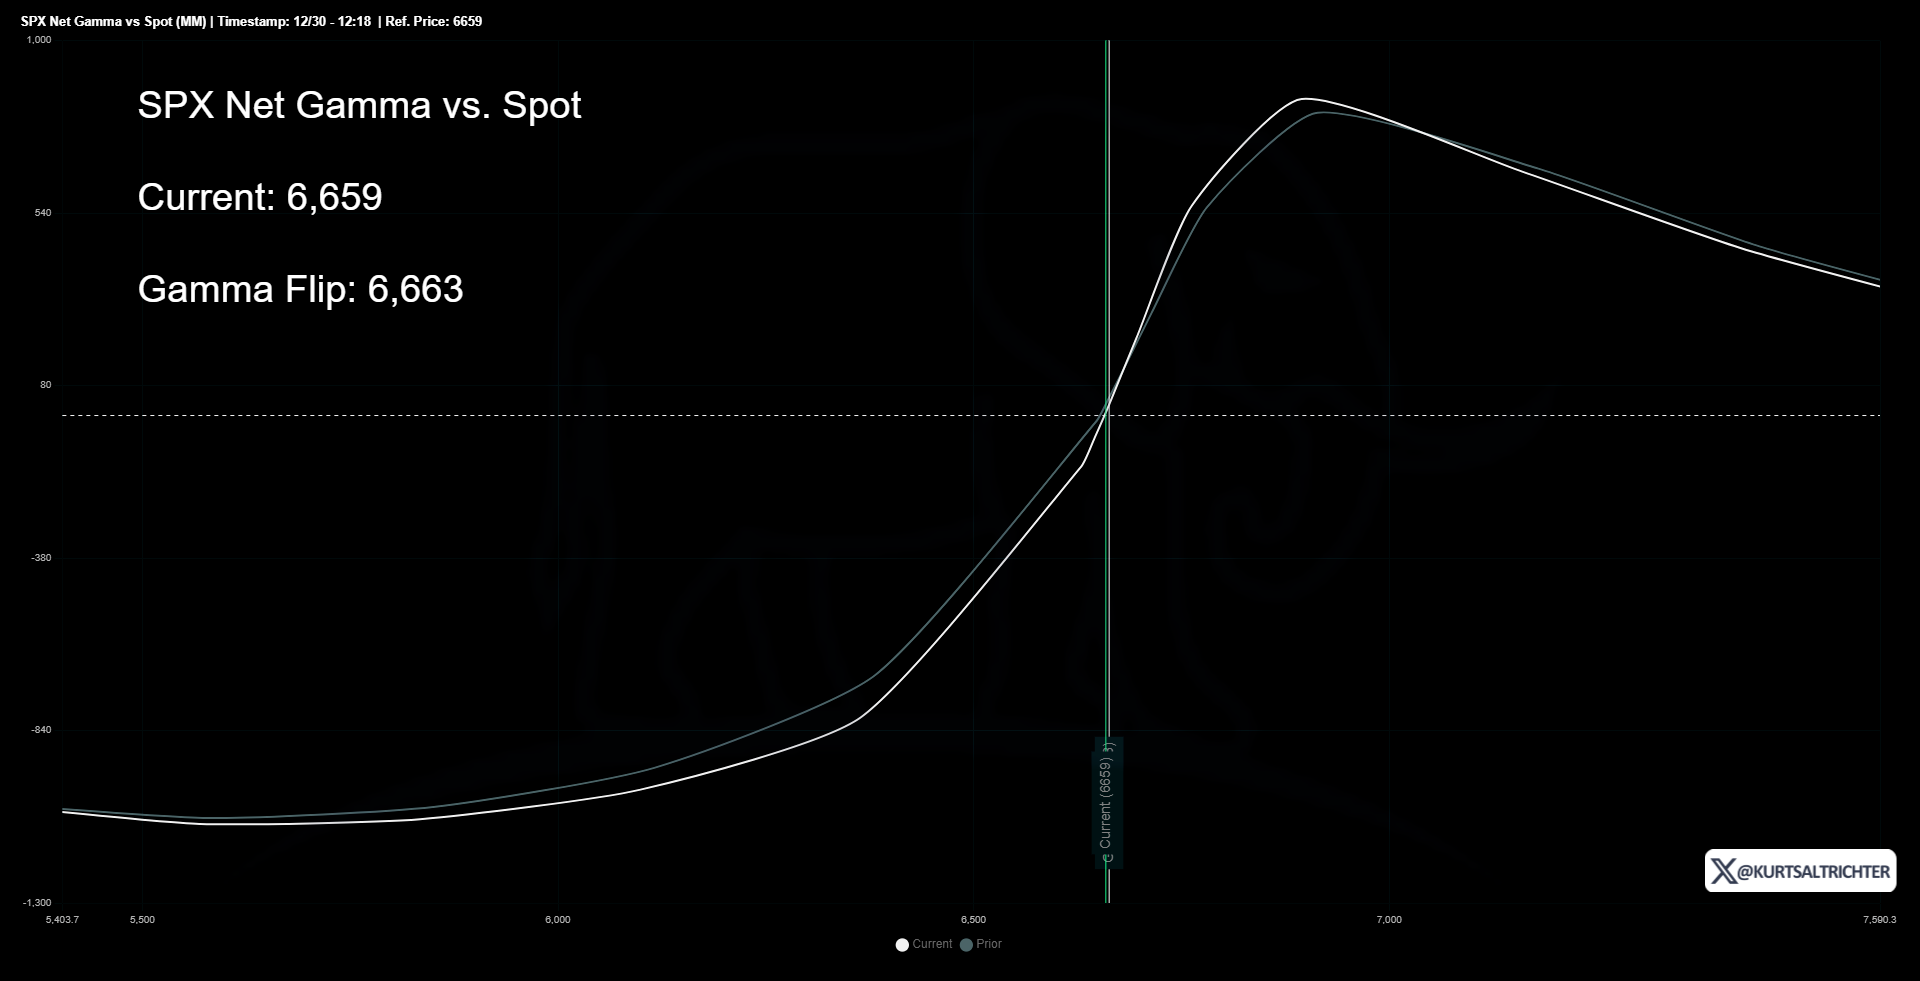
SPX spent most of the week below its gamma flip line, keeping the market in a short gamma environment.
This regime amplifies price movement. When the market sells off, dealers sell more to hedge; when it rallies, they buy, increasing intraday whipsaws.
Investor Takeaway:
Expect exaggerated moves in both directions until the spot reclaims the gamma flip line on both SPX and SPY. Expect larger intraday ranges and short-lived rallies. Volatility events are likely to overshoot, not fade.
Realized Volatility
30-Day RV: 11.0% (up from 7.5%)
90-Day RV: 10.13%
Signal: Bearish
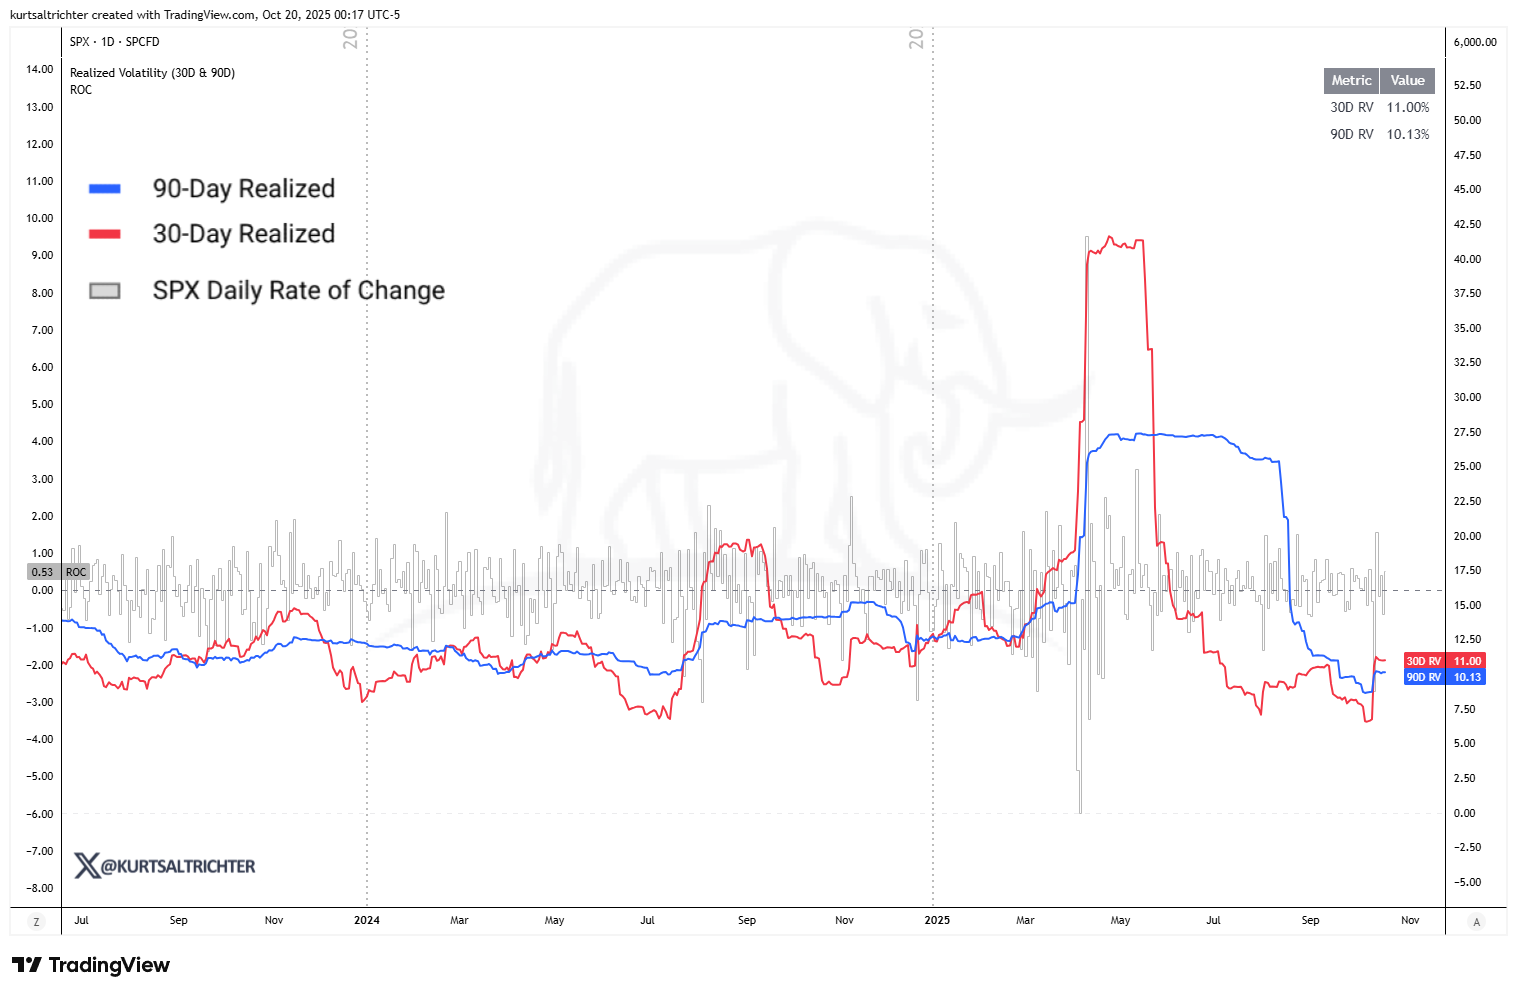
Short-term realized volatility ticked higher but remains well within normal bounds. The 30D and 90D measures are holding steady, suggesting contained volatility rather than a breakout. The mixed RV signal reflects an indecisive environment where volatility is no longer falling, but not yet accelerating, effectively a neutral read rather than bullish.
The 30-day measure crossed above the 90-day, confirming that short-term volatility is rising faster than long-term trends, a key bearish signal.
Investor Takeaway:
The current level keeps systematic buyers, such as vol-control and risk-parity funds, on the sidelines. These strategies mechanically cut exposure when volatility rises. Expect reduced liquidity and more erratic moves until realized volatility compresses below 9%.
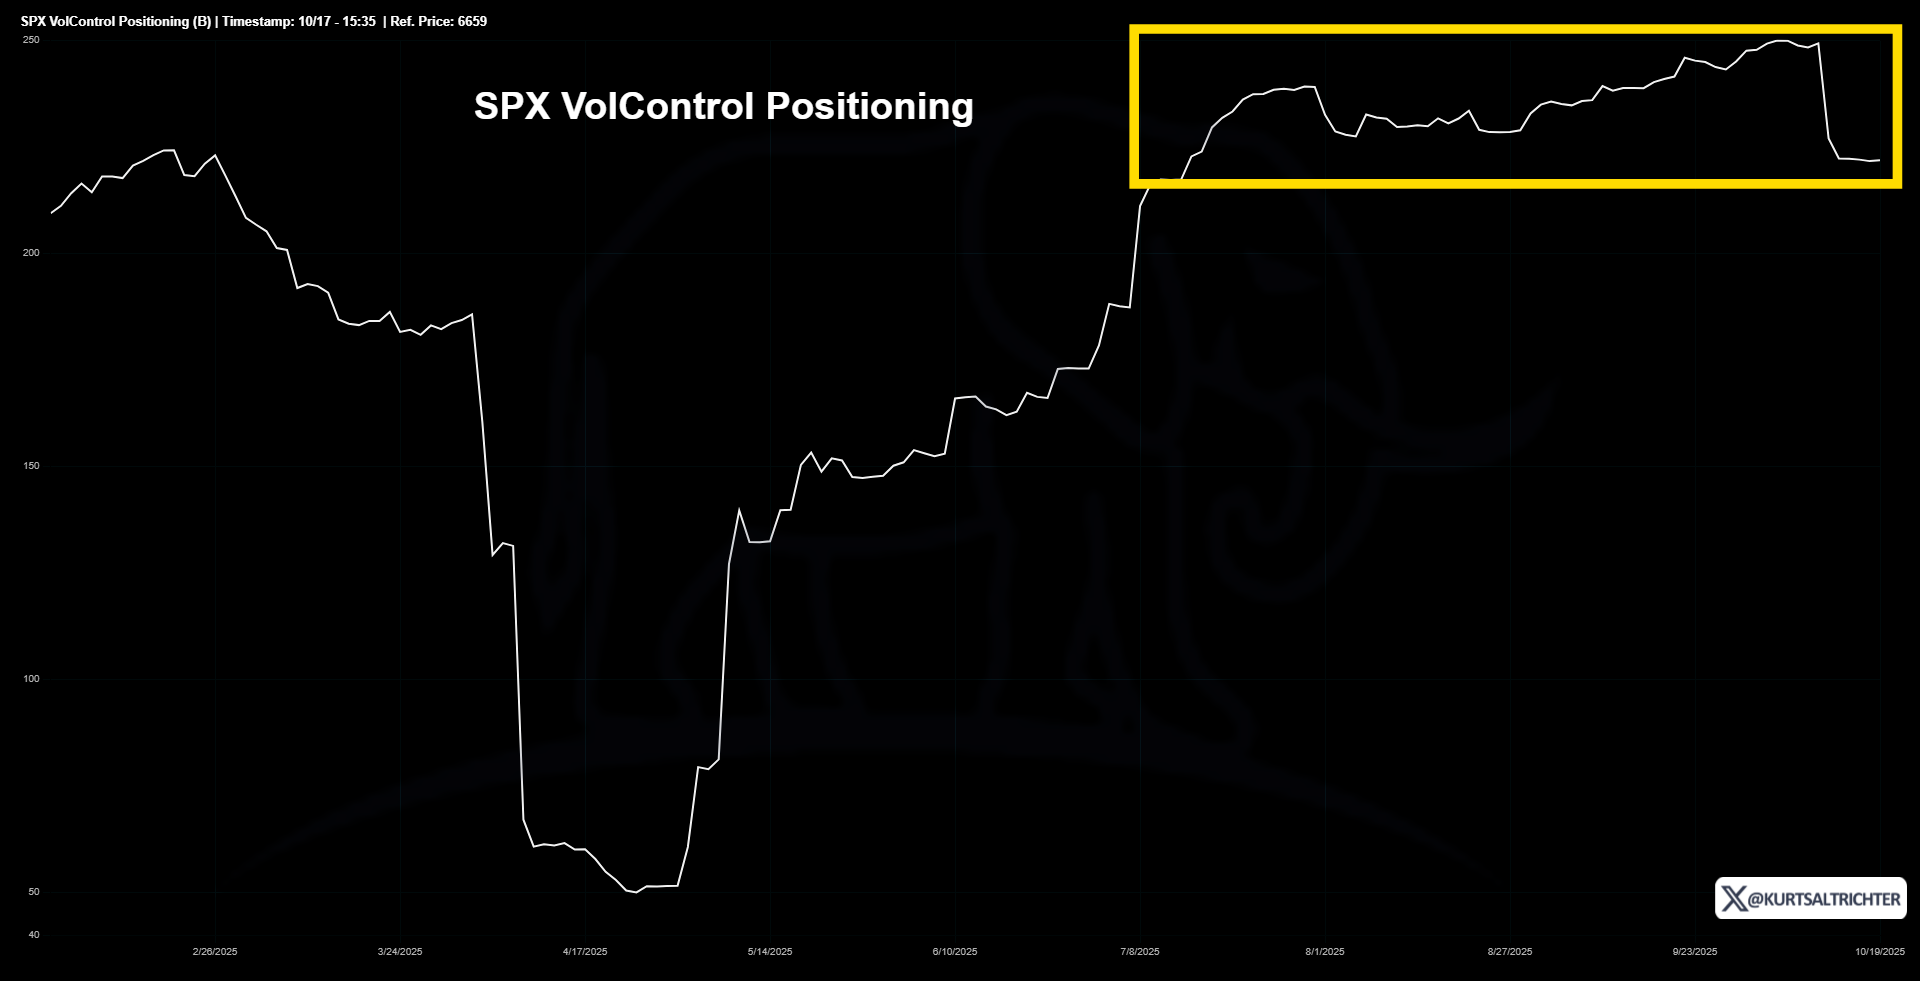
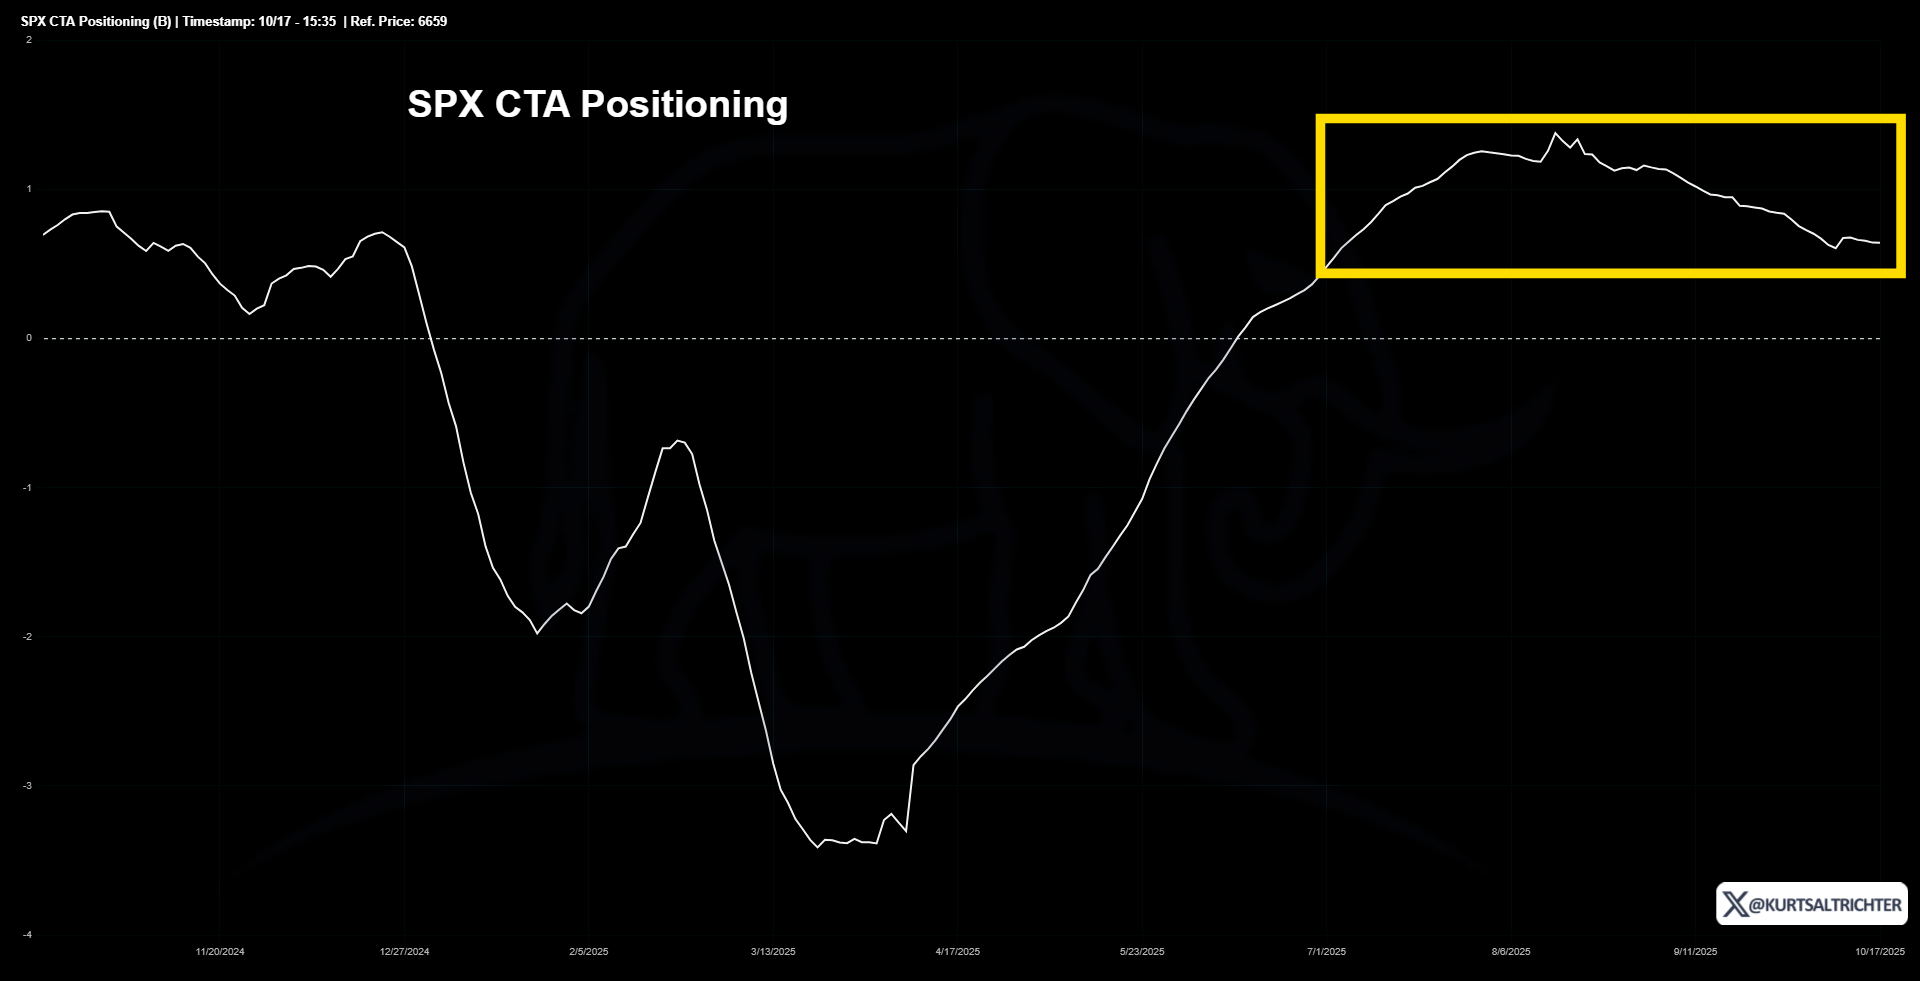
Systematic Flows
Flow Score: 0 → Neutral
CTA Trend: Falling
Vol-Control Trend: Flat
VolControl funds are typically the first to de-risk as realized volatility spikes, triggering automatic selling. VolControl models react mechanically to changes in volatility and often move ahead of trend-following systems, like CTAs.
CTAs, however, have not mirrored that reduction in longs. Their positioning remains relatively stable, which suggests that broader trend signals across major indices have not yet flipped bearish. This divergence is constructive for equity markets because it implies that systematic selling pressure is still limited to volatility-targeting strategies rather than trend-based ones.
If volatility stabilizes, VolControl models will likely begin rebuilding exposure, and the absence of large-scale CTA selling leaves room for upside reflexivity. In short, VolControl selling without a corresponding CTA unwind can often mark a near-term exhaustion point in downside pressure, a favorable setup for bulls heading into the week.
Systematic supply is slowing, not accelerating, another factor keeping the model Neutral.
Investor Takeaway:
The bleeding has stopped, but the patient isn’t recovering yet. A decline in realized volatility is still required before these programs add back risk. Systematic players aren’t selling aggressively, but they’re not buying either. Until realized volatility normalizes, the bid remains fragile.
Breadth
% of S&P 500 Above 200-Day: 60.8%
Signal: Bearish
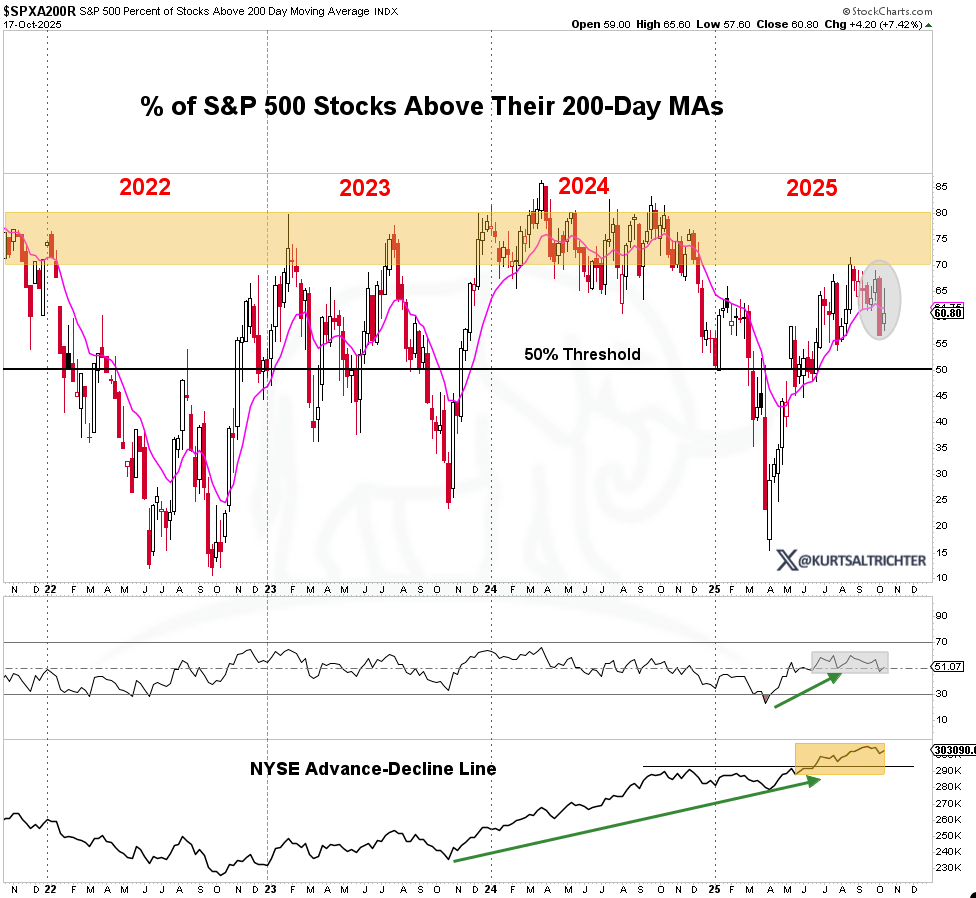
Breadth improved slightly, with 60.8% of S&P 500 constituents above their 200-day moving average, up from 56.6% the prior Friday. That incremental improvement is key; markets with breadth above 50% tend to be internally stable, even if headline indices stall. This move supports the Neutral regime signal, implying broad participation rather than narrow leadership.
Investor Takeaway:
Participation is improving, but not enough to flip the signal bullish.
Composite Regime
Current Regime: Neutral
Previous Regime: Neutral
Overall, the system continues to register crosscurrents rather than a directional break, negative gamma offsets improving breadth, while stable vol and neutral flows keep conditions balanced.
Investor Takeaway:
Staying balanced, not overly defensive or aggressive, remains the right stance until conviction builds across signals.
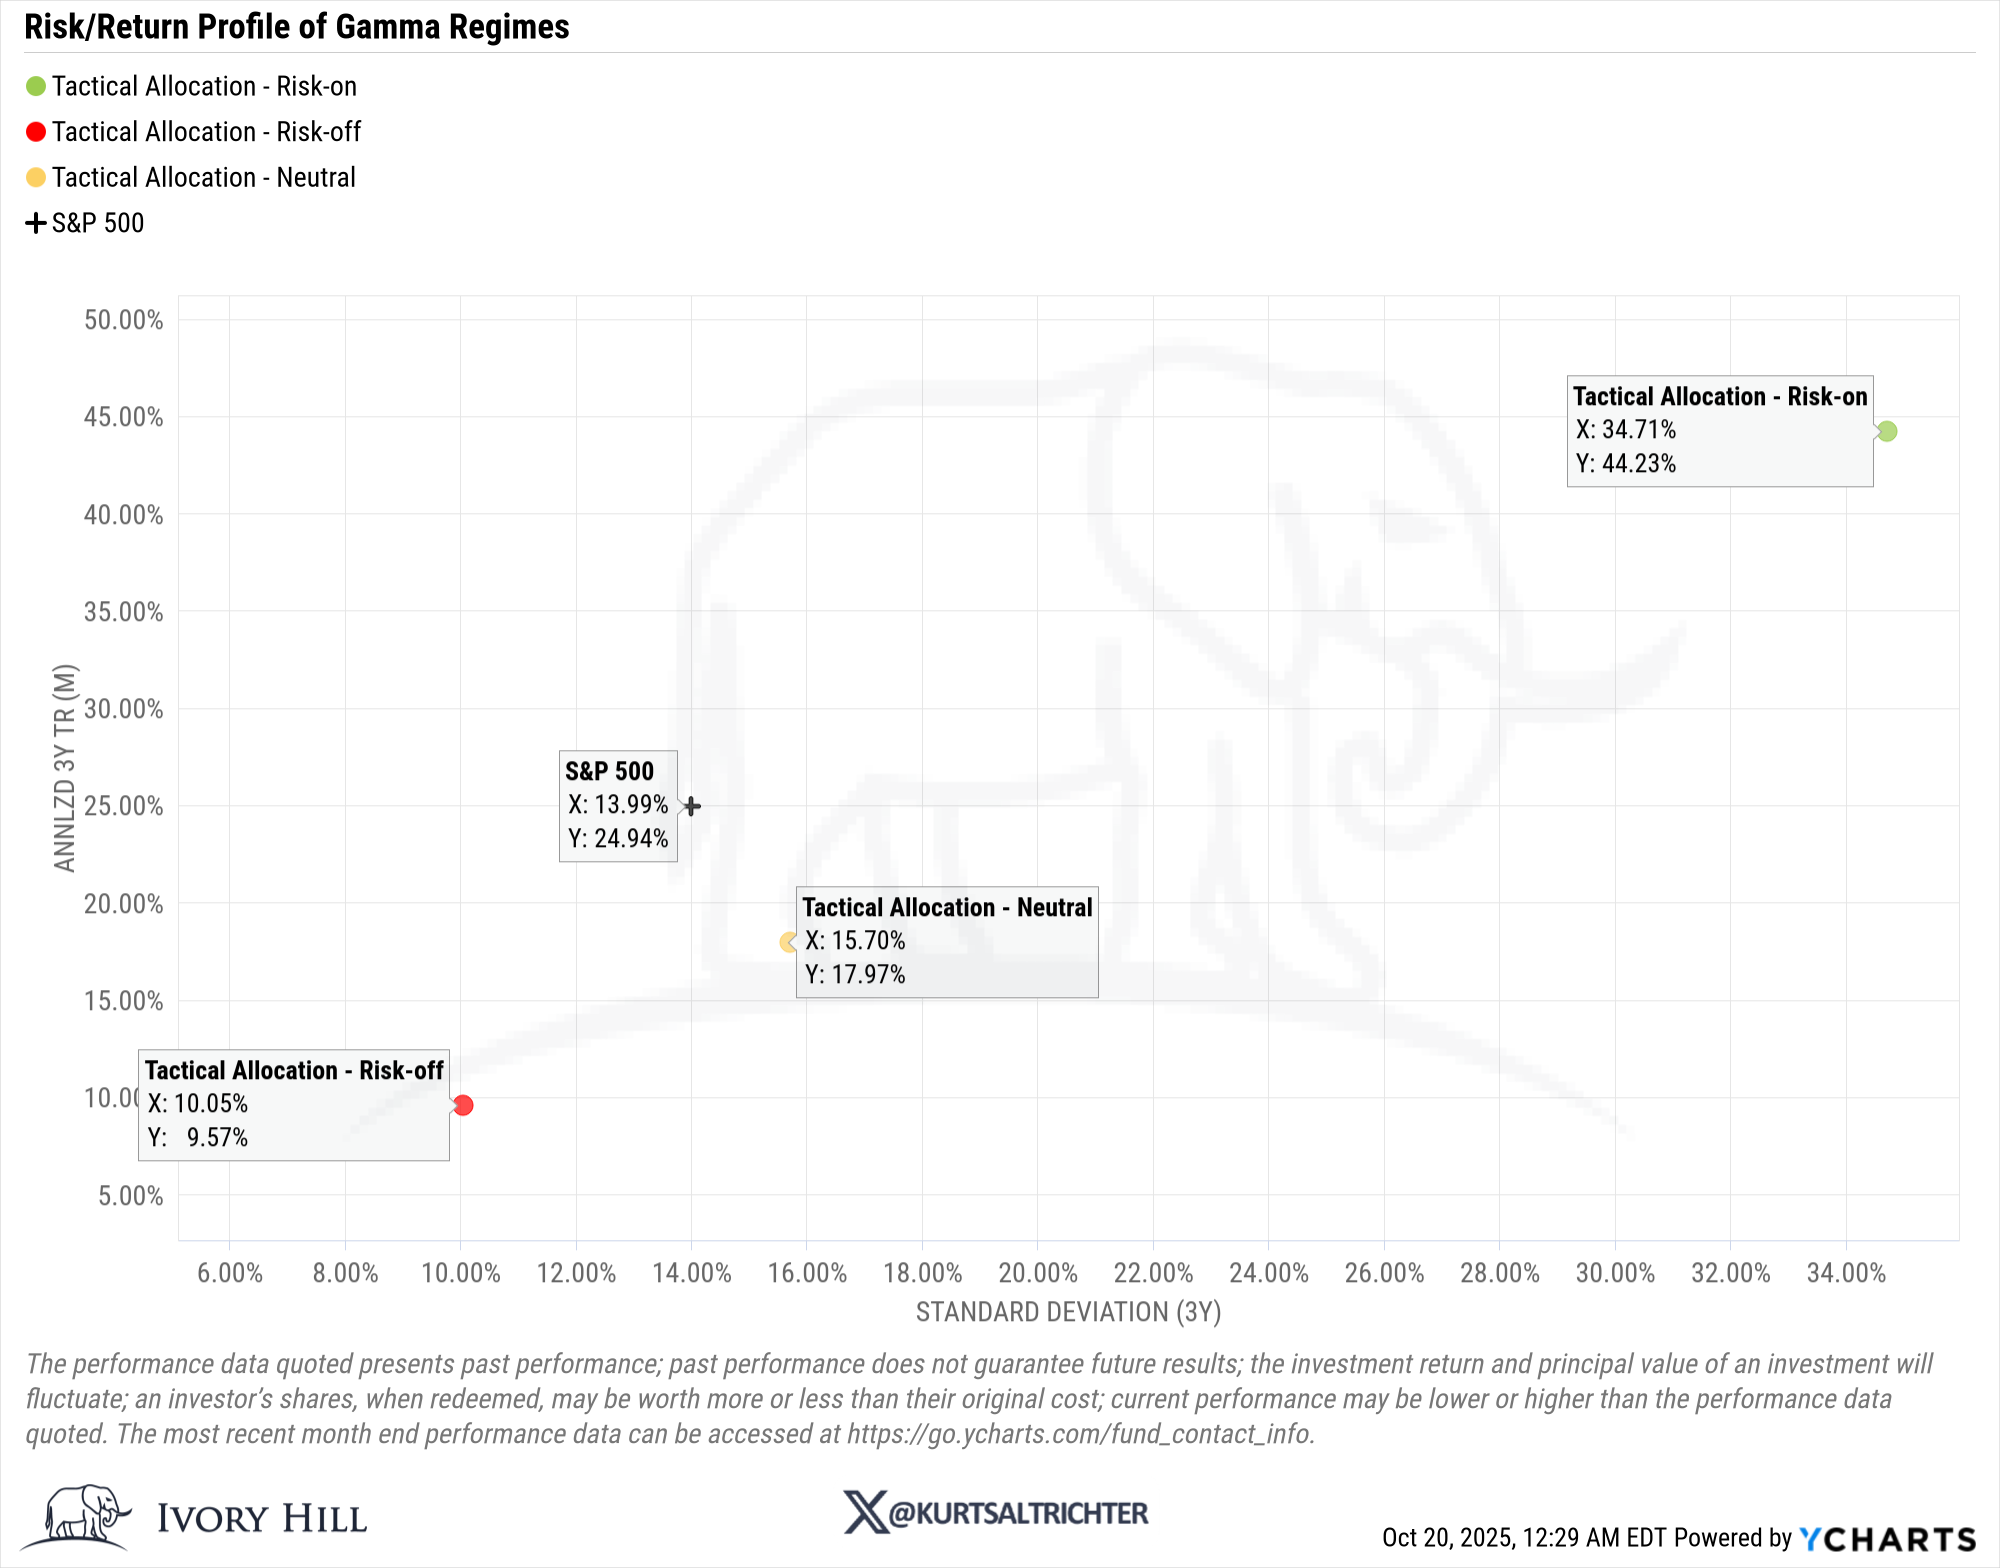
Tactical Allocation Performance
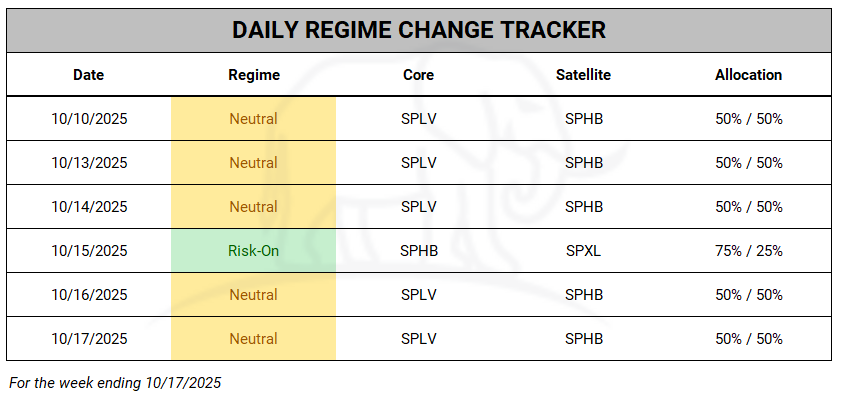
The daily tactical model maintained a mostly Neutral posture last week, emphasizing stability while adjusting to short-term volatility shifts:
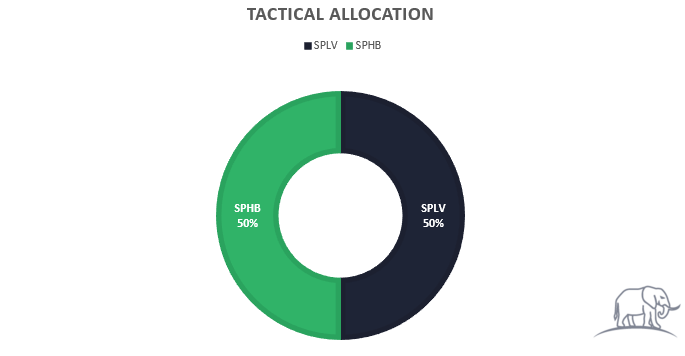
Monday–Wednesday: Neutral (50% SPLV / 50% SPHB) positioning captured steady upside but showed caution ahead of midweek volatility.
Thursday: Briefly moved Risk-On (75% SPHB / 25% SPXL) as momentum improved, but the signal quickly faded as volatility returned, resulting in downside capture and underperformance.
Friday: Reverted to Neutral (50% SPLV / 50% SPHB) to protect gains and reduce exposure heading into the weekend.
This sequence reflected a disciplined, adaptive approach, rotating selectively into strength without overcommitting risk in a choppy gamma environment.
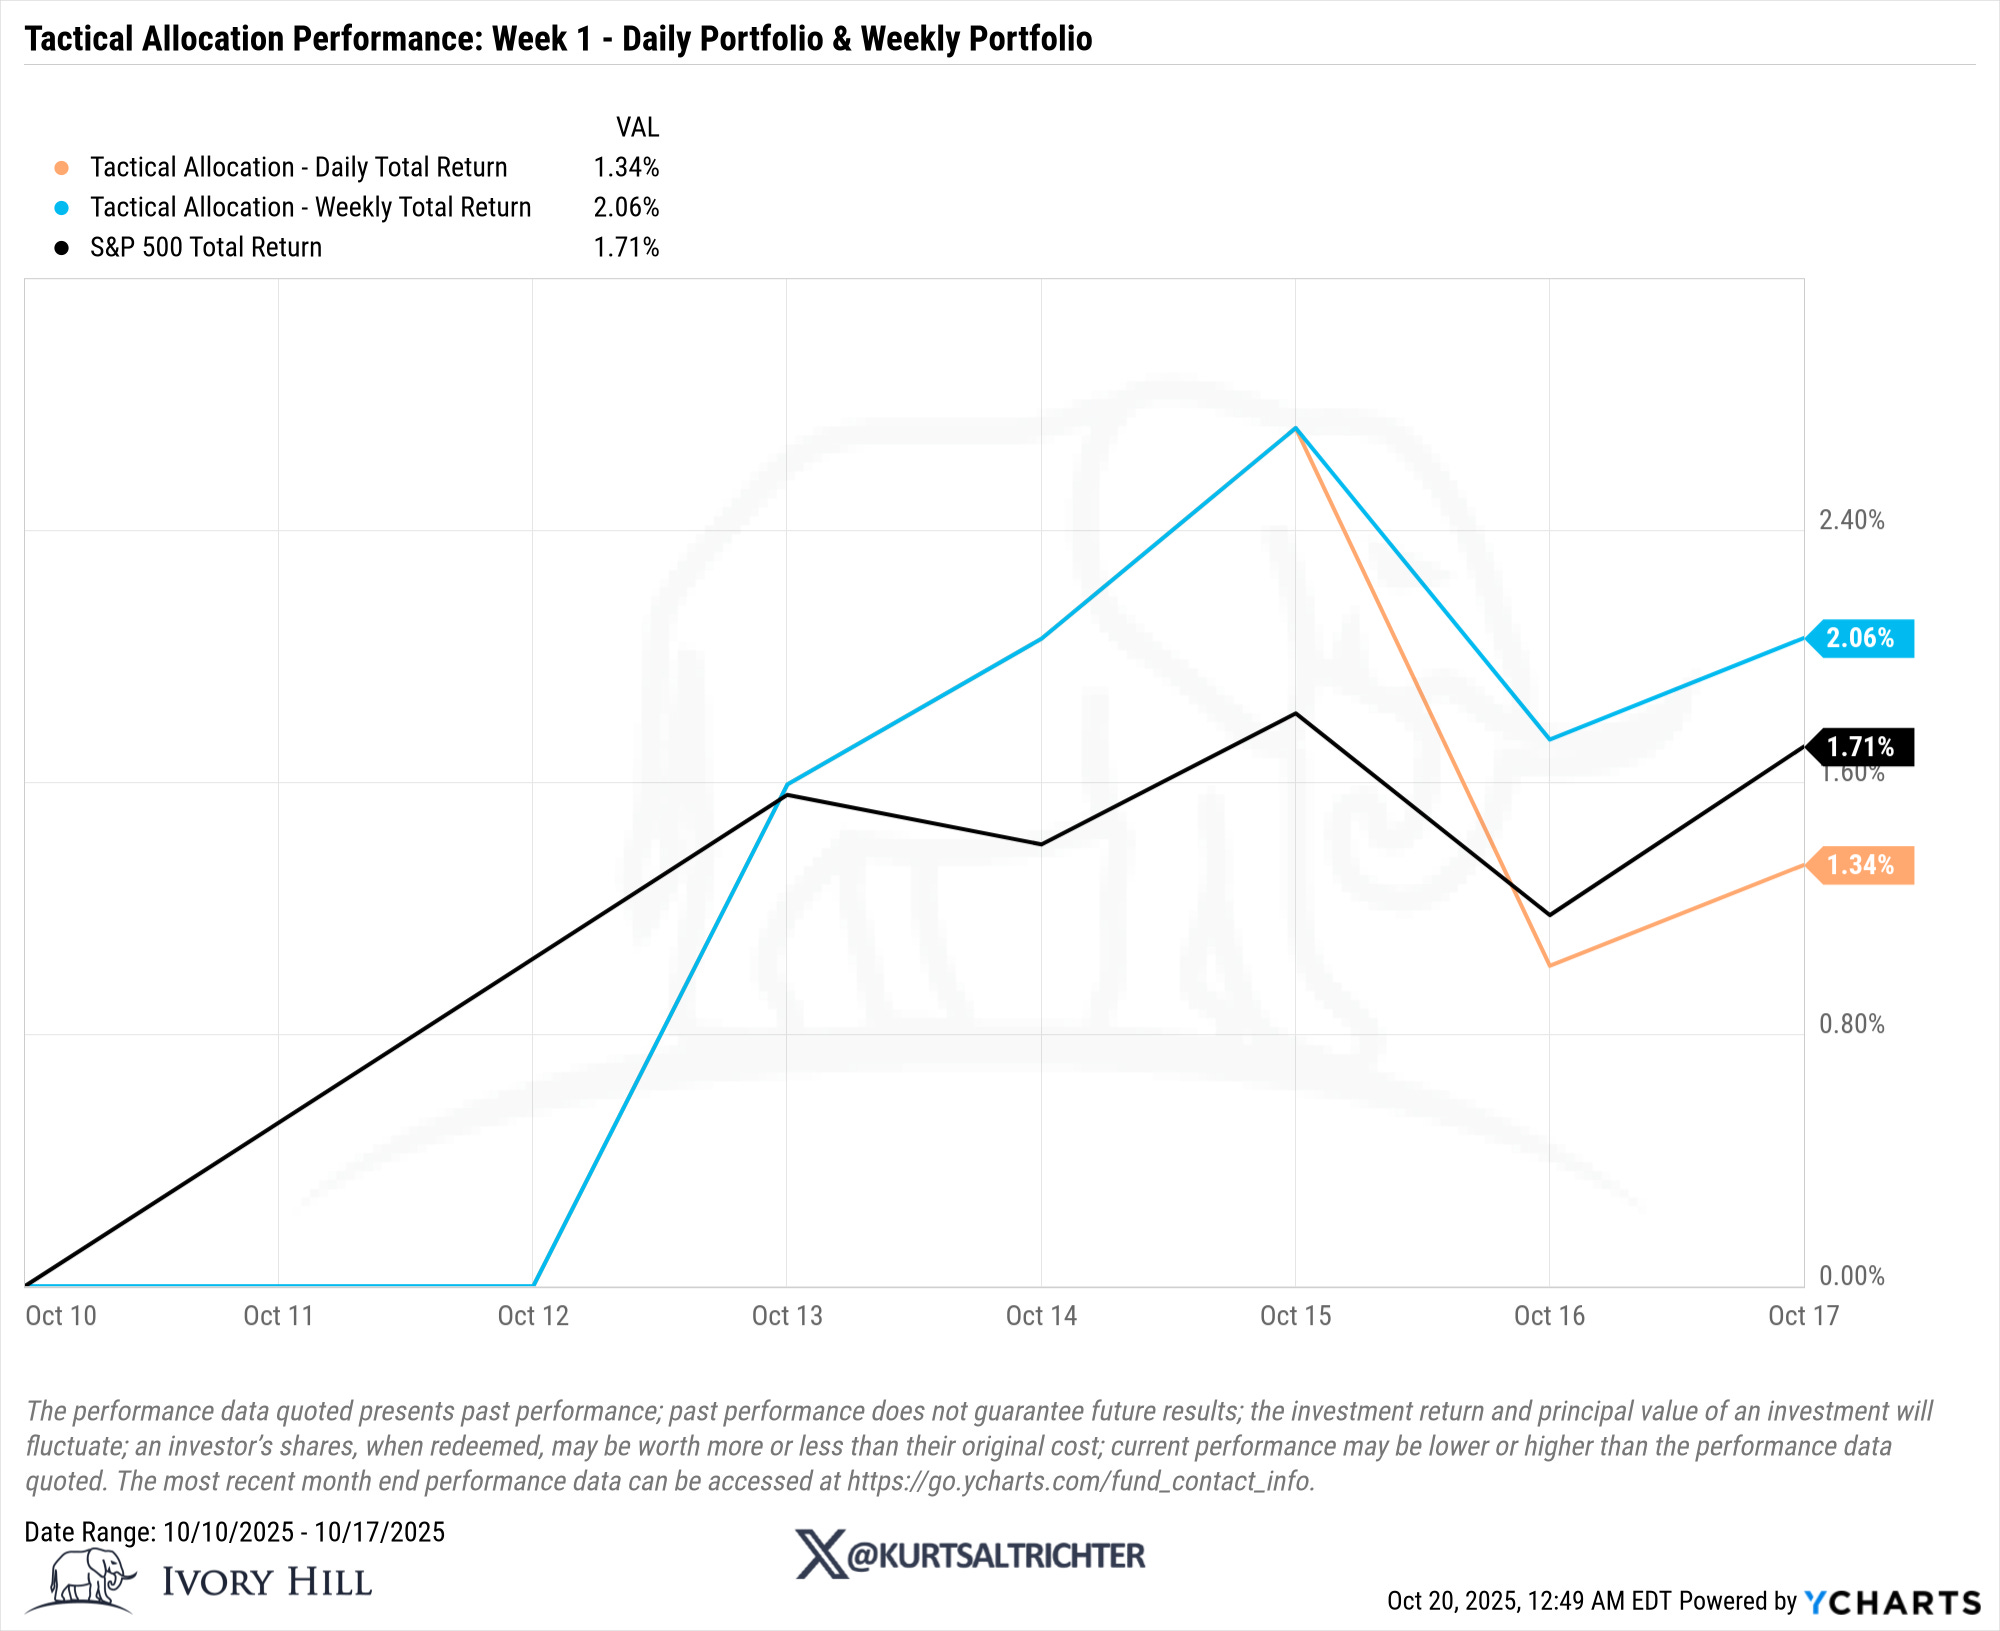
Performance Summary:
Daily Tactical Allocation: +1.34% (daily moves)
Weekly Tactical Allocation: +2.06% (weekly moves)
S&P 500 Total Return: +1.71%
The daily model captured less upside due to faster rotations and a midweek flip from Risk-On to Neutral. Still, that quick shift helped limit drawdowns during Thursday’s fade.
The weekly model, which held a consistent Neutral posture throughout the week, benefited from lower turnover and smoother performance relative to the faster-rotating daily system.
Investor Takeaway
Both models continue to favor a balanced posture, signaling that despite improving breadth and stability in volatility, the market remains in a fragile equilibrium where discipline matters more than chasing short-term strength.
Outlook: The Week Ahead
If breadth continues improving and SPX reclaims its gamma flip (~6,663) while realized vol trends lower, the model could rotate Risk-On. Conversely, renewed volatility pressure or systematic selling from CTAs would pull the model back toward Risk-Off.
Key Levels to Watch:
SPX Gamma Flip: 6,663
SPY Gamma Flip: 671
Realized Vol (30D): Needs to fall below 9% for regime improvement
Percent of S&P 500 Above 200-DMA: 60.8%, an improvement above 65% would confirm stronger breadth support.
CTA Trend: Still Falling, stabilization would mark an important shift toward risk-on conditions.
Coaching Notes:
Buy into weakness near the close, not during the morning bursts of mania.
Sell rips early during the morning bursts of mania, when gamma hedging amplifies upside.
Stay nimble, as market direction is increasingly driven by intraday positioning rather than fundamentals.
Final Thoughts
Despite the S&P 500 closing higher week over week, the underlying signals are mixed, realized volatility ticked up slightly, breadth improved modestly, and both CTA and Vol-Control exposure held steady. That balance between improving internals and fading volatility support is why the composite regime closed Neutral rather than Risk-On.
I’m continuing to build and refine this system in real time, testing the weightings, thresholds, and data inputs each week to improve accuracy and responsiveness. These weekly reports will document that process, so if you’re following along, make sure to check in every Monday to stay current with the latest signals and allocations.
Heading into the week, watch for follow-through in breadth and more muted volatility. If realized vol eases and dealer gamma rises back into positive territory, conditions will shift back to Risk-On. Until then, remaining selectively defensive continues to make sense.
And remember - The one fact pertaining to all conditions is that they will change.
Follow me on X for more updates.
Best regards,
-Kurt
Schedule a call with me by clicking HERE
Kurt S. Altrichter, CRPS®
Fiduciary Advisor | President
Disclosure
The Gamma Report is published by Ivory Hil, LLC. All opinions and views expressed in this report reflect our analysis as of the date of publication and are subject to change without notice. The information contained herein is for informational and educational purposes only and should not be considered specific investment advice or a recommendation to buy or sell any security.
The data, models, and tactical allocations discussed in this report are designed to illustrate market structure and positioning trends and may differ from portfolio decisions made by Ivory Hill, LLC or its affiliates. Investing involves risk, including the possible loss of principal. Past performance is not indicative of future results.
Ivory Hil, LLC, and its members, officers, directors, and employees expressly disclaim any and all liability for actions taken based on the information contained in this report.