

Last week was not about direction. It was about the market becoming stronger.
Price moved higher, but the bigger change happened underneath. Dealer positioning moved back into a more supportive setup, realized volatility stayed contained, and breadth finally stopped fighting the tape.
That means the conditions that turn small pullbacks into fast problems are no longer there. The tape became more forgiving. That distinction is everything in late-cycle markets.
By Friday’s close, the model rotated back toward offense, while keeping the overall regime disciplined.
Model Changes
As stated 13 weeks ago when I started this report, I am building this model in real-time.
Markets change, and a framework that never adapts eventually stops reflecting reality. The objective has always been the same: measure structure, manage risk, and stay aligned with how liquidity actually behaves. What evolves is how the signals are calibrated as we collect more data and watch how they interact through different regimes.
Over the past week, I made targeted adjustments to improve the model's interpretation of volatility and participation. These were not changes to inputs or philosophy. They were refinements to reduce noise and better capture trend persistence.
Realized volatility is now treated as a trend rather than a daily event.
The volatility signal was adjusted to emphasize the relationship between short-term and longer-term realized volatility, with added smoothing. When 30-day realized volatility is below 90-day realized volatility, the model now maintains a constructive bias rather than flipping defensive on minor upticks. Translation: If 30D RV is below 90D RV, the model can’t be bearish; it can only be neutral or bullish. This more accurately reflects how volatility-targeting strategies actually behave.
Breadth is evaluated for confirmation, not punished for strength.
The breadth signal was recalibrated so that elevated participation does not automatically trigger a bearish score. Breadth can stay strong for extended periods in healthy markets. The model now focuses on whether participation is holding or deteriorating, not simply whether it reached a high level.
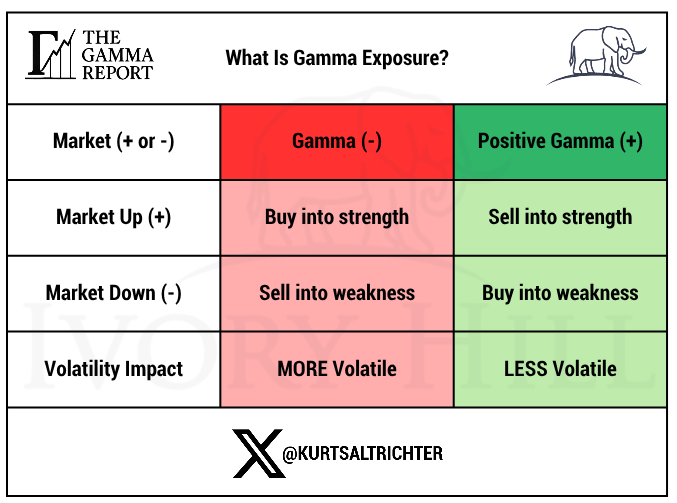
Gamma remains the anchor.
No changes were made to how dealer gamma is treated. The gamma flip line still carries the heaviest weight and still defines when liquidity dynamics shift.
The composite neutralizes more deliberately.
When signals conflict, the model now spends more time in Neutral instead of forcing a Risk-On or Risk-Off posture. Neutral is a position. In late-cycle markets, it is often the correct one.
The goal of these changes was not to increase risk or improve performance. It was to reduce false signals and improve alignment with how the market actually transitions between regimes.
Same framework. Better calibration.
Signal Summary
As of the 1/9 close, the signal stack reads:
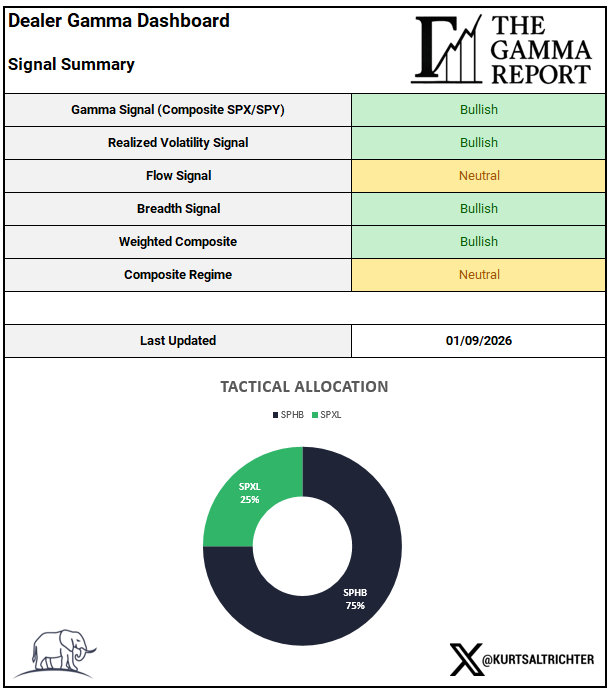
Three of the four core inputs turned bullish. This is what a solid market structure looks like when confirmation is improving, but conviction has not yet been earned.
Gamma and Price Structure
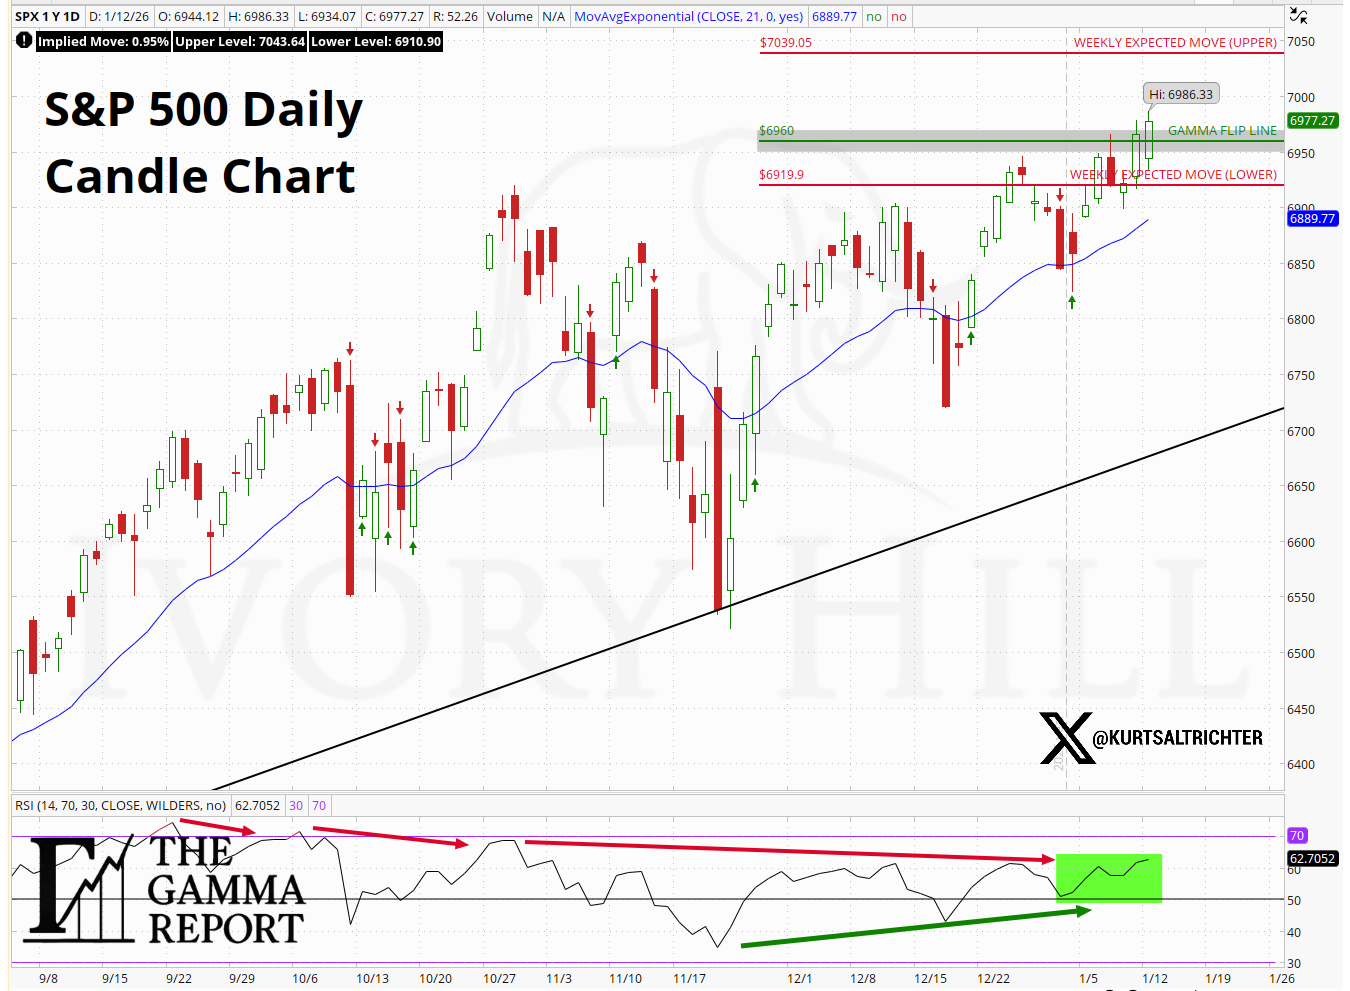
SPX closed Friday at 6,957.
The gamma flip line sits near 6,960.
Price is back above the flip, and that changes how the market behaves. Above this level, dealers tend to lean against moves. Pullbacks slow down. Extensions lose momentum. Below it, those dynamics reverse quickly.
The net gamma history confirms the shift. Recent readings pushed back into positive territory, reversing the unstable setup that defined the first days of the year.
Key levels to respect:
Gamma Flip Line: ~6,960
Upper Expected Move: ~7,039
Lower Expected Move: ~6,920
Short-term trend support: ~6,890
As long as price holds above the flip line, downside should remain more contained.
Weekly Expected Move
For the week ahead, the expected move is ±59.58 points (0.85%):
Upper: 7,039.05
Lower: 6,919.90
Implied Volatility: 10.64%

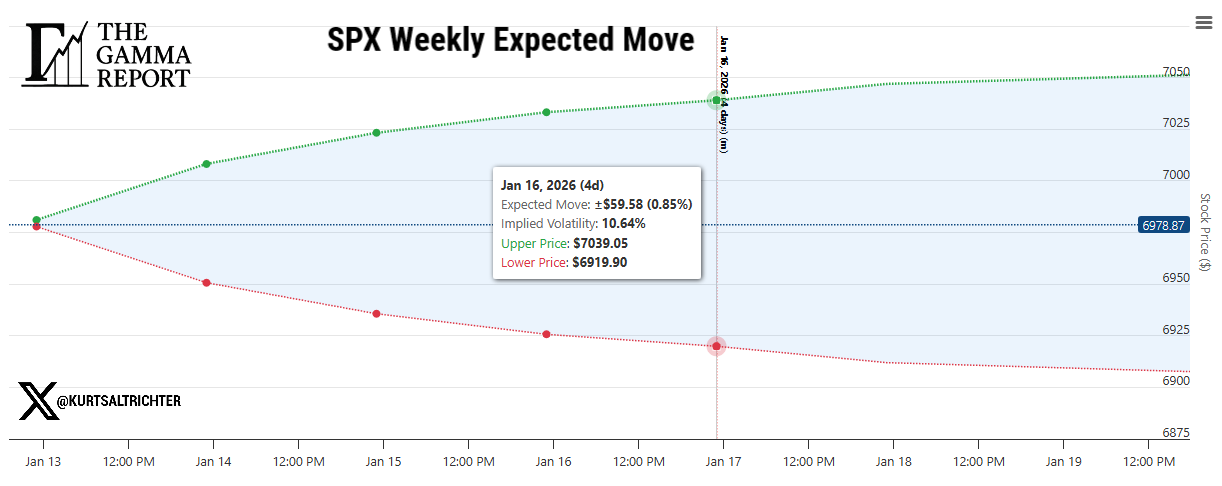
This is a tight risk box. When ranges compress, the market stops paying for urgency. The edge shifts toward respecting the range and waiting for confirmation rather than forcing conviction.
This is not a market paying investors to guess.
Realized Volatility
Realized volatility remains cooperative.
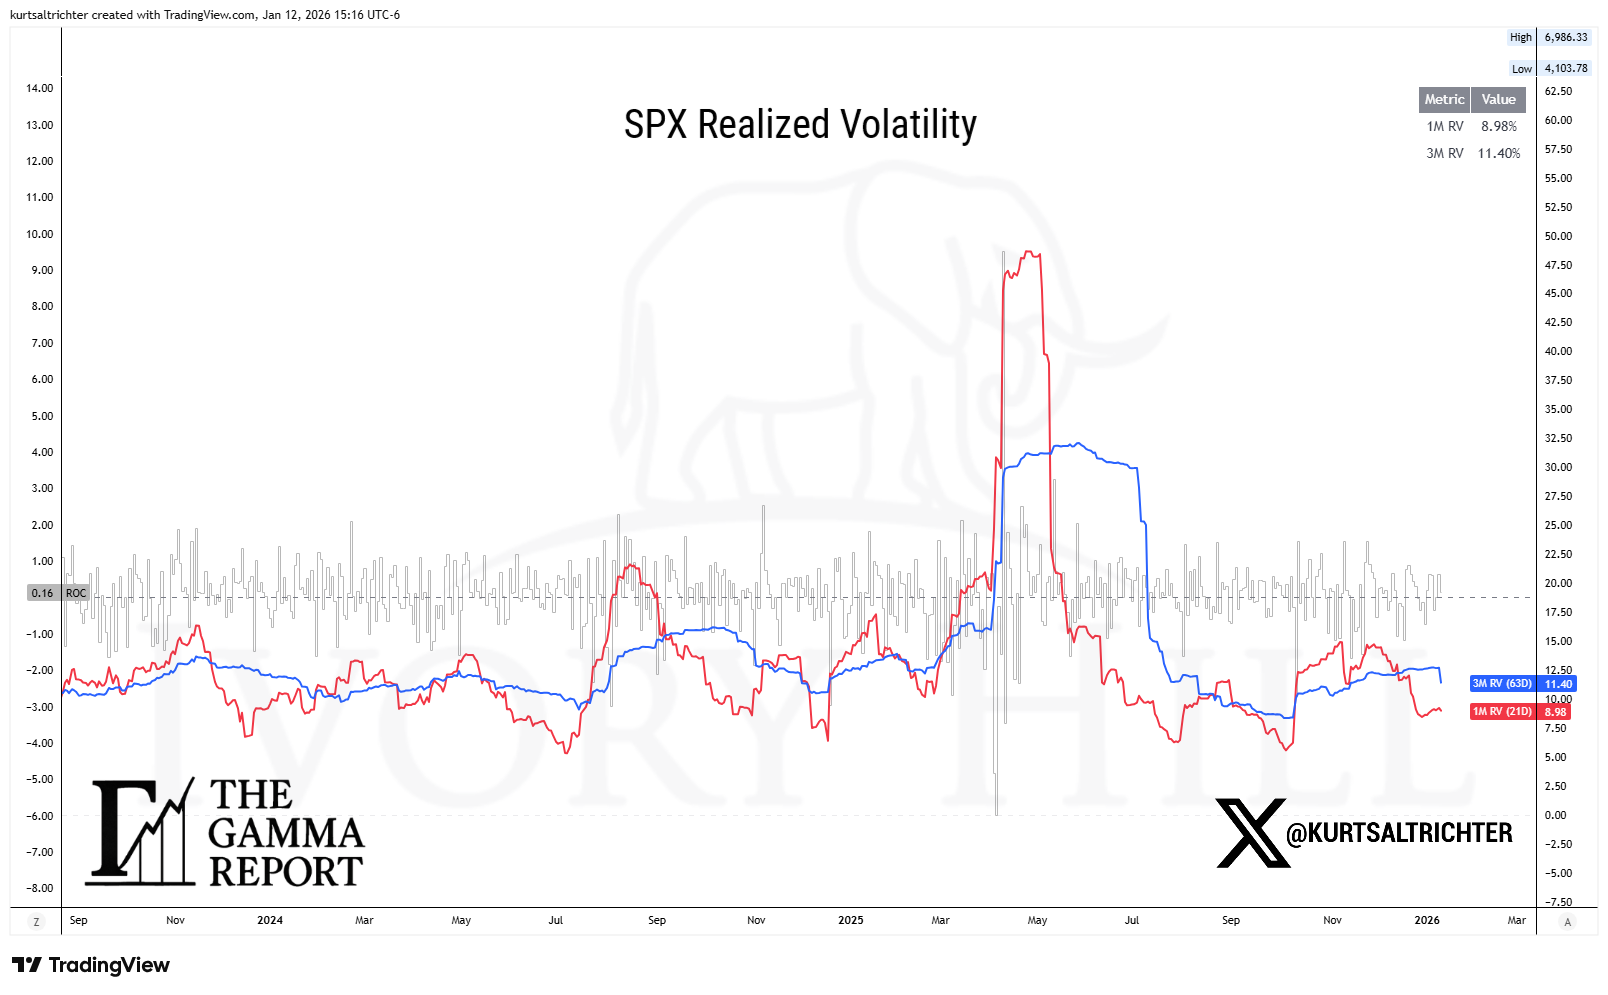
1-month realized volatility finished the week at 9.21, while 3-month realized volatility sits at 12.69. Short-term volatility remaining below longer-term volatility keeps volatility-targeting strategies from cutting exposure and allows them to rebuild incrementally.
There is no signal here of forced selling. Volatility is not pressing the market. This is why downside pressure faded quickly last week.
As long as short-term realized volatility stays contained, the market has room to absorb pullbacks without triggering mechanical deleveraging.
Systematic Flows
Flows remain neutral, but the internal dynamics matter.
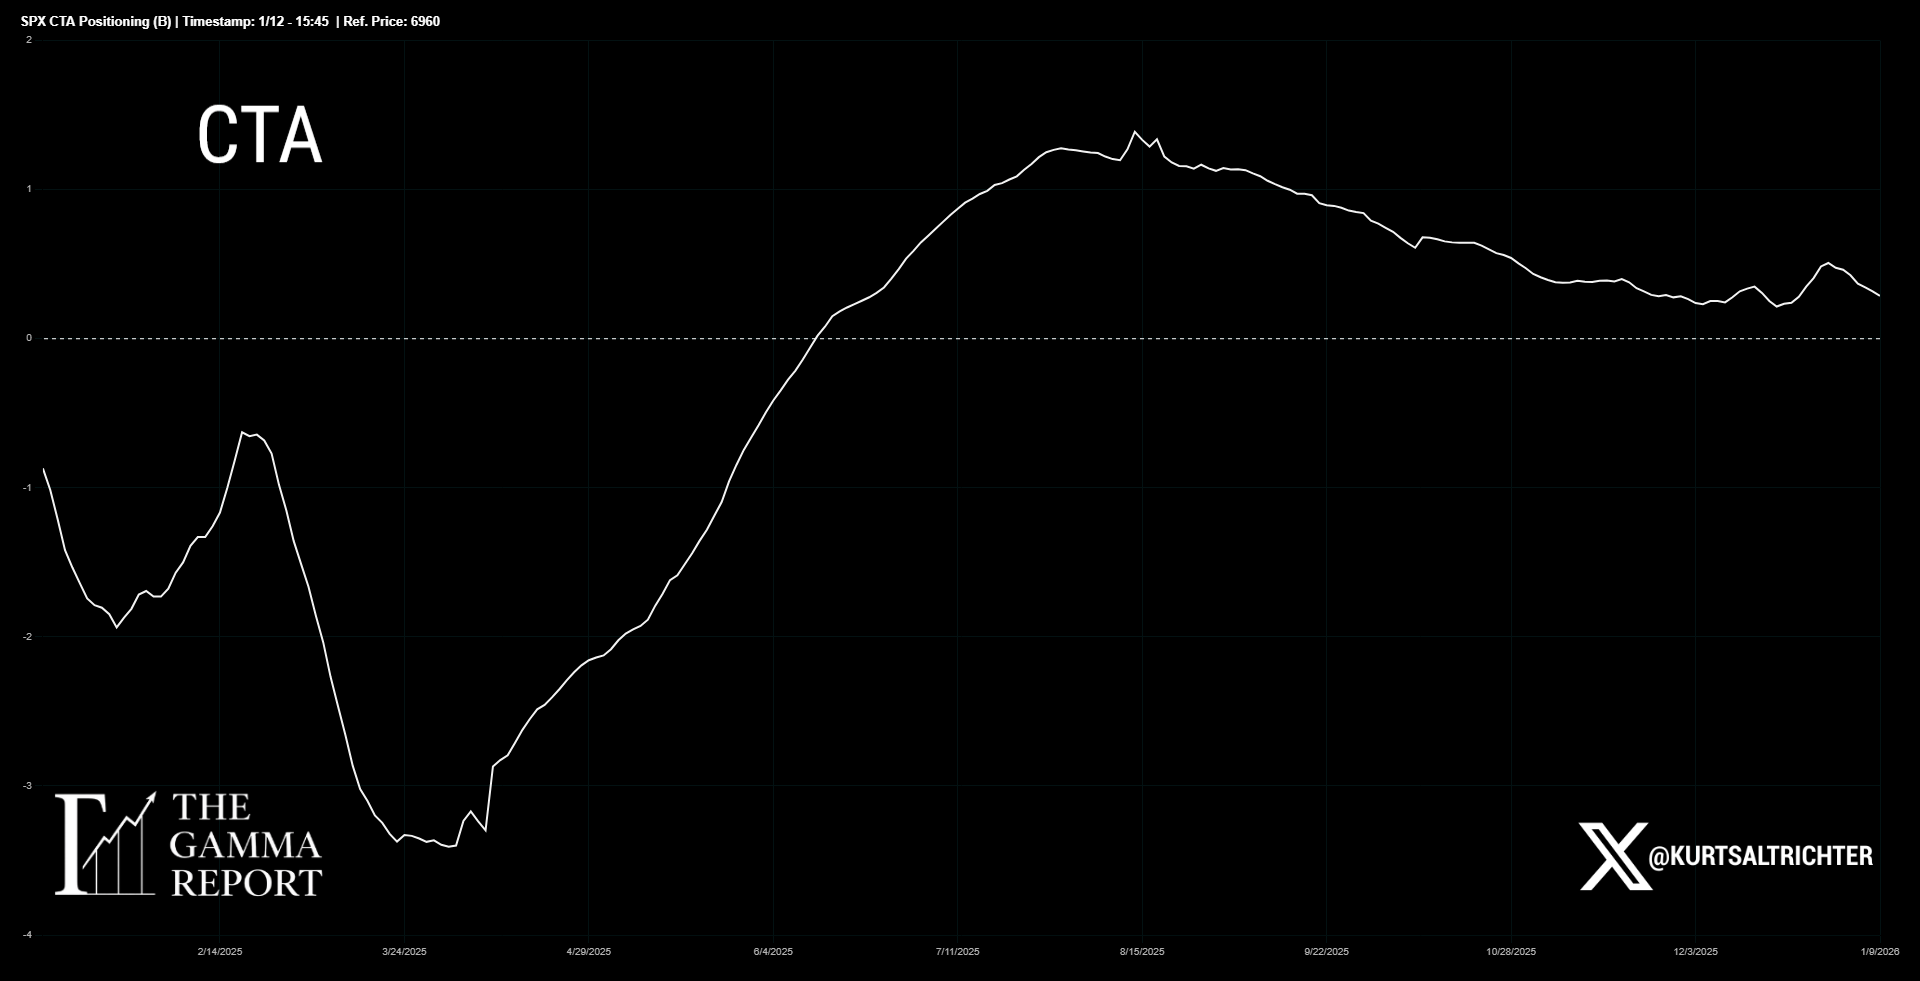
CTA exposure continues to trend lower, with trend strength cooling. Trend followers are still backing away from aggressive positioning. Vol control exposure, however, is rebuilding as realized volatility stays contained.
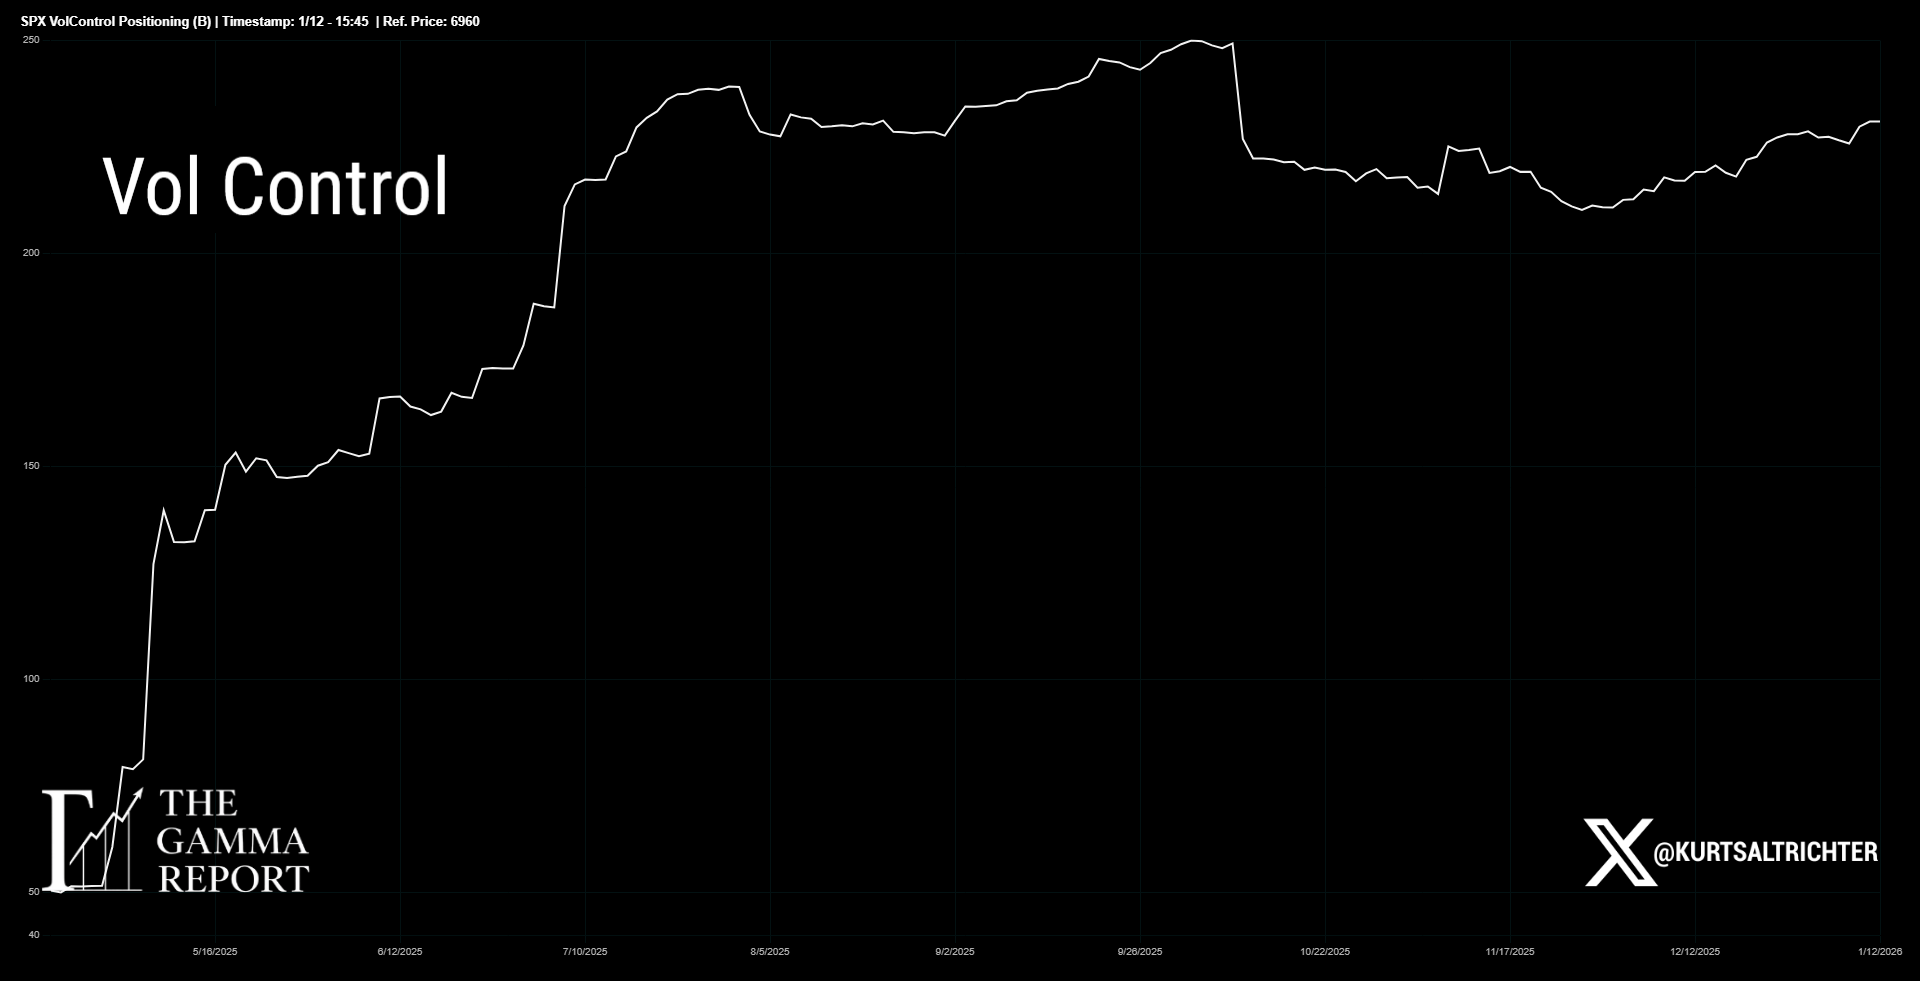
That divergence explains why flows are not providing a strong tailwind, but also why they are not acting as a headwind. There is no wave of forced buying, but there is also no structural pressure pushing the market lower.
Right now, structure is doing the work, not flows.
Breadth
Breadth improved meaningfully last week.
67.6% of S&P 500 stocks are now trading above their 200-day moving average. That is a bullish reading and a key reason the composite signal turned positive.
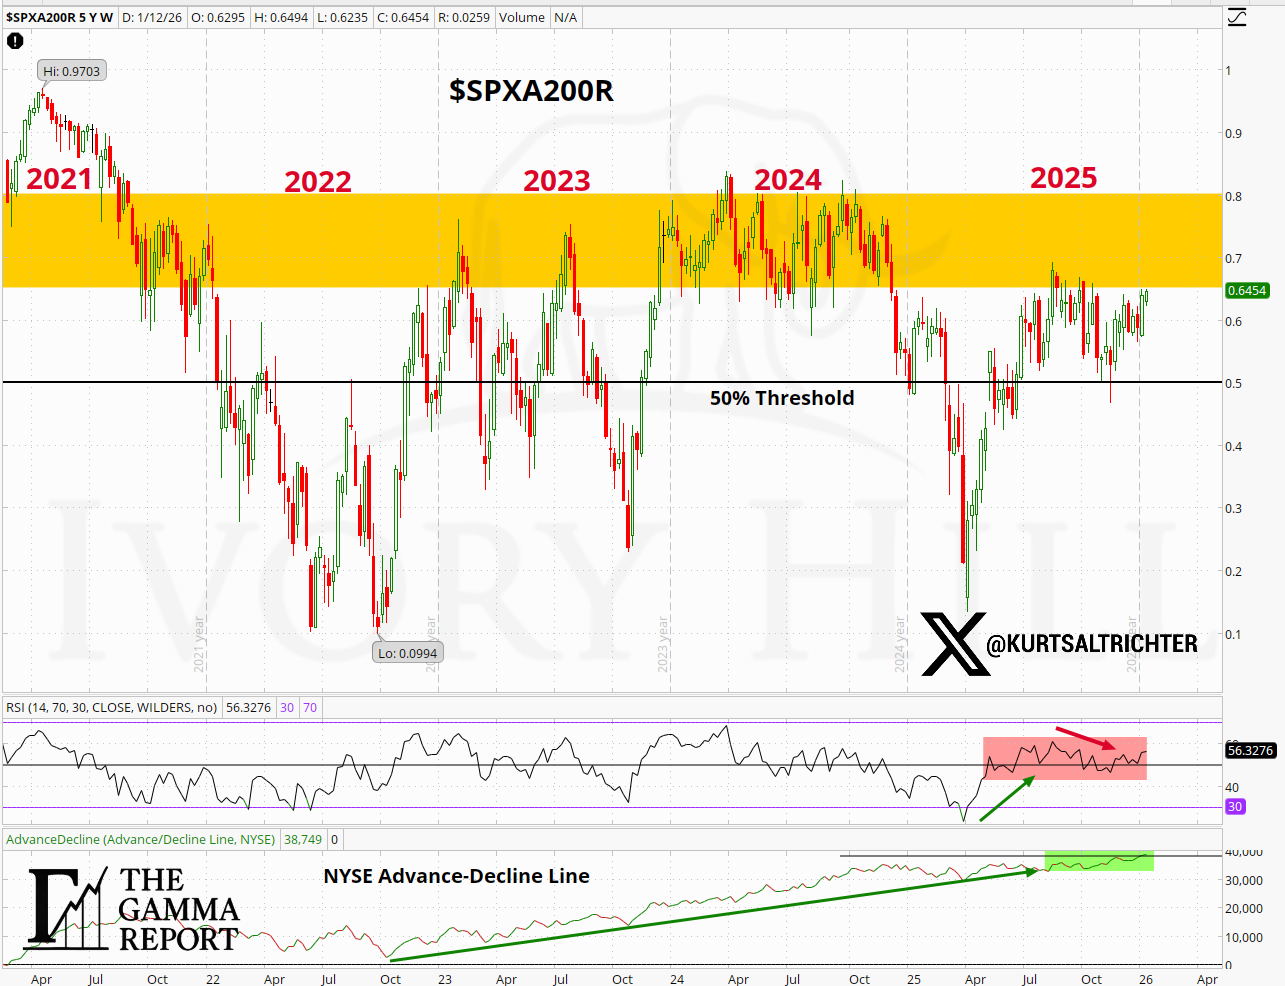
The NYSE advance-decline line continues to trend higher, confirming that participation is improving beneath the surface. This is not just index-level strength.
The caveat remains unchanged. Breadth is still pressing into the same multi-year congestion zone that has capped expansion since 2022. Improvement is real, but confirmation requires follow-through. Until that happens, the market remains supported.
Composite and Regime
The model started the week Risk On, shifted to Neutral mid-week as signals conflicted, then rotated back to Risk On at the Friday close as structure confirmed.
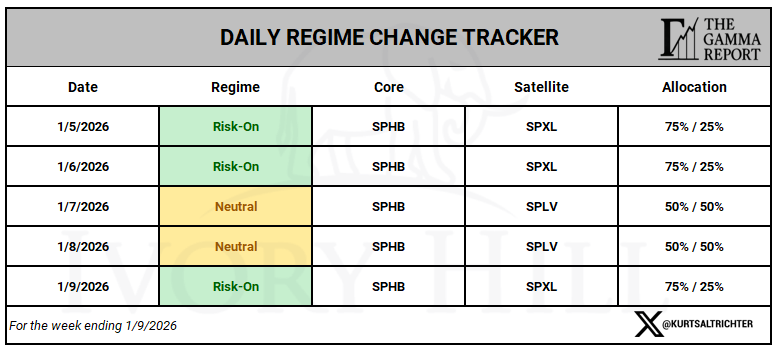
That is exactly how a rules-based process should behave. It steps aside when the data gets mixed and leans back in when the weight of the evidence improves.
Performance
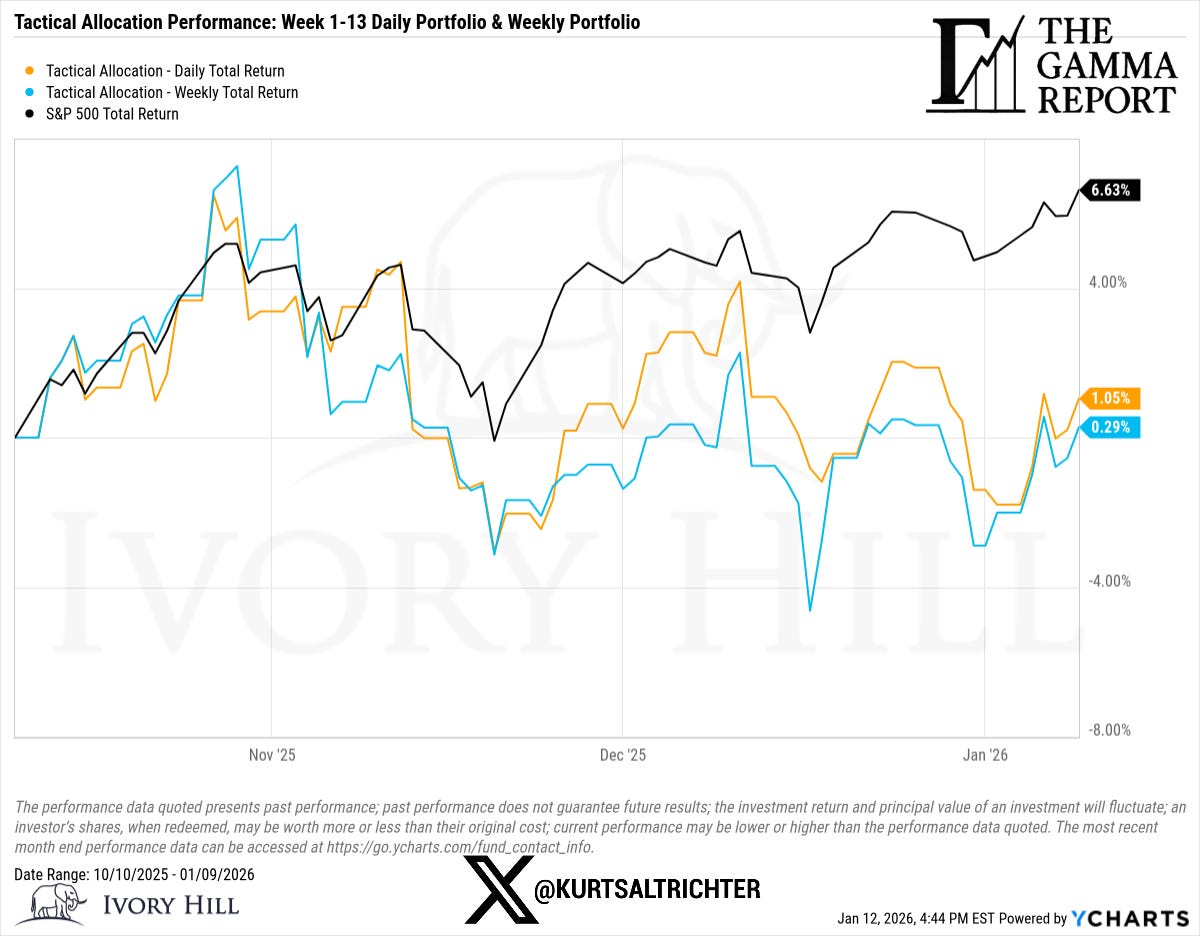
S&P 500 Total Return: +6.63%
Daily Tactical Portfolio: +1.05%
Weekly Tactical Portfolio: +0.29%
The performance gap reflects discipline during a market that repeatedly tests patience. This is the cost of avoiding the structural breaks that cause permanent damage.
The process is not designed to win every week. It is designed to keep exposure aligned when conditions change.
Bottom Line
The market exits the week with a more supportive setup than it entered.
Gamma is constructive.
Volatility is contained.
Breadth improved.
Flows stabilized.
That combination justifies leaning into offense, but not abandoning discipline.
Respect 6,960 and the expected move range. Let the market prove itself before adding risk.
Feel free to use me as a sounding board.
And remember - The one fact pertaining to all conditions is that they will change.
Follow me on X for more updates.
Best regards,
Schedule a call with me by clicking HERE
Kurt S. Altrichter, CRPS®
Fiduciary Advisor | President
Disclosure
The Gamma Report is published by Ivory Hill, LLC. All opinions and views expressed in this report reflect our analysis as of the date of publication and are subject to change without notice. The information contained herein is for informational and educational purposes only and should not be considered specific investment advice or a recommendation to buy or sell any security.
The data, models, and tactical allocations discussed in this report are designed to illustrate market structure and positioning trends and may differ from portfolio decisions made by Ivory Hill, LLC or its affiliates. Investing involves risk, including the possible loss of principal. Past performance is not indicative of future results.
Ivory Hil, LLC, and its members, officers, directors, and employees expressly disclaim any and all liability for actions taken based on the information contained in this report.