

CLIENT ANNOUNCEMENT: I am on maternity leave. I’ll be slow to respond to emails and calls for the next week or so. If something is time-sensitive, please text my cell or leave a voicemail on my office line.
Schedule your Q4 meeting by clicking HERE
Welcome back to the Dealer Gamma Report. This is the fourth weekly issue as I continue to build and refine this model in real time. Every Monday, I break down how gamma volatility flows and breadth shaped the market last week, and translate that into a tactical allocation positioning for the new week.
Dealer Gamma Overview
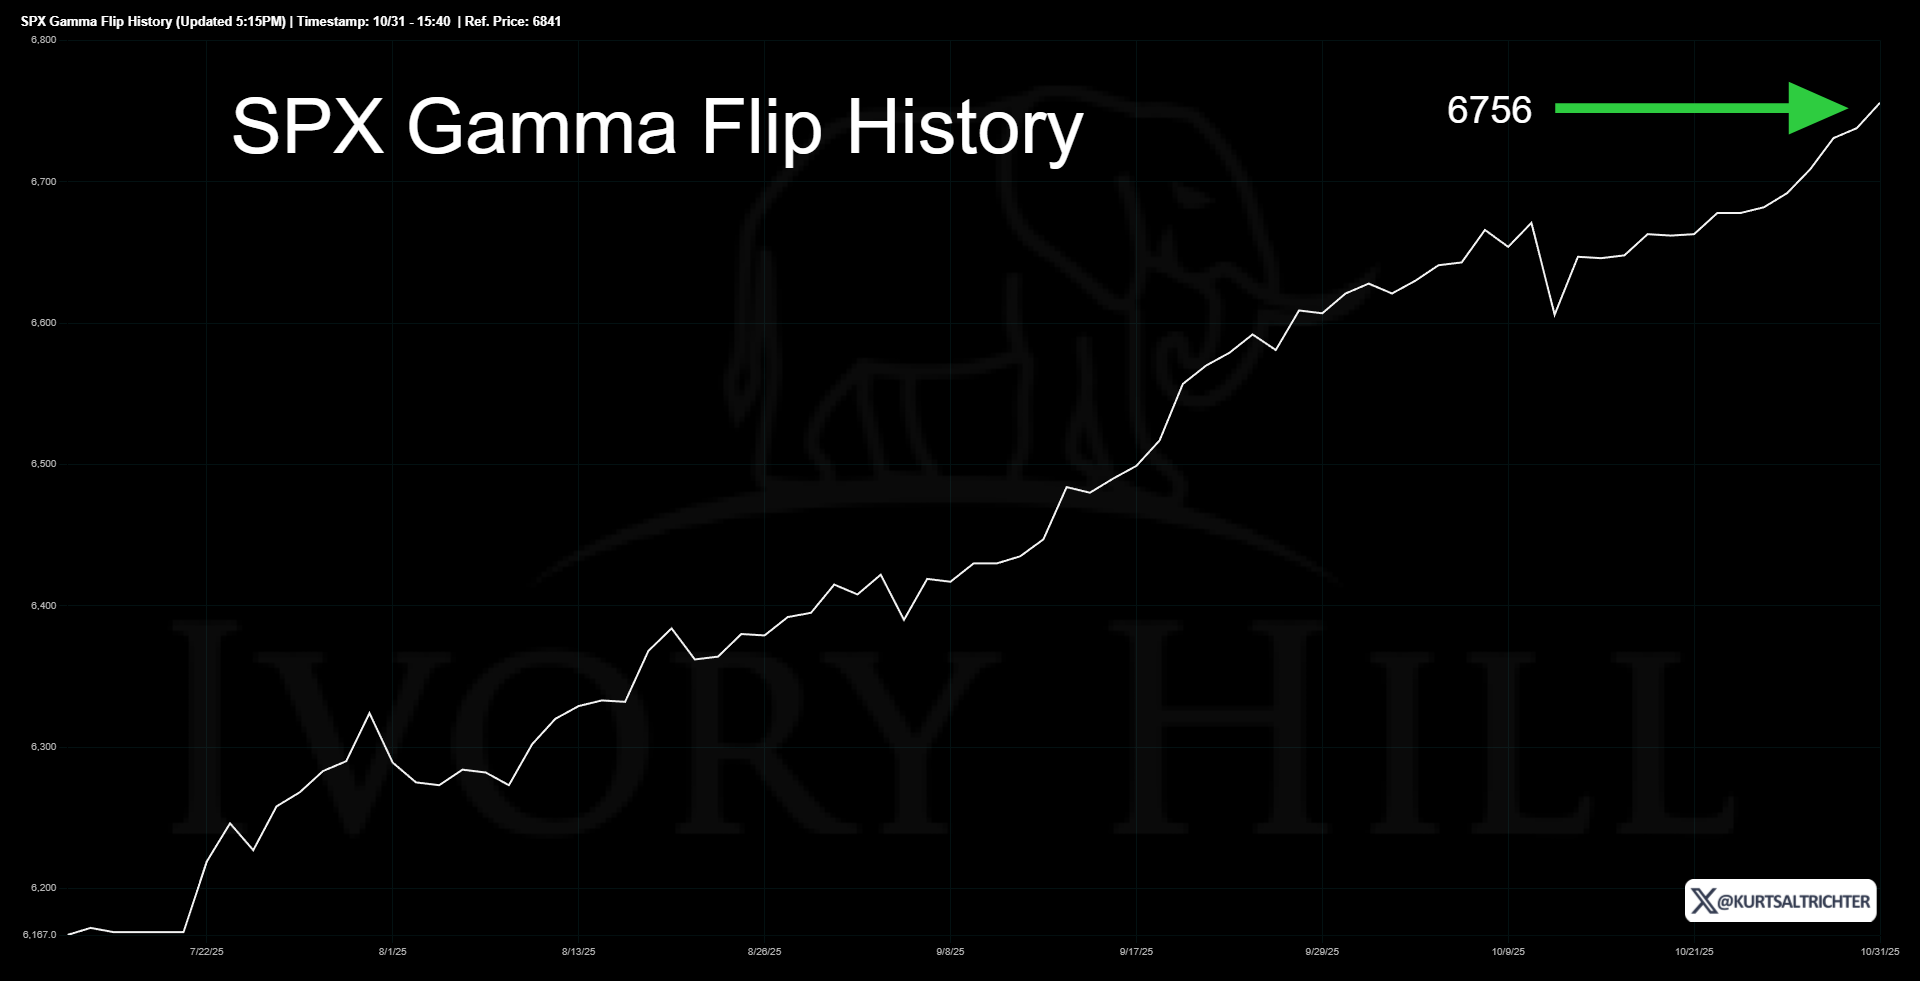
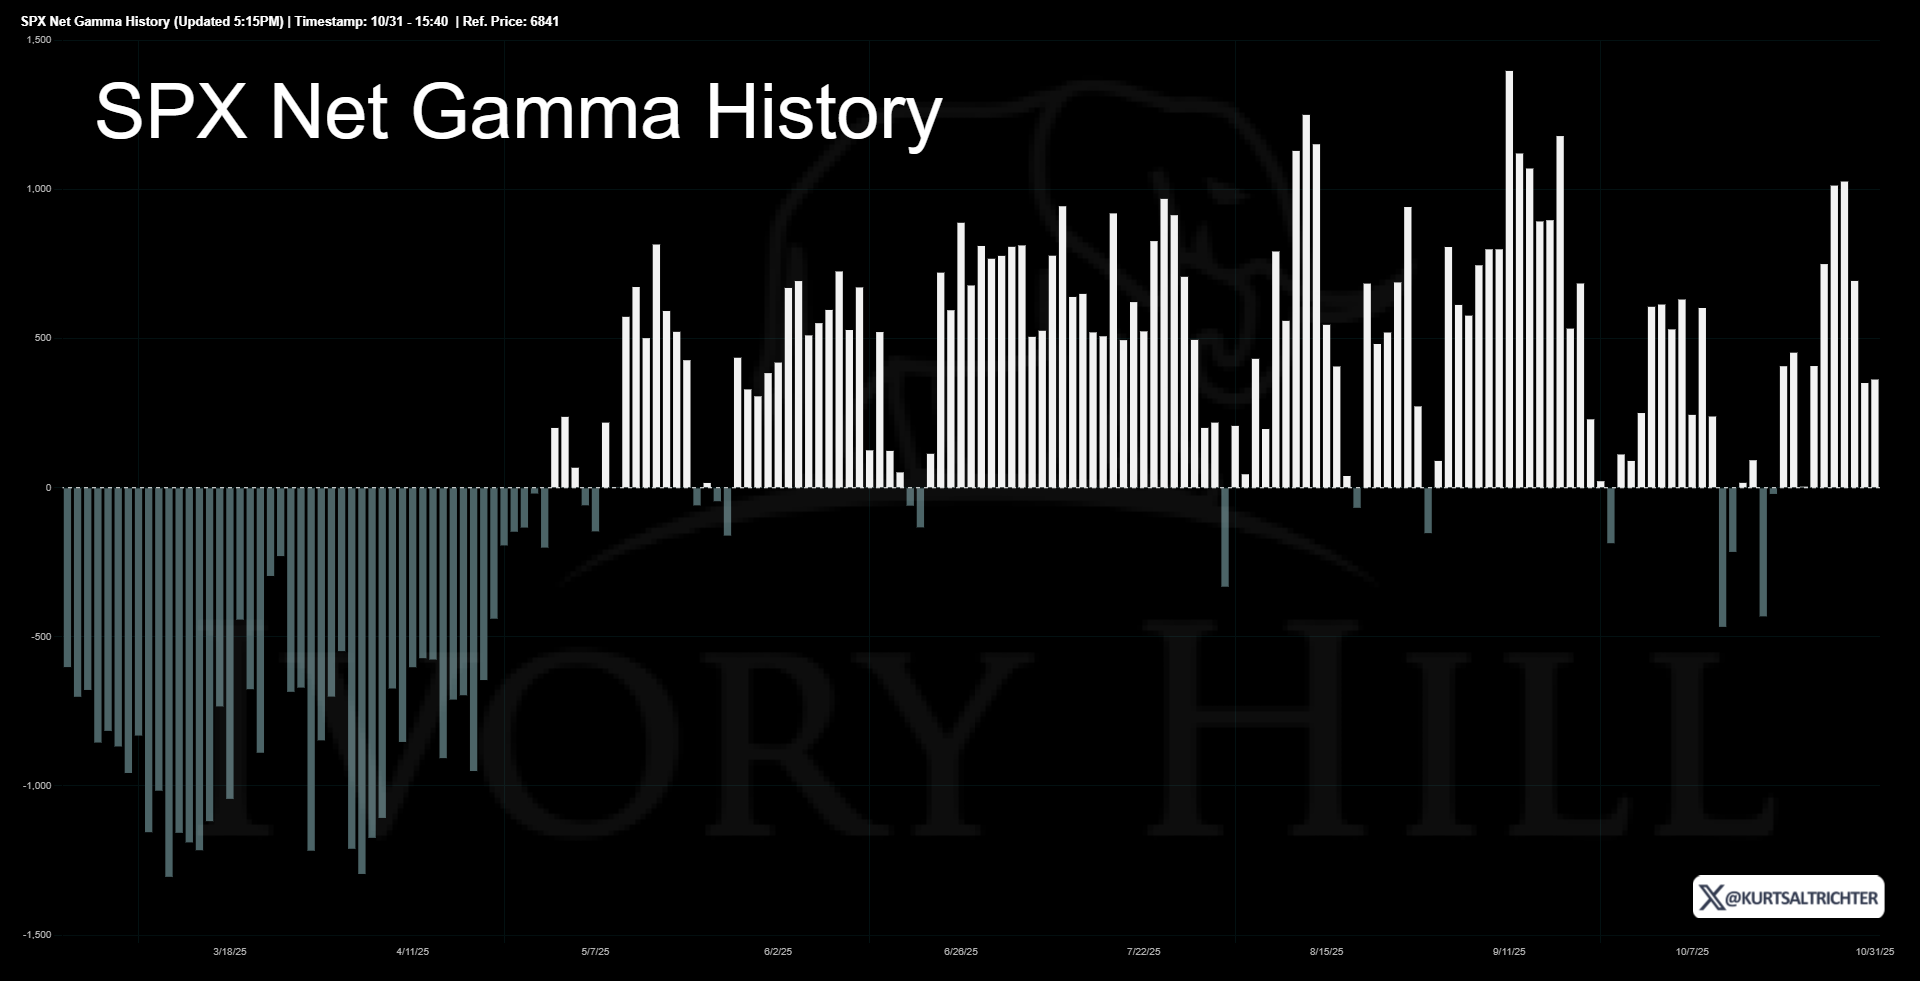
Gamma remains supportive with SPX trading above the gamma flip level at 6682. This suppresses volatility. Long gamma positioning suppresses intraday chop and increases the probability that dip buying gets absorbed rather than accelerating into selling.
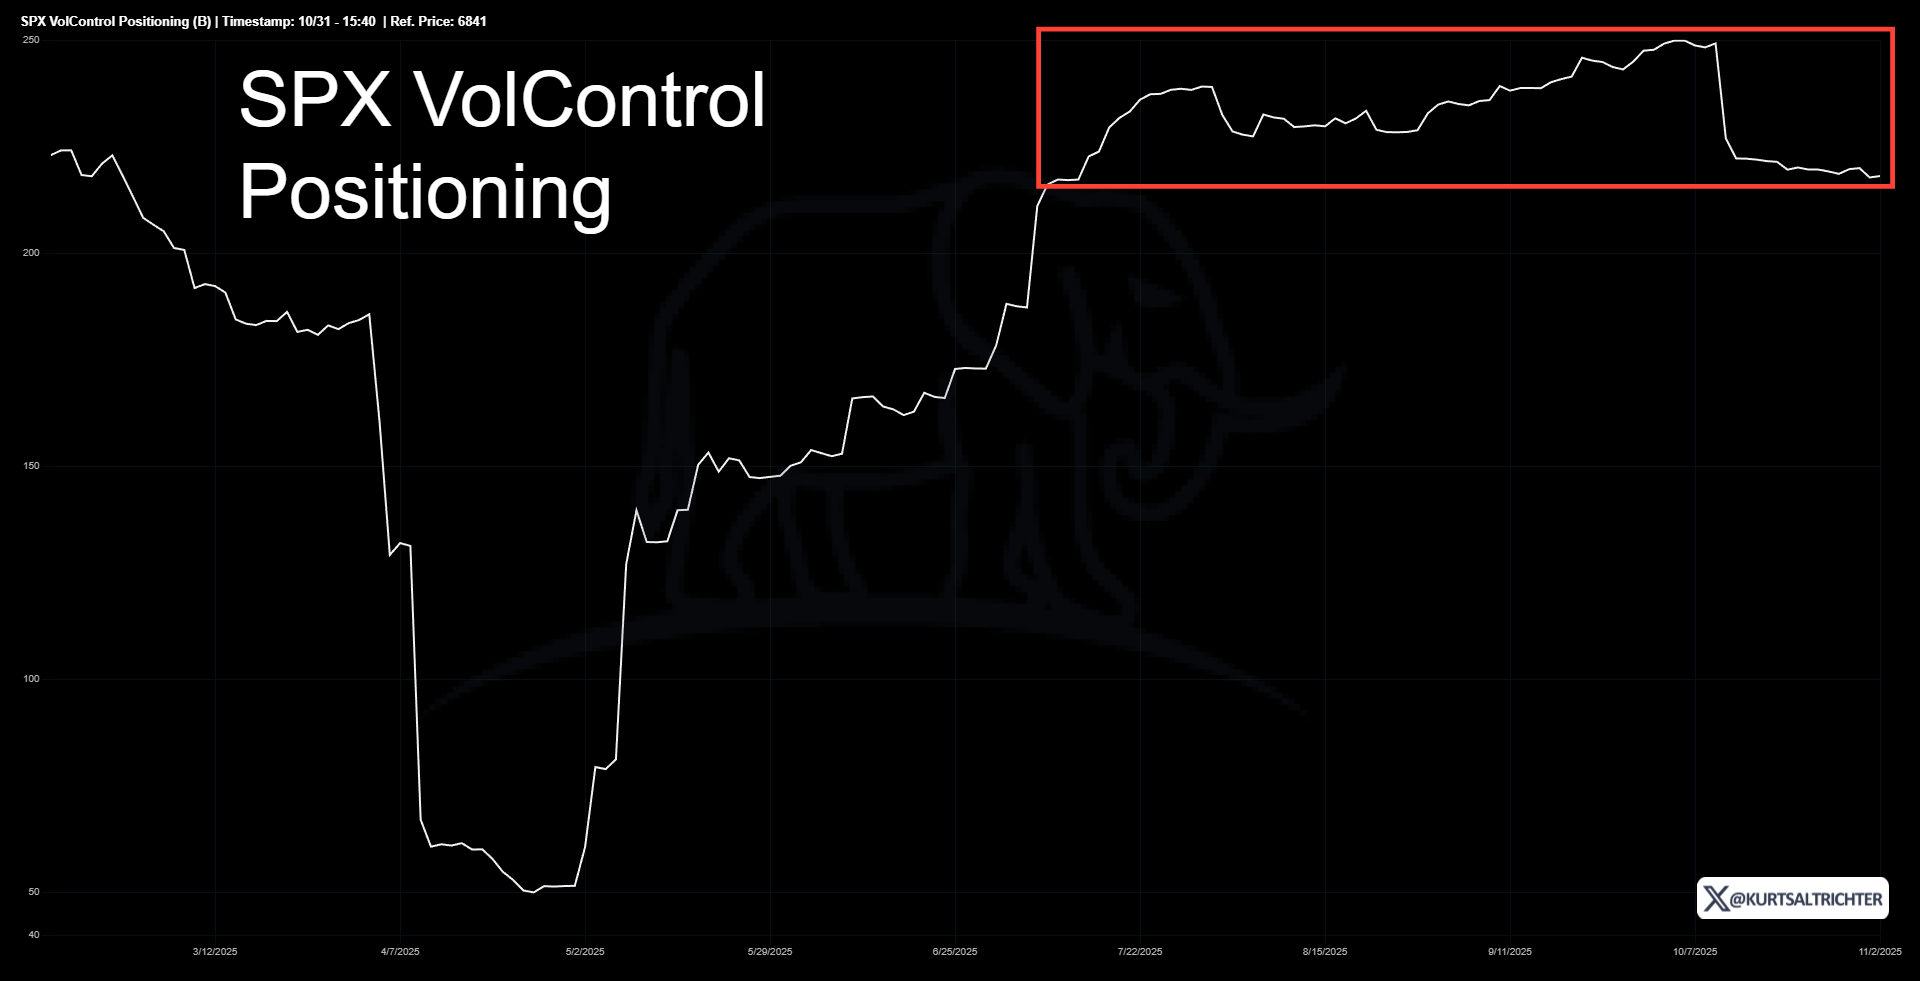
CTA & Systematic Flow Positioning
CTA exposure rolled off peak levels but remains positive. That means systematic trend followers are not leaning short or cutting exposure in size. Vol control exposure has drifted lower because the 30-day realized volatility level is still elevated above ten. This combination keeps systematic flows from amplifying upside momentum but also removes the systematic selling overhang that we saw earlier in October.
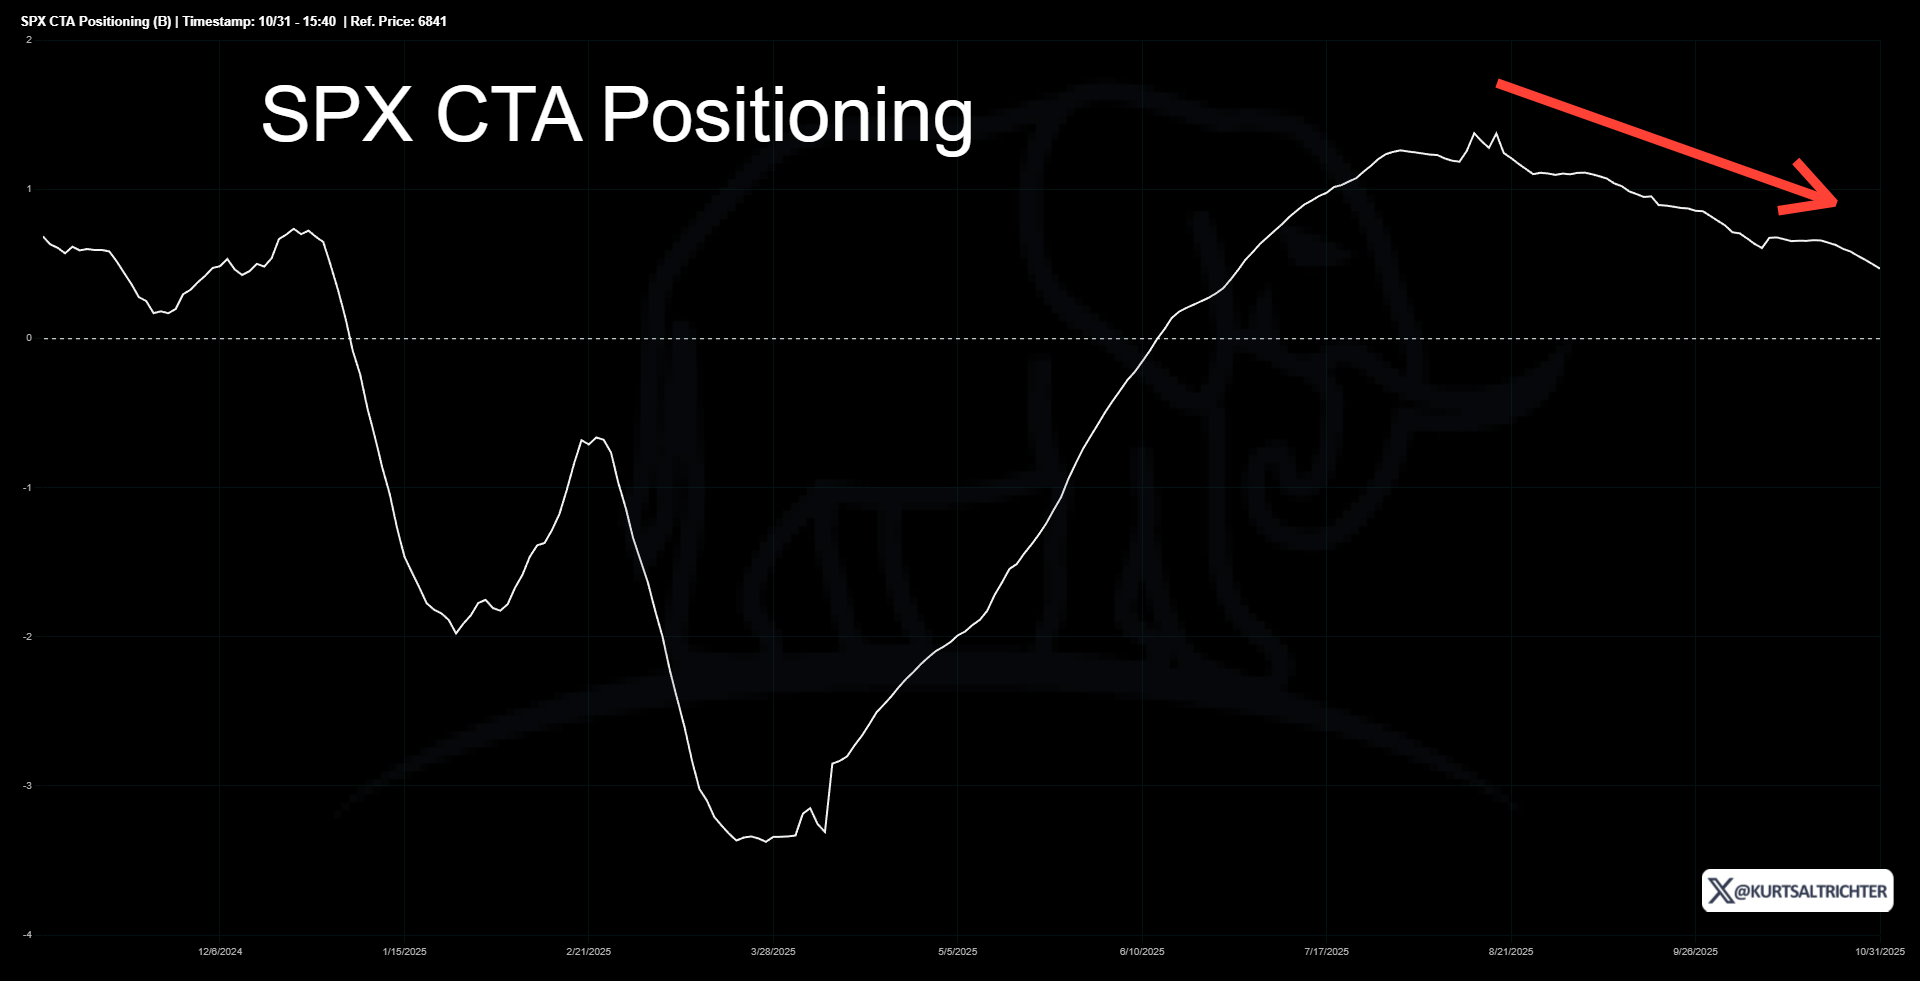
We are not in a pure trend-acceleration environment, but we are not in a forced-selling zone either. This is an important distinction because in negative gamma environments, the systematic flows can overwhelm fundamental buyers. That is not happening right now.
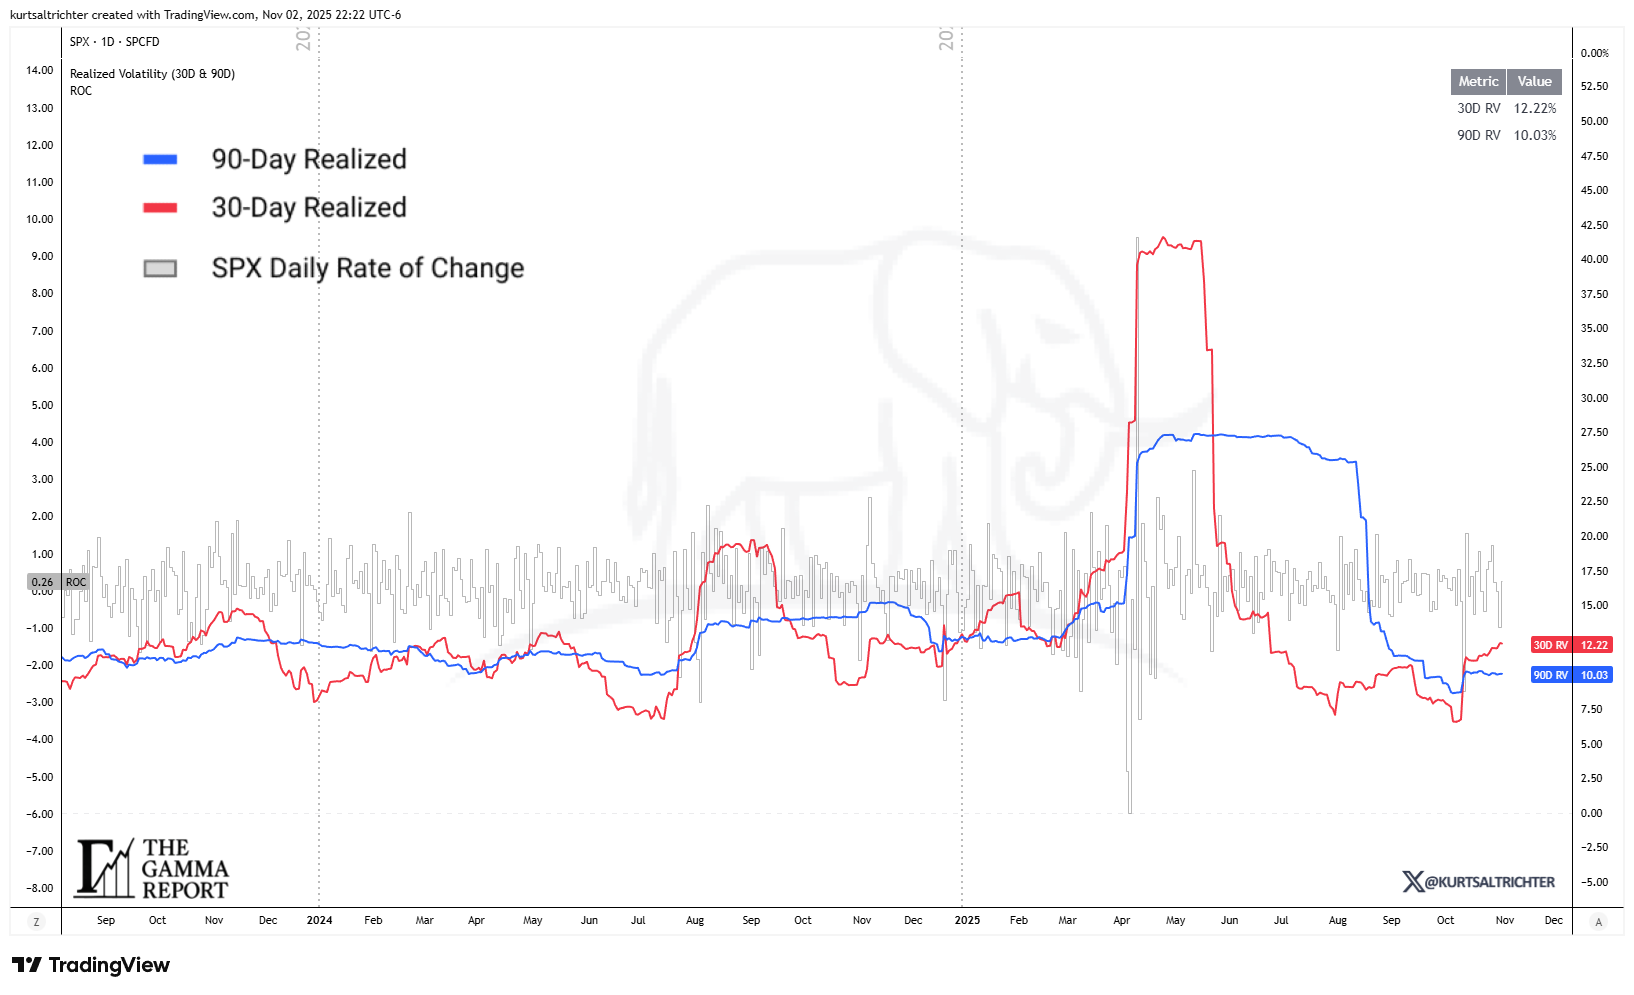
Realized Volatility Signal
30-day realized volatility is 12.22 percent
90-day realized volatility is 10.03 percent
The curve is still elevated but has stopped rising. Vol is not the threat it was two weeks ago. Stabilization is bullish in this context because it means dealers are not being forced to dynamically hedge in the direction of price, which keeps selloffs shallower and less violent.
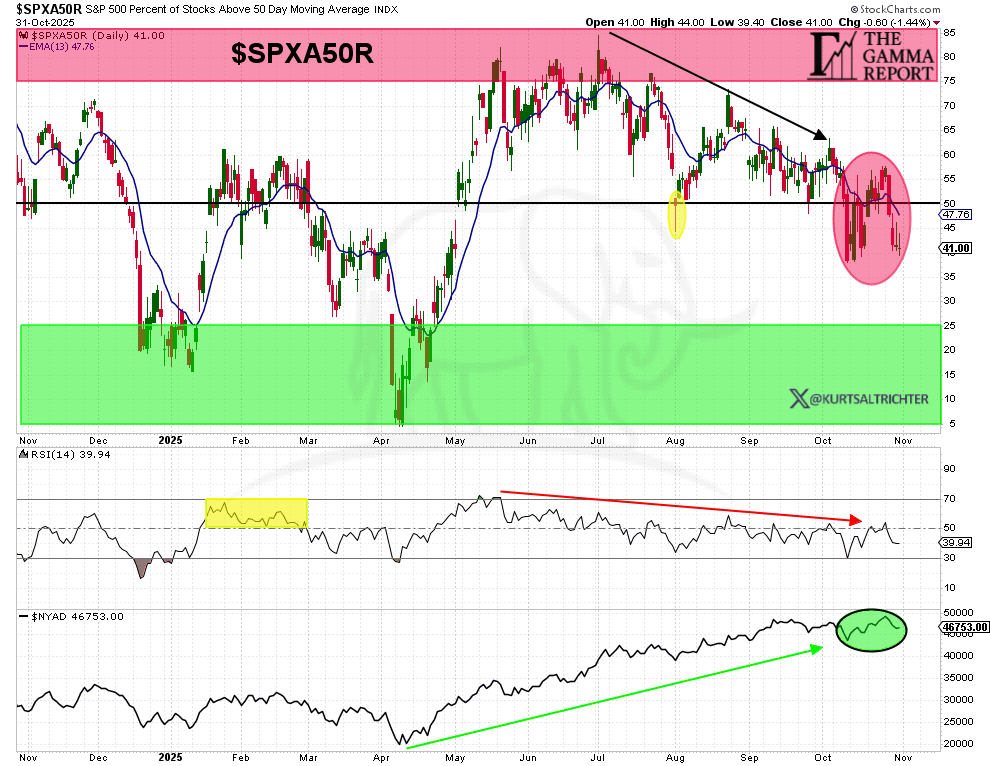
Breadth Signal
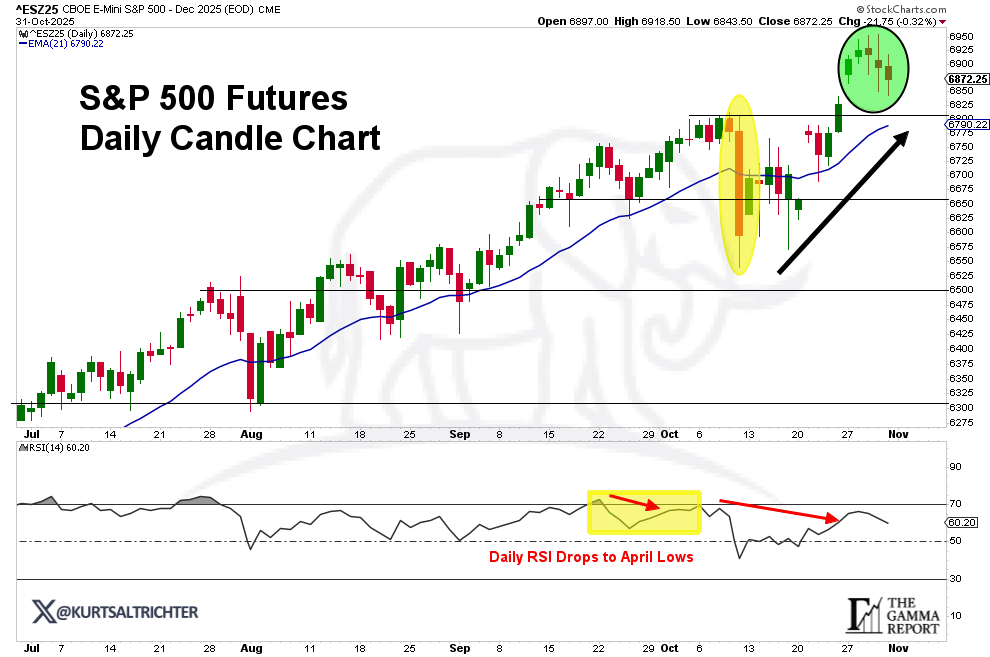
Only 56 percent of S&P 500 stocks are trading above their 200-day moving average. That pegs breadth as bearish. The top end is doing the heavy lifting while the average stock is not trending.
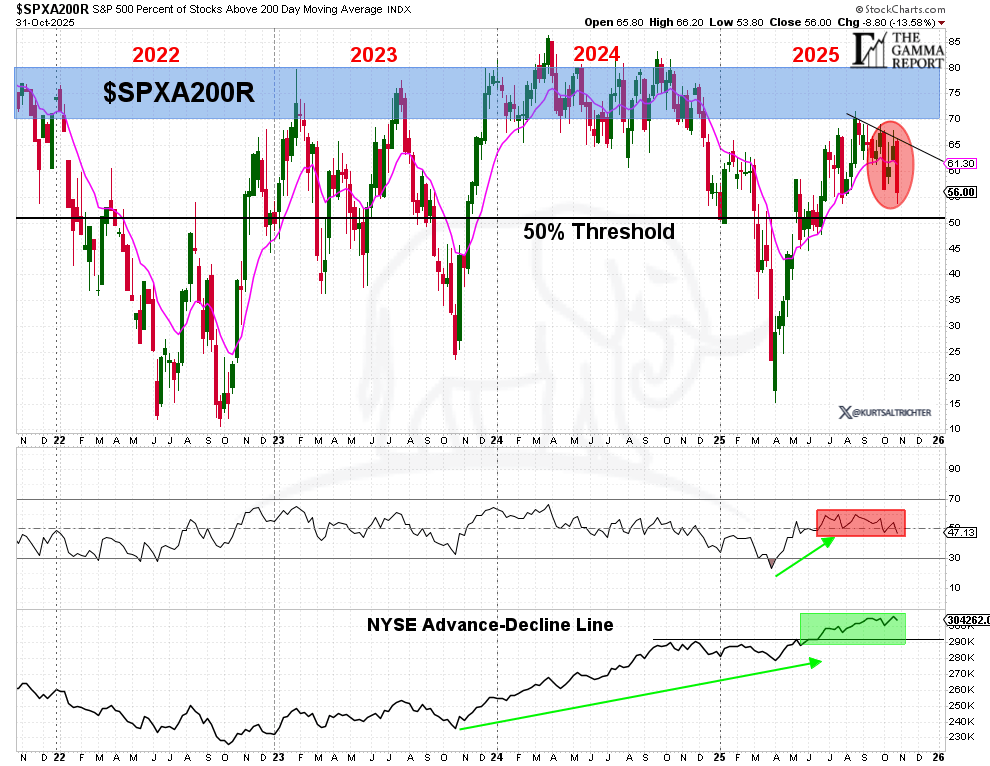
The AD line has not broken down, indicating this is not widespread damage. It is more about concentration than deterioration.
Composite Regime
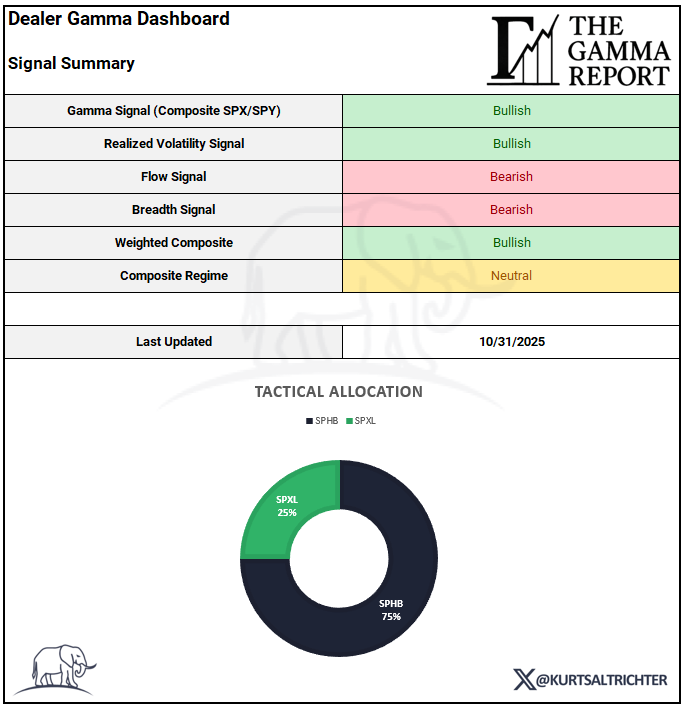
Gamma bullish
RV bullish
Systematic flows bearish
Breadth bearish
The weighted composite finished bullish, but the composite regime score remains neutral because half the stack is still signaling defense. This is not a risk off tape. It is a narrow market with supportive gamma and cooling volatility. That combination supports a positive right-tailed distribution with higher-than-typical air pockets inside the trend.
Tactical Allocation
The daily model finished the week Risk On at 75% SPHB and 25% SPXL.
The weekly model, which only trades on Fridays, also remains Risk On.
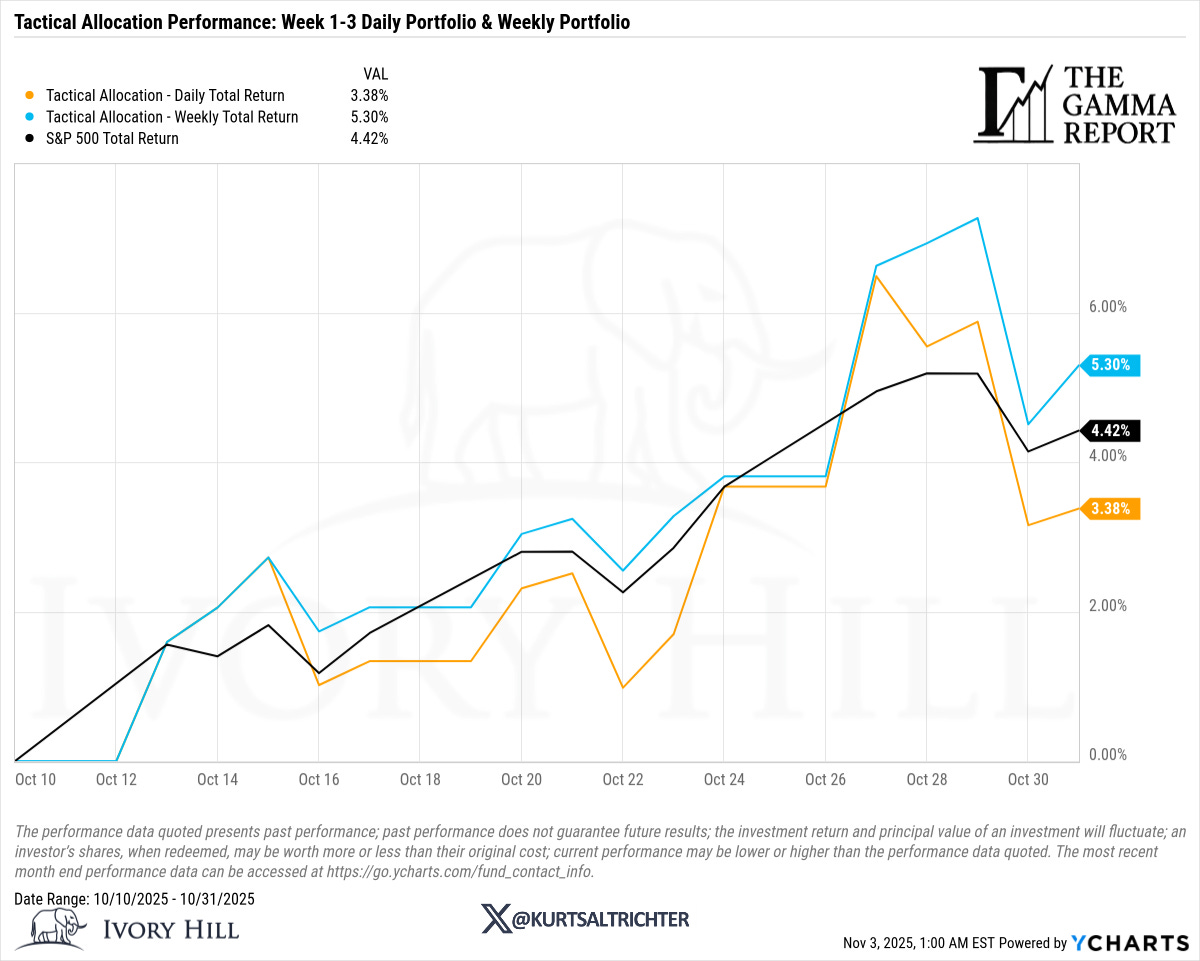
Performance Recap
The weekly model maintained risk on posture, which still had more upside than the daily model.
Key Levels To Watch This Week
SPX gamma flip at 6682
SPY gamma flip at 683
30-day RV watch the 14% threshold
breadth needs to break above 70% to confirm broad participation
Final Thoughts
This is still a buy-the-dips tape, not a sell-strength tape. Gamma is supportive. Vol is not accelerating. Breadth is weakening, but that is concentration, not liquidation.
And remember - The one fact pertaining to all conditions is that they will change.
Follow me on X for more updates.
Best regards,
-Kurt
Schedule a call with me by clicking HERE
Kurt S. Altrichter, CRPS®
Fiduciary Advisor | President
Disclosure
The Gamma Report is published by Ivory Hil, LLC. All opinions and views expressed in this report reflect our analysis as of the date of publication and are subject to change without notice. The information contained herein is for informational and educational purposes only and should not be considered specific investment advice or a recommendation to buy or sell any security.
The data, models, and tactical allocations discussed in this report are designed to illustrate market structure and positioning trends and may differ from portfolio decisions made by Ivory Hill, LLC or its affiliates. Investing involves risk, including the possible loss of principal. Past performance is not indicative of future results.
Ivory Hil, LLC, and its members, officers, directors, and employees expressly disclaim any and all liability for actions taken based on the information contained in this report.