

Last week, the structure finally blinked in a different way. Gamma flipped back to positive, realized volatility kept firming, breadth stayed stuck in the same congestion zone, and systematic support from CTAs and vol control continued to drift lower. The composite regime finished the week Neutral again, but this time with a very different mix underneath.
In other words, the tape is no longer a pure negative gamma minefield, but it is not a healthy, broad-based risk to the environment either. It is a market that wants to trend higher as long as liquidity behaves, yet still punishes anyone who confuses a structural tailwind with a free ride.
The job stays the same. Measure the regime, size risk to the structure, and let the model do the heavy lifting.
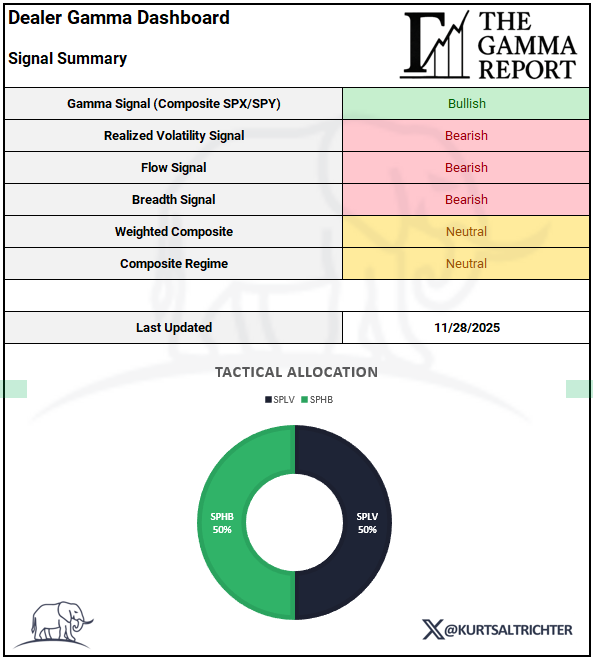
Signal Summary
As of the close on 11/28/2025, the composite signals read:
Gamma Signal (Composite SPX/SPY): Bullish
SPX closed at 6,845 with the SPX flip line near 6,729, and the composite gamma score moved to +1 for the first time since early November.Realized Volatility Signal: Bearish
30-day realized volatility sits at 14.71, up from 13.89 the prior week.
90-day realized volatility is 12.24, up from 11.78.
The direction of travel is still higher.Flow Signal: Bearish
Both CTA positioning and vol control exposure are rolling over from high levels and continue to trend lower.Breadth Signal: Bearish
Roughly 60% of S&P 500 names are above their 200-day moving average, up from the low 50s a couple of weeks ago, but the breadth gauges remain below the zone that historically supports durable bull legs.Weighted Composite: Neutral (score ~0.20)
Positive gamma offsets the combination of rising realized vol, softer systematic flows, and tired breadth.Composite Regime: Neutral
The model keeps us out of both full offense and full defense.Tactical Allocation for the week ending 11/28
Core: SPLV 50%
Satellite: SPHB 50%
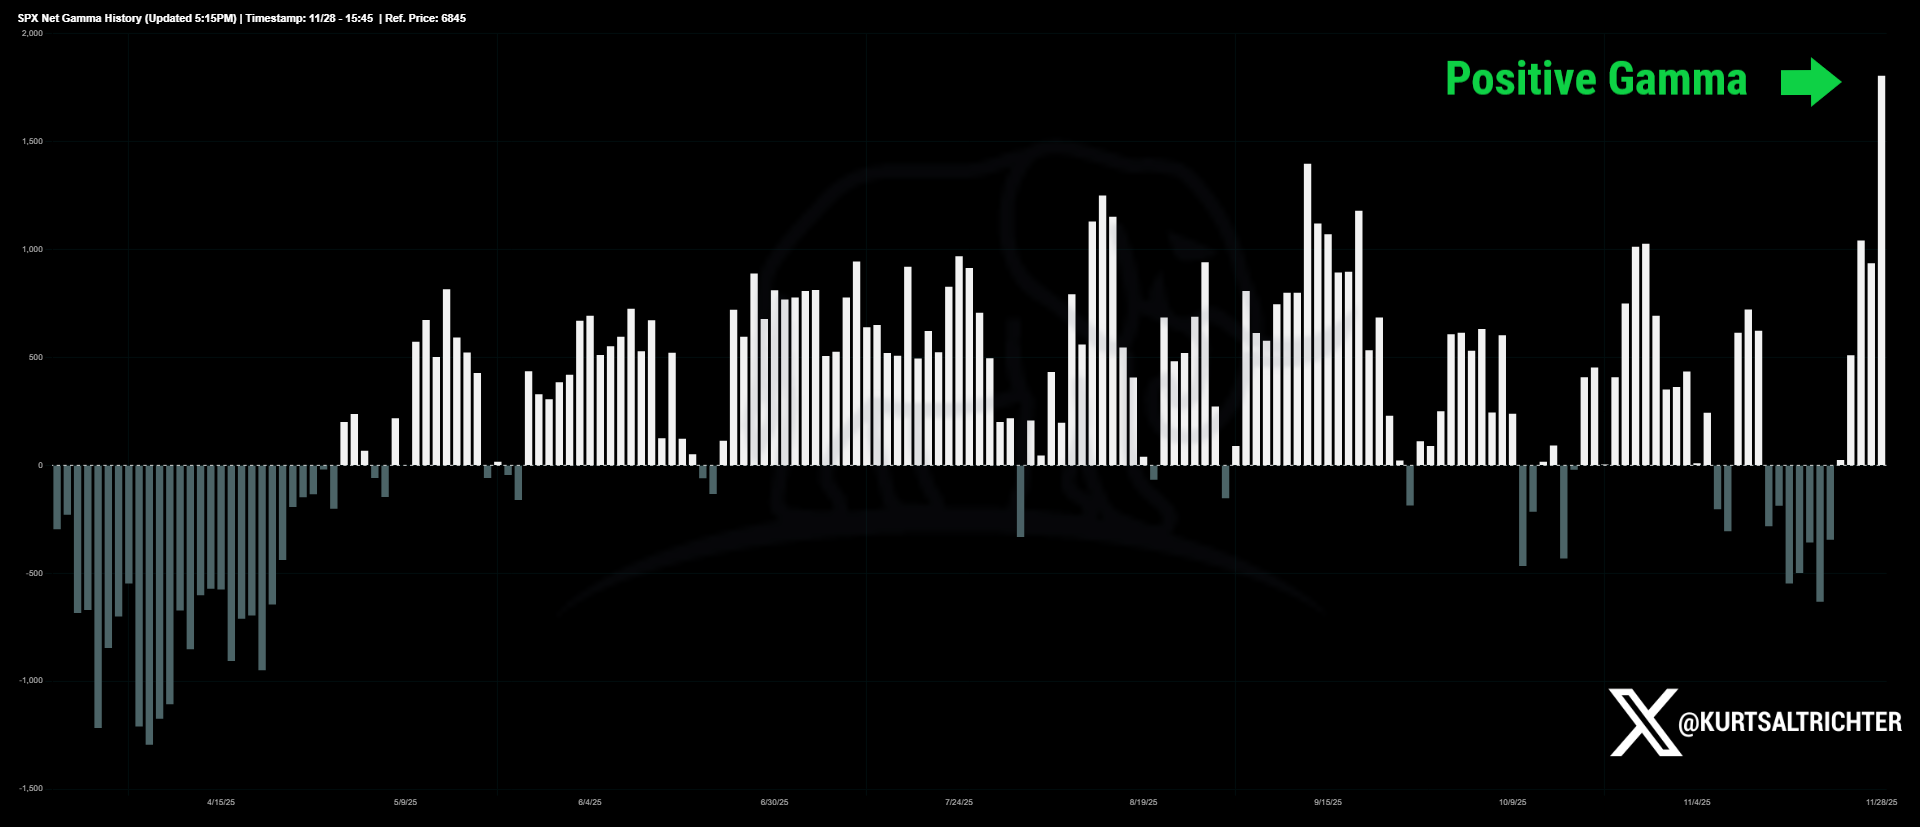
Gamma Signal
The most important structural change last week came from dealer positioning.
SPX spent the previous few weeks trapped under the gamma flip line, which kept dealers short gamma, making the tape fragile. Now the index has pushed back above the flip level and stayed there. Net SPX/SPY gamma is firmly in positive territory, and the composite gamma regime score sits at +1.
In positive gamma, dealers hedge against moves instead of with them. When the market dips, they are forced to buy. When it grinds higher, they sell into strength and bleed off upside volatility. That hedging pattern tends to compress intraday swings and make it harder to sustain shock moves.
The gamma history this quarter tells the story. We went from deeply negative readings in October to a shallow negative pocket into mid-November, and finally to a sharp ramp into positive territory by the end of last week. The structure shifted from amplifying every wiggle to leaning against moves.
That does not guarantee a straight line higher. It does mean that downside now has to fight through dealers who are more likely to buy weakness than chase it.
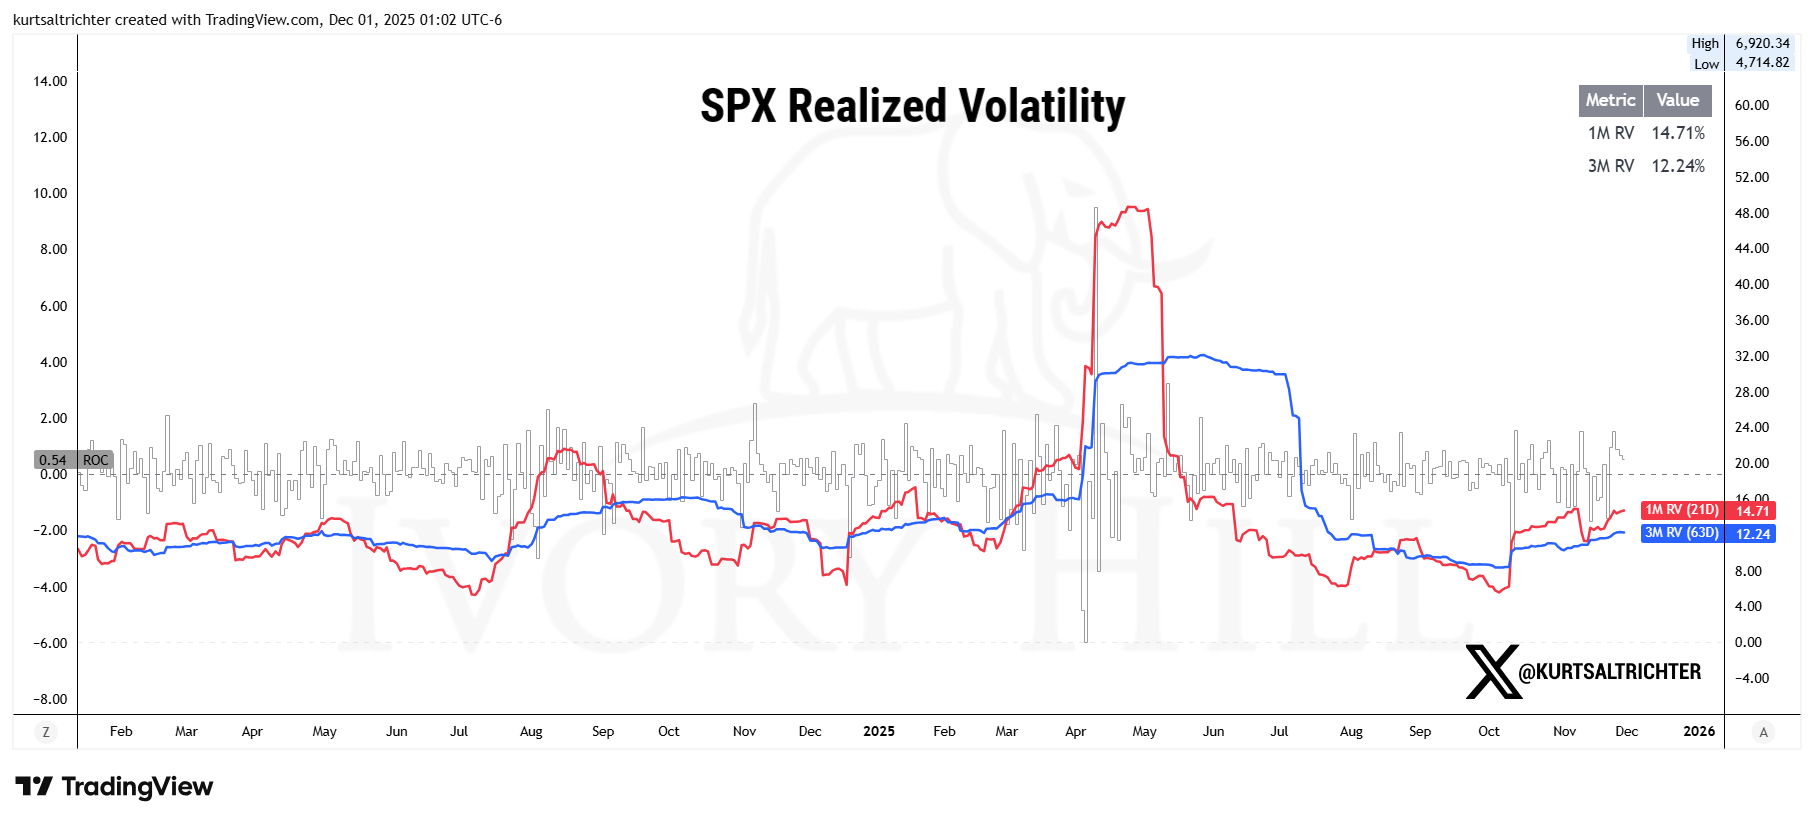
Realized Volatility Signal
Realized volatility kept grinding higher.
30-day realized volatility: 14.71, up from 13.89
90-day realized volatility: 12.24, up from 11.78
Both are still in the low teens, which is hardly panic territory, but the model cares about the change more than the absolute level. Markets price risk on the rate of change. Rising realized vol means the tape is actually moving more from day to day, not just threatening to.
Short-term realized vol is comfortably above the longer lookback window. That is what you tend to see when pullbacks and rallies both stretch more than they did a month ago. It is enough to keep the realized vol signal Bearish, which explains why vol control has stopped adding exposure and has started slowly walking it back.
At this stage, the message is simple. Vol is firm, not explosive. The environment rewards respecting risk, not betting on a volatility crash.
Flow Signal
Systematic flows weakened again.
CTAs are still net long, but the exposure line has been drifting lower from its summer highs. That steady bleed pulls them closer to the middle of the historical range. When the trend is this mature, CTAs are no longer the incremental buyers they were when the move began.
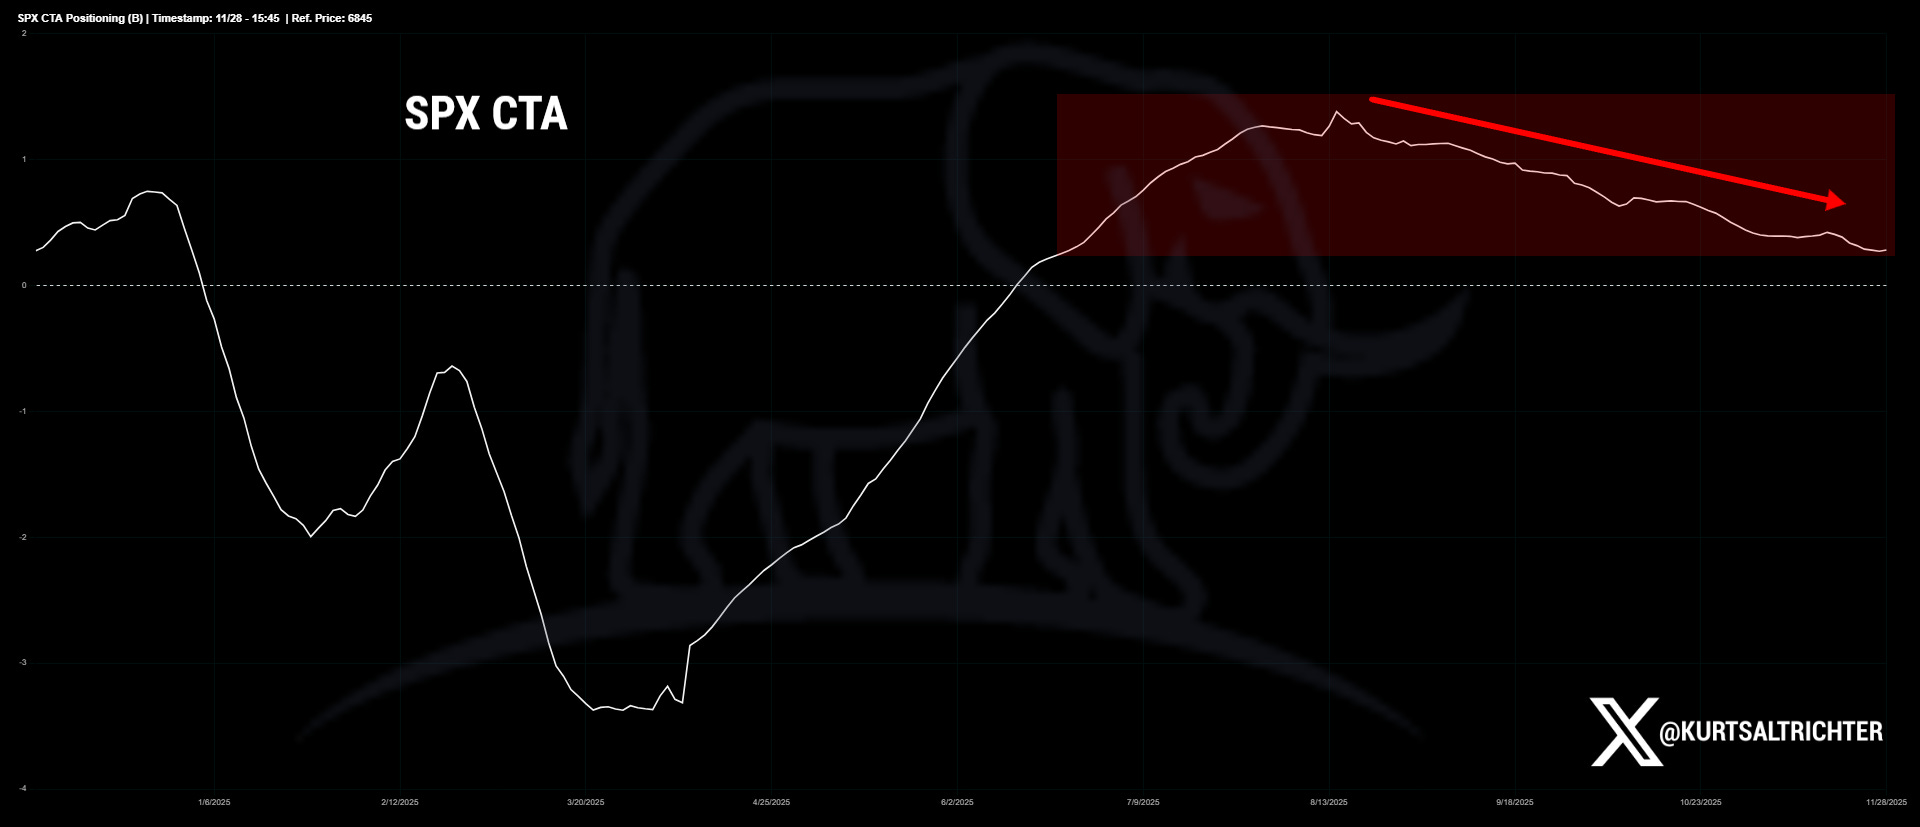
Vol control exposure followed a similar arc. After ramping aggressively as realized vol collapsed earlier in the year, the notional line flattened out, peaked, and has now started to roll over. The red-shaded zone on the chart highlights the slow, steady reduction from the highs. These are not forced liquidations; they are the mechanical trimming that happens when realized vol drifts higher and the models move back toward their target band.
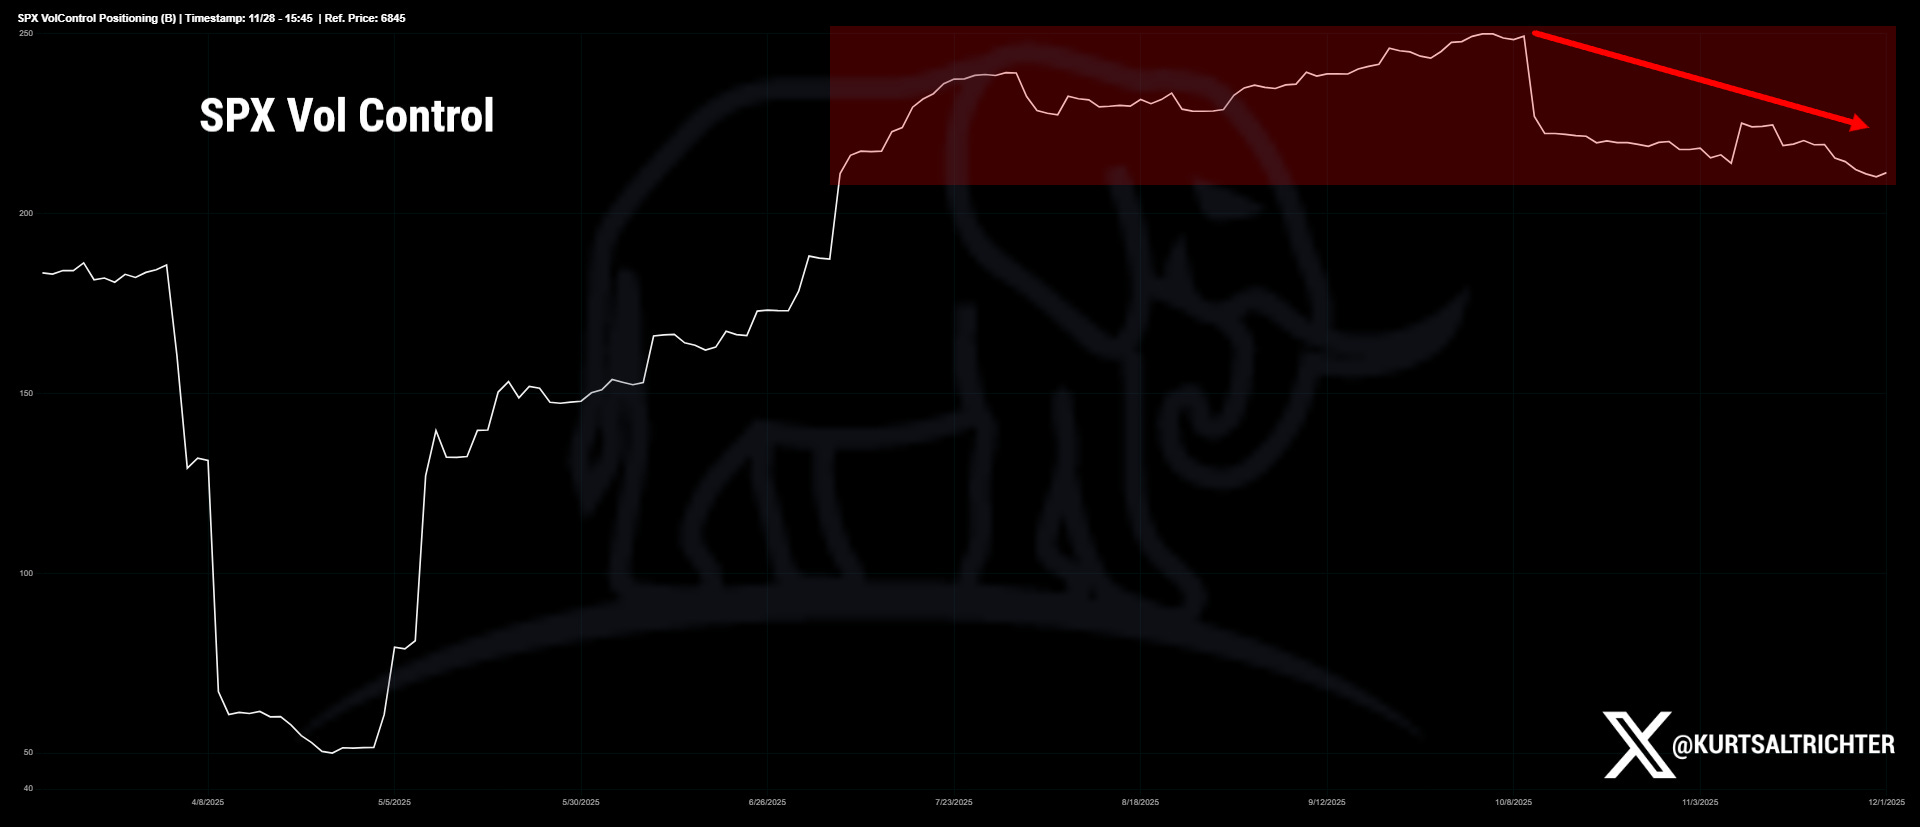
Put those together, and you get a Bearish flow signal. The systematic buyer base that helped push the index to new highs is stepping back. They are not dumping; they are just buying less on the margin. When that happens while dealers are in positive gamma, you tend to get less explosive downside yet more two-sided swings that frustrate both chasers and shorts.
Breadth Signal
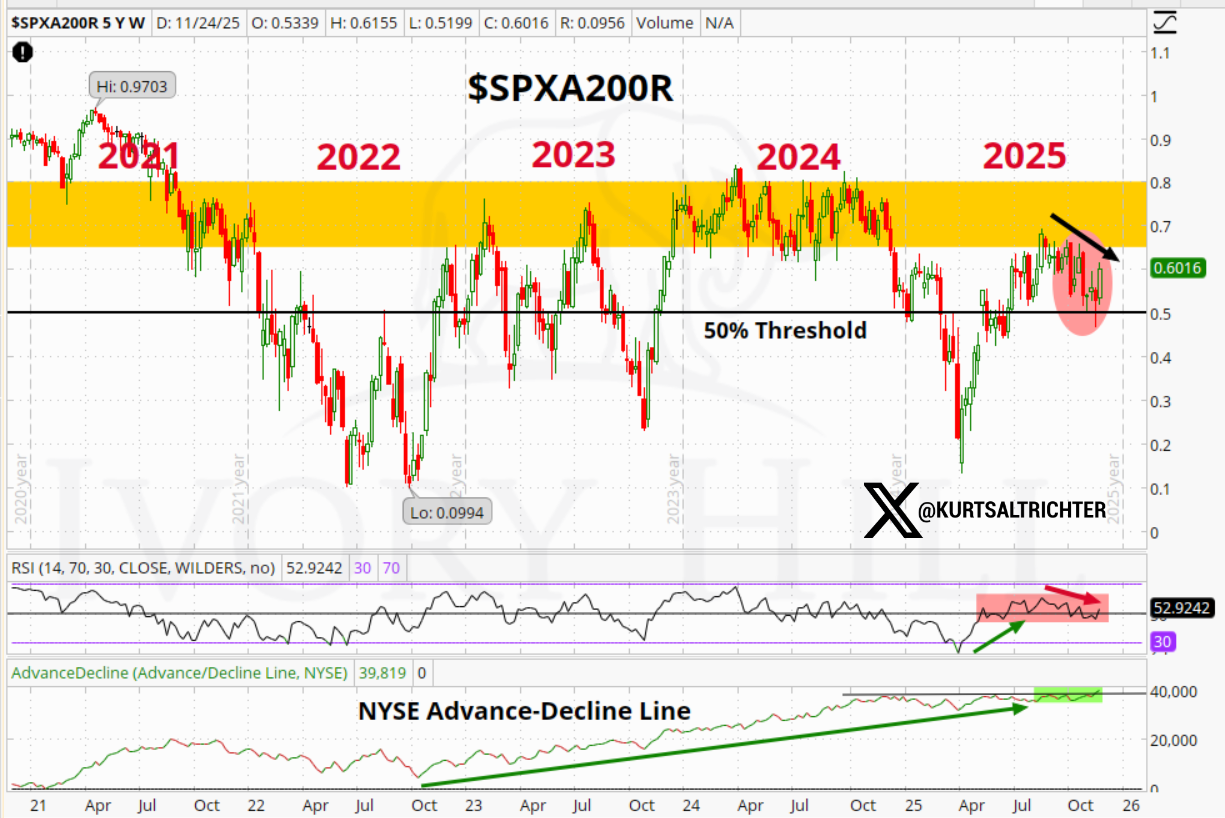
Breadth improved a bit on the surface, but it still looks tired.
Roughly 60% of S&P 500 names now trade above their 200-day moving average, up from a trough near 52% earlier in the month. That sounds constructive, but the SPXA200R gauge is still pinned in the same congestion band that capped advances in 2022, 2023, and 2024. Every attempt to break higher has stalled in that yellow zone.
The breadth RSI has rolled over from overbought and sits in a mid-range chop. The NYSE advance-decline line has flattened after a strong run from the October lows. Price sits near the top of the range while participation cools. That is what a top-heavy market looks like.
Until breadth can punch clearly through this congestion band and hold it, the model keeps the breadth signal Bearish. The tape can still rise, but with fewer shoulders carrying the load.
Weighted Composite and Regime
When you blend all four components, you get a Weighted Composite score around 0.20, which lands in the Neutral bucket.
Gamma: Bullish
Realized Vol: Bearish
Flow: Bearish
Breadth: Bearish
Last week, the weighted composite was negative, and the model sat in a full Risk Off posture, with SPLV and BTAL doing the heavy lifting. The swing back to Neutral did not come from healthier breadth or stronger flows; it came almost entirely from the shift in dealer gamma.
So the regime label is the same as some earlier neutral weeks, but the reason is very different. In October, Neutral meant a supportive structure with calming vol and strong systematic buyers. Today, Neutral means positive gamma fighting against weaker breadth and lighter systematic support.
In practice, that calls for balance. Not maximum defense, not maximum offense, just rules-driven risk that can lean either way as the structure evolves.
Daily Regime Change Tracker
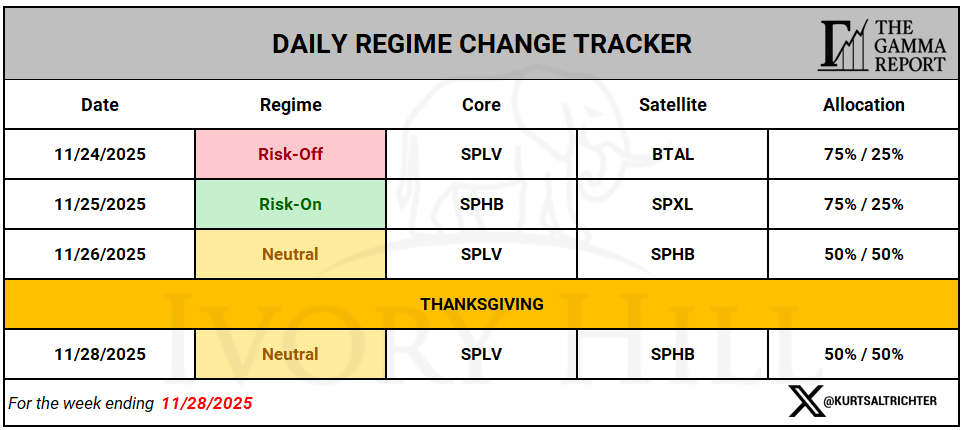
The daily regimes told a pretty clean story last week.
Monday 11/24: Risk Off, SPLV 75% and BTAL 25%
Tuesday 11/25: Risk On, SPHB 75% and SPXL 25%
Wednesday 11/26: Neutral, SPLV 50% and SPHB 50%
Thursday 11/27: Thanksgiving, no trades
Friday 11/28: Neutral, SPLV 50% and SPHB 50%
We started the week still in a Risk-Off posture that had been in place since the prior week’s negative gamma pocket. As gamma flipped and spot reclaimed the flip line, the model allowed us to step briefly into Risk-On, then settle into a Neutral mix by the close of the week.
This is what a functioning risk process looks like. You do not guess which headline will hit next. You respond to measured shifts in market structure.
Tactical Allocation Performance
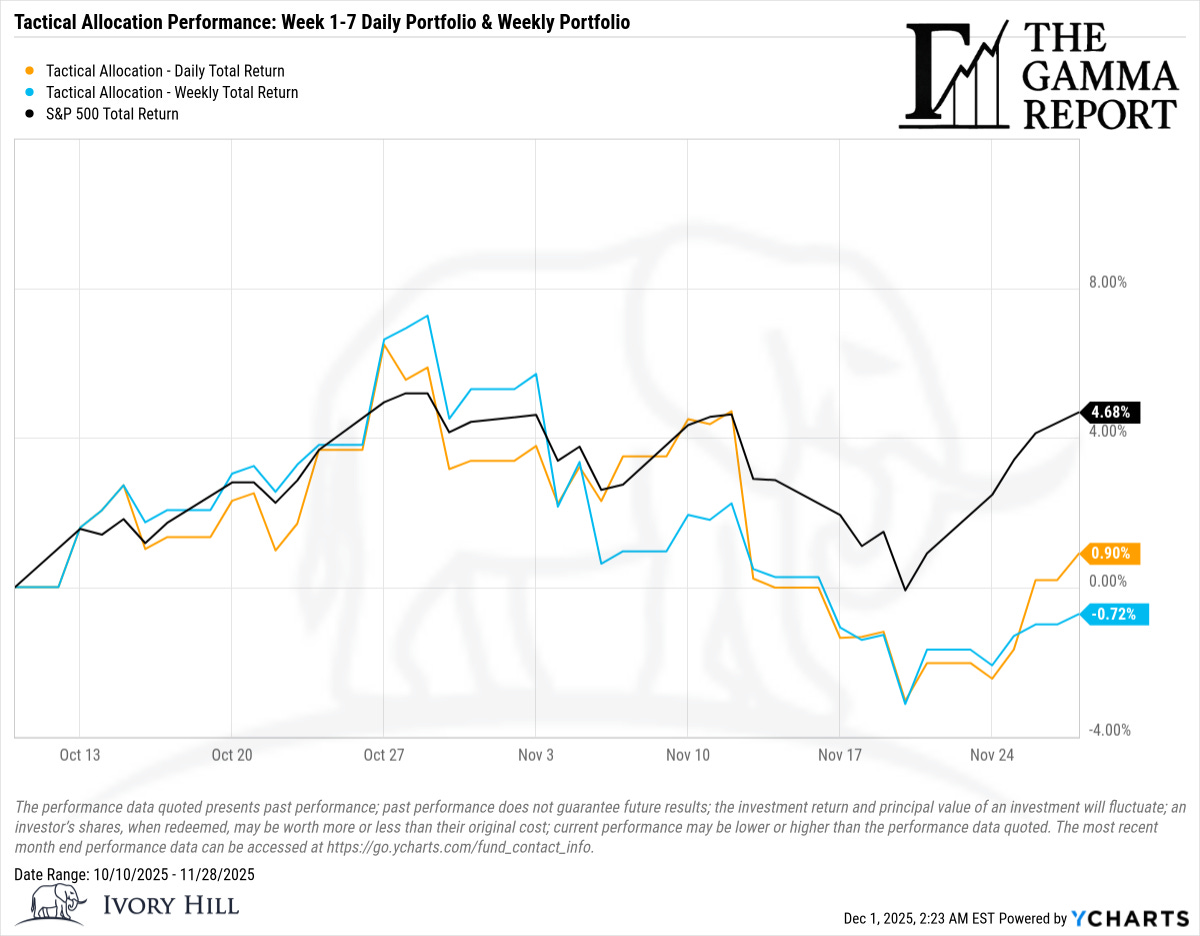
Since the tactical series launched on October 10, performance now looks like this:
S&P 500 Total Return: about +4.68%
Tactical Allocation – Daily portfolio: about +0.90%
Tactical Allocation – Weekly portfolio: about -0.72%
Earlier in November, both tactical sleeves were down relative to the index as the model respected negative gamma and rising realized vol while the tape tried to press higher. The last couple of weeks narrowed that gap. The daily sleeve flipped back into positive territory, while the weekly sleeve has only a small deficit.
The pattern is consistent with the design.
The daily portfolio adjusts faster to changes in gamma and realized vol. It will whipsaw a bit more in choppy stretches, but it also claws back faster when the structure turns.
The weekly portfolio trades only on Friday, suppresses noise, and accepts stretches of underperformance in exchange for fewer trades and lower behavioral risk.
Neither sleeve is trying to beat the S&P 500. The goal is to stay aligned with the structure, limit drawdowns, and compound over full cycles.
If you want a simple rule of thumb: the further away we are from positive gamma with healthy breadth and supportive flows, the more comfortable I am lagging a runaway tape in exchange for smaller holes to climb out of later.
Bottom Line
Last week was not a clean breakout or a full reset. It was a transition.
Dealers flipped back into positive gamma, which stabilizes day-to-day tape action.
Realized vol continued to rise, which keeps vol targeting strategies cautious.
CTAs and vol control trimmed exposure from elevated levels.
Breadth improved on the surface but remains trapped in the same range that has capped advances for three years.
The composite regime sits at Neutral, with a constructive gamma signal fighting three bearish components.
That mix does not call for heroic swings. It calls for staying balanced, letting the model dictate exposure, and resisting the urge to chase narratives.
Having an opinion is not an edge. The edge is in knowing which environment you are in and sizing risk accordingly.
Feel free to use me as a sounding board.
And remember - The one fact pertaining to all conditions is that they will change.
Follow me on X for more updates.
Best regards,
-Kurt
Schedule a call with me by clicking HERE
Kurt S. Altrichter, CRPS®
Fiduciary Advisor | President
Disclosure
The Gamma Report is published by Ivory Hill, LLC. All opinions and views expressed in this report reflect our analysis as of the date of publication and are subject to change without notice. The information contained herein is for informational and educational purposes only and should not be considered specific investment advice or a recommendation to buy or sell any security.
The data, models, and tactical allocations discussed in this report are designed to illustrate market structure and positioning trends and may differ from portfolio decisions made by Ivory Hill, LLC or its affiliates. Investing involves risk, including the possible loss of principal. Past performance is not indicative of future results.
Ivory Hil, LLC, and its members, officers, directors, and employees expressly disclaim any and all liability for actions taken based on the information contained in this report.
Do you post your daily allocation info somewhere?