

Market structure does not care about your opinion. It does not care about the headline, the revision, or the post-CPI knee-jerk. It cares about where price sits relative to the flip line, what dealers are doing with their hedges, and whether systematic flows are adding or removing exposure. Last week answered all three of those questions clearly. And the answer was: deterioration.
The S&P 500 opened the week at 6,965 and closed Friday at 6,836. That is a 129-point decline, roughly 1.9%. More importantly, it was the manner of the decline that matters. Monday through Wednesday held positive gamma territory, with spot sitting above the flip line. Thursday changed the structure. SPX sliced below the gamma flip level and stayed there. Dealers went from suppressing volatility to amplifying it. That is not a prediction. That is mechanics.
The model shifted from Risk-On to Neutral mid-week. This is the second time in the last two weeks the tape has failed to sustain a Risk-On regime. The pattern is becoming familiar: push above the flip line, generate a few days of positive gamma calm, then give it back. Until the market can hold positive gamma territory for more than a few sessions, the structural picture remains unconvincing.
Signal Summary
As of the close on Friday, February 13, 2026:
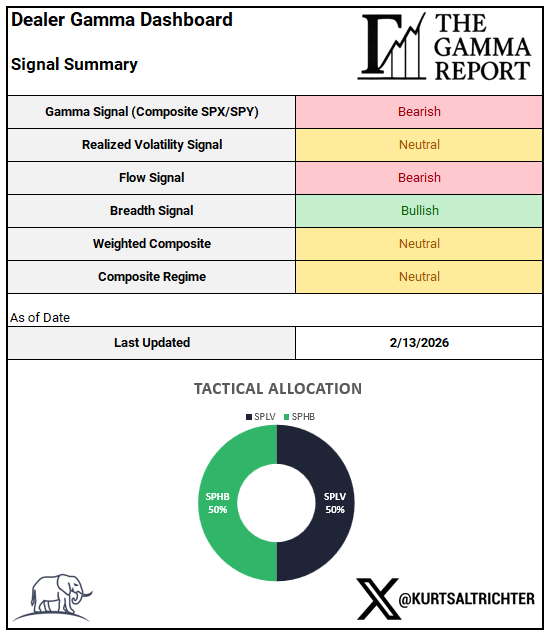
Gamma
SPX closed Friday at 6,836. The gamma flip line sits at 6,905. That puts spot 69 points below the threshold, firmly in negative gamma territory.
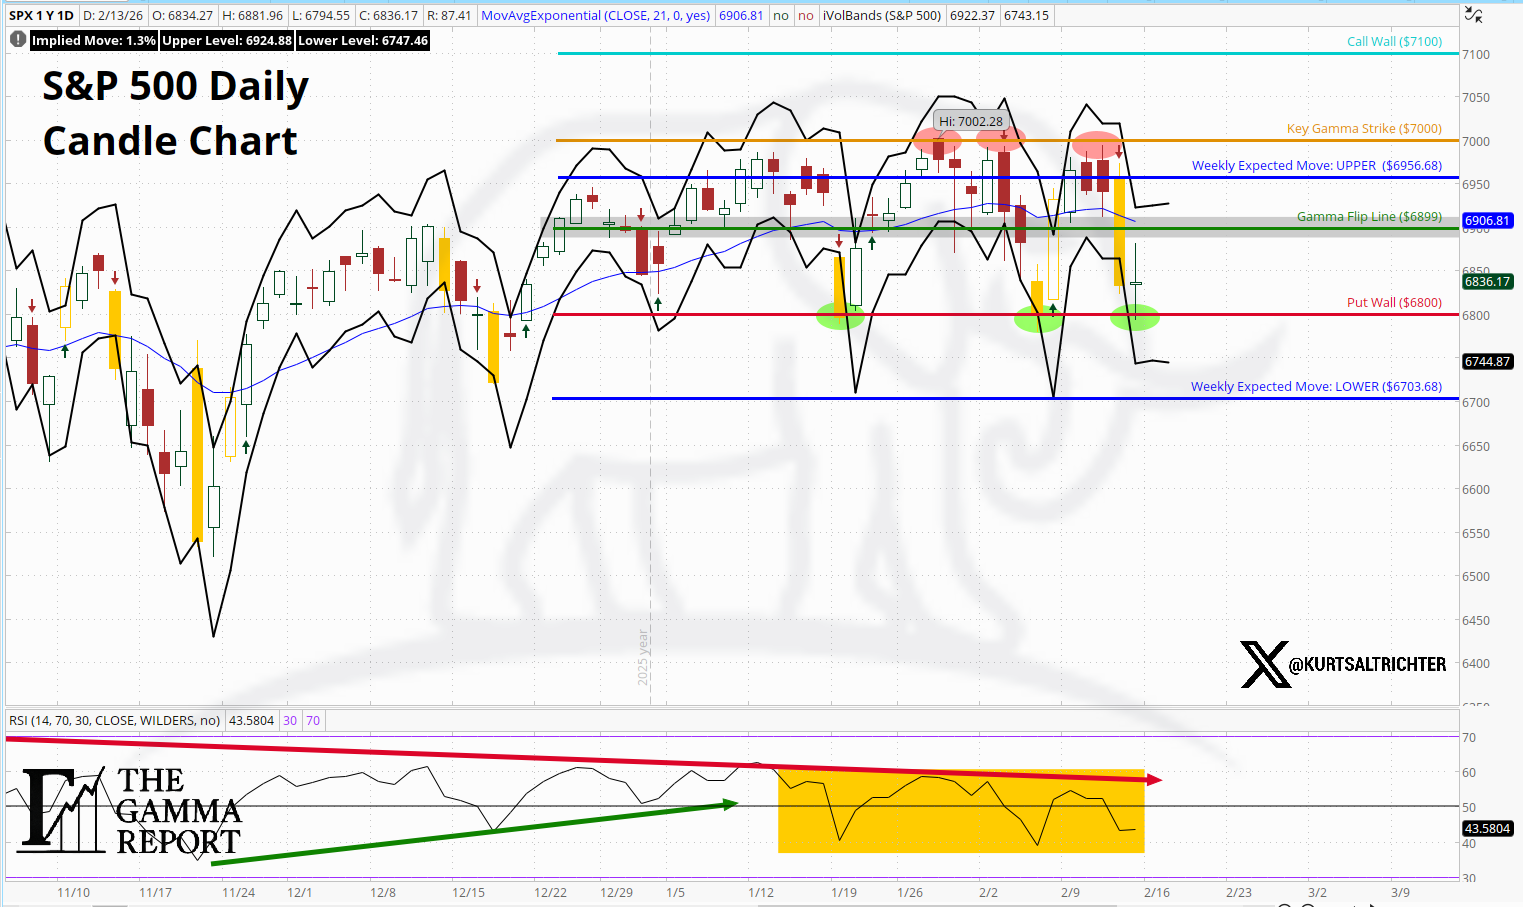
The week started with positive gamma. Monday through Wednesday, spot held above the flip line, with readings at 6,965, 6,940, and 6,934, respectively. The flip line over that period ranged from 6,946 to 6,927. Dealers were short gamma on the upside and hedging in a way that suppressed volatility. Dips were getting absorbed.
Thursday changed everything. SPX dropped 82 points to 6,852. The flip line was 6,912. The cross happened cleanly. Friday followed through to the downside, closing at 6,836 with the flip line at 6,905.
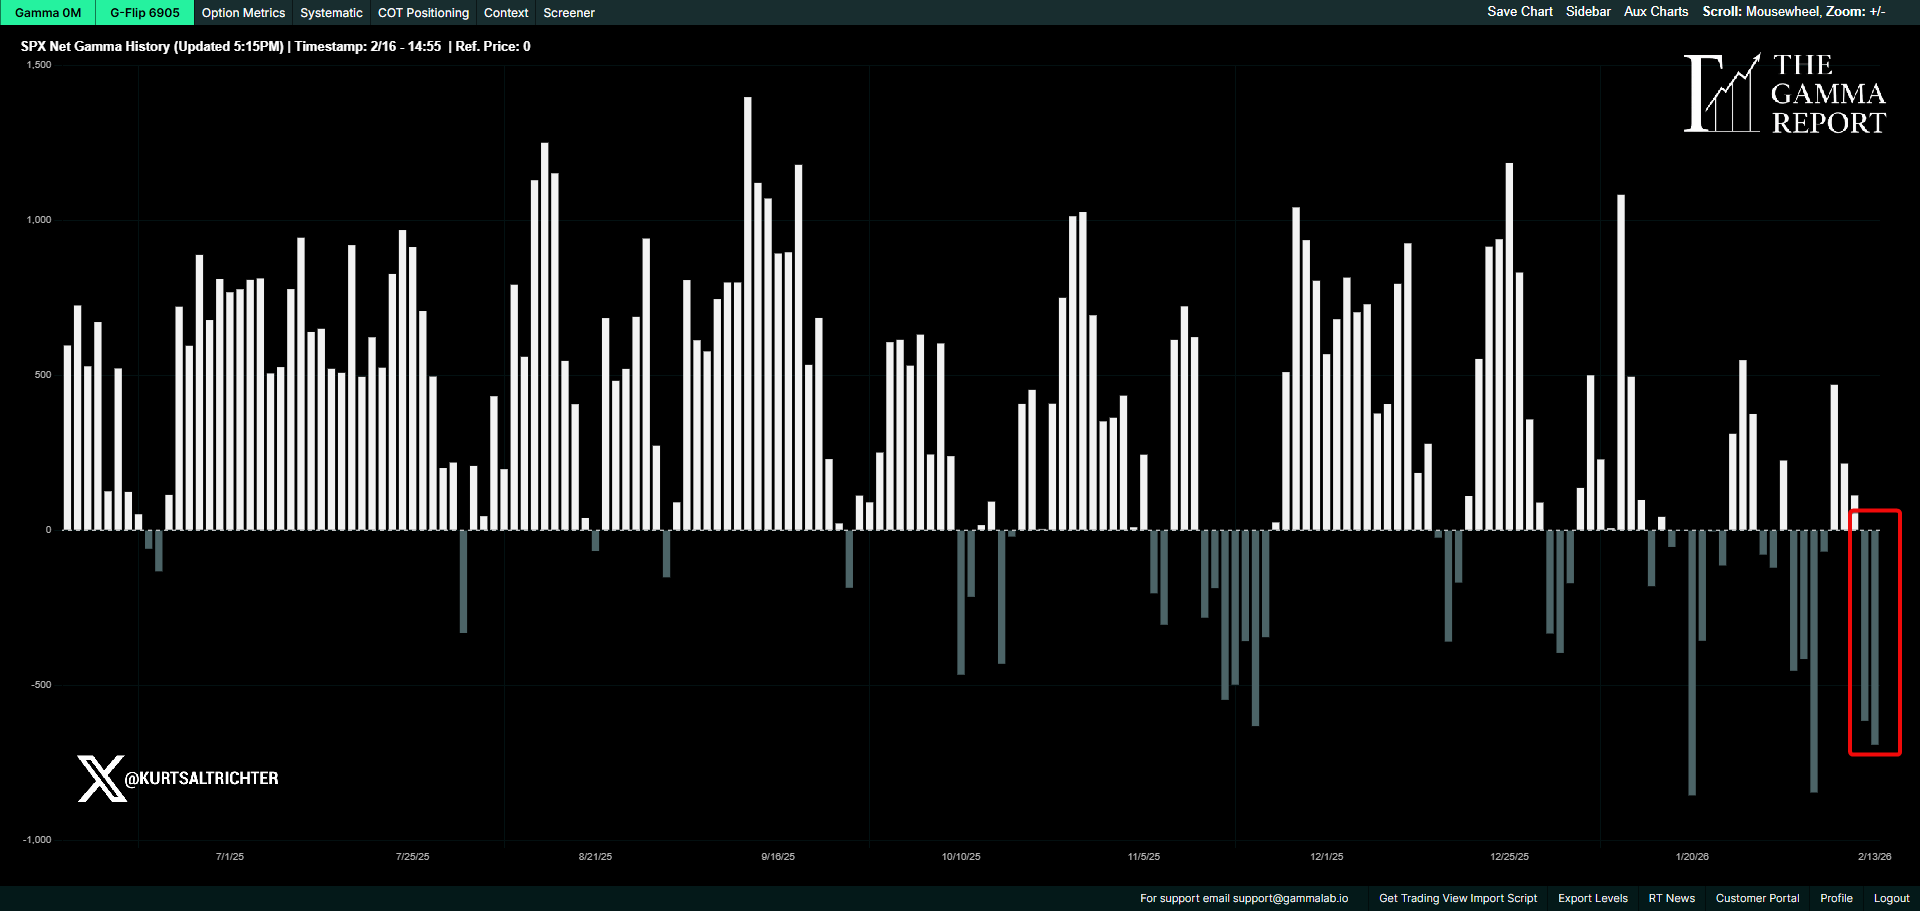
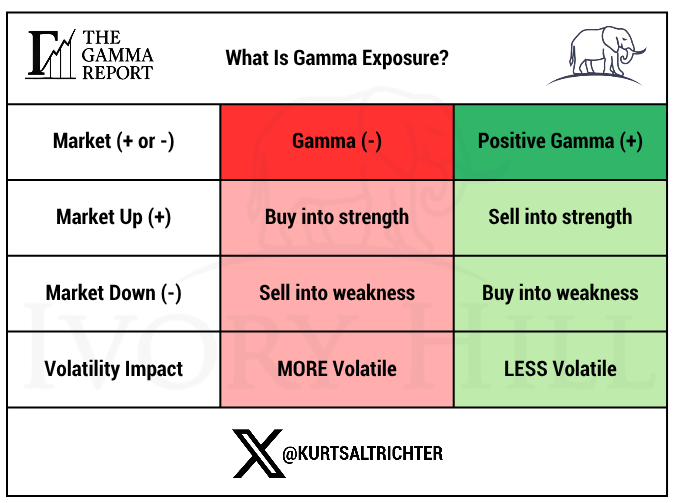
In negative gamma, dealer hedging works with the move, not against it. Declines can accelerate. Rallies get sold into. The volatility surface shifts. This is not a directional call. This describes how the liquidity structure behaves when the spot price is below the gamma flip line.
Realized Volatility
30-day realized volatility closed the week at 13.83%. 90-day realized volatility sits at 12.00%. Both are elevated relative to where they were at the start of the year, when the 30-day was printing near 8-9%.
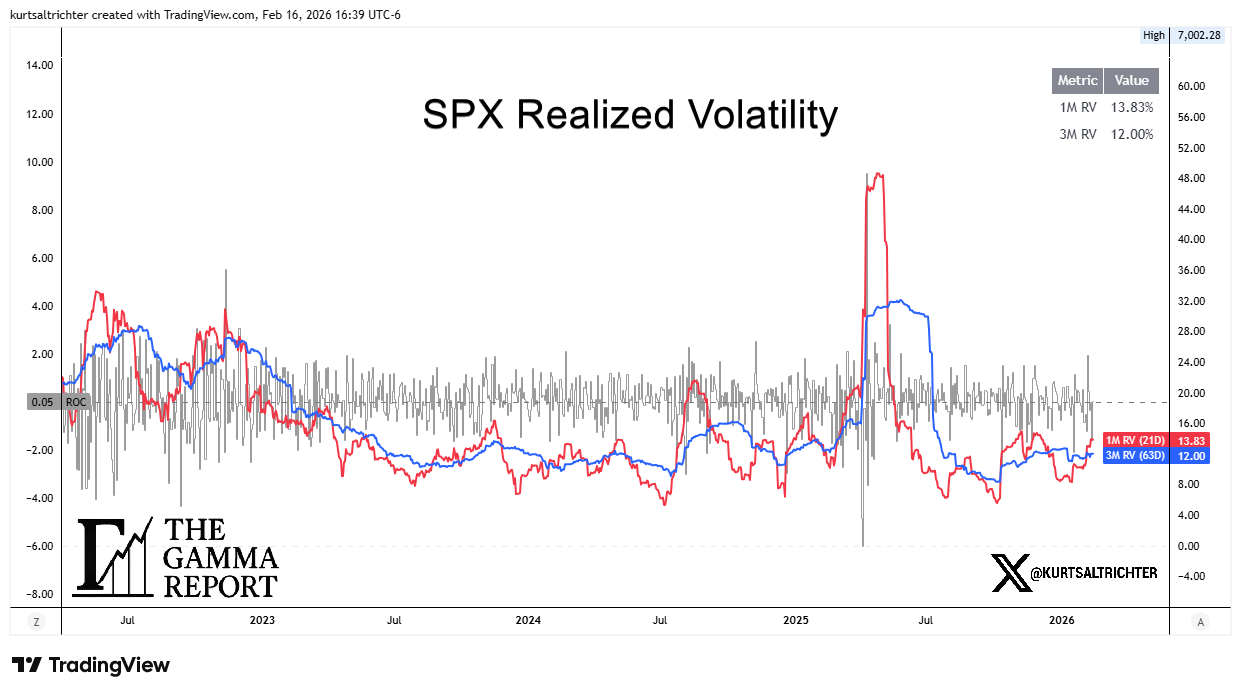
The directional trend matters more than the level. 30-day RV has risen from 10.05% on February 2 to 13.83% on February 13. That is a meaningful acceleration over a short window. Short-term volatility is still above long-term volatility, a condition that pressures vol-control funds to reduce exposure.
The RV signal remains Neutral. The threshold for a bearish reading has not been triggered, but the trajectory is not friendly. If 30-day continues to climb while 90-day holds steady, the signal will flip. For now, vol-control funds are not providing a tailwind.
The rate of change is what matters here. Realized volatility is expanding. That means the systematic bid is weakening.
Flows
CTAs are in a Falling trend. Vol-control exposure is also falling. The combined flow signal reads -1, Bearish.
This is the second consecutive week with bearish flow readings. CTAs have been trimming as the short-term trend weakened. The January rally that took SPX to 6,970 generated some trend-following interest, but the failure to hold those levels and the subsequent pullback to 6,836 has put CTAs back in reduction mode.
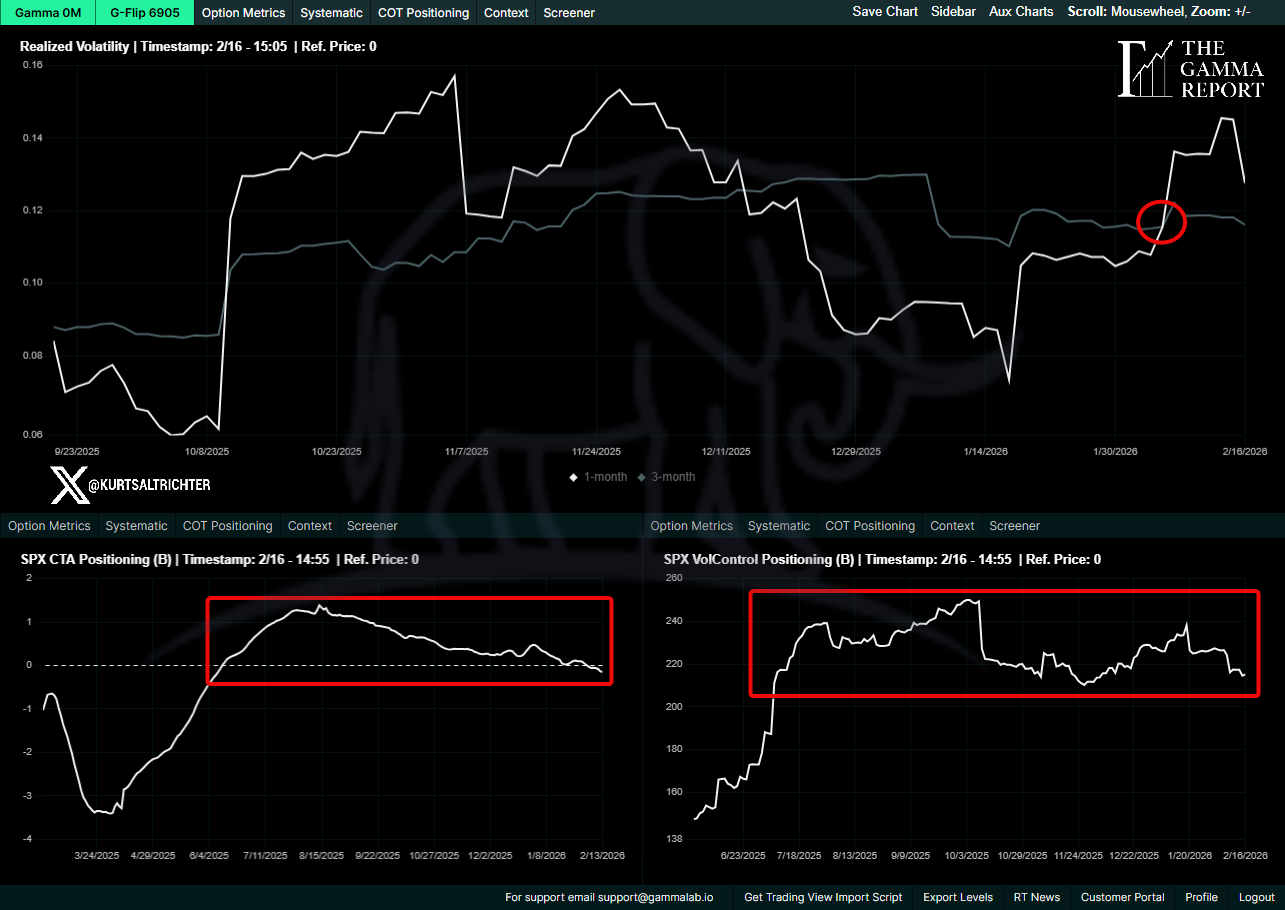
Vol-control funds are similarly positioned. With 30-day realized vol rising to 13.83%, these funds are mechanically reducing equity exposure. They do not make decisions based on narrative. They respond to the underlying volatility. Higher vol means lower allocation. That flow has been working against the tape for the past two weeks.
The combination of falling CTA exposure and falling vol-control exposure means systematic demand is not supporting this market. Any rally from here has to come from discretionary buyers, not mechanical flows. That is a structurally weaker setup than one in which systematic flows do the lifting.
Breadth
64% of S&P 500 constituents are trading above their 200-day moving average. The breadth signal remains Bullish.
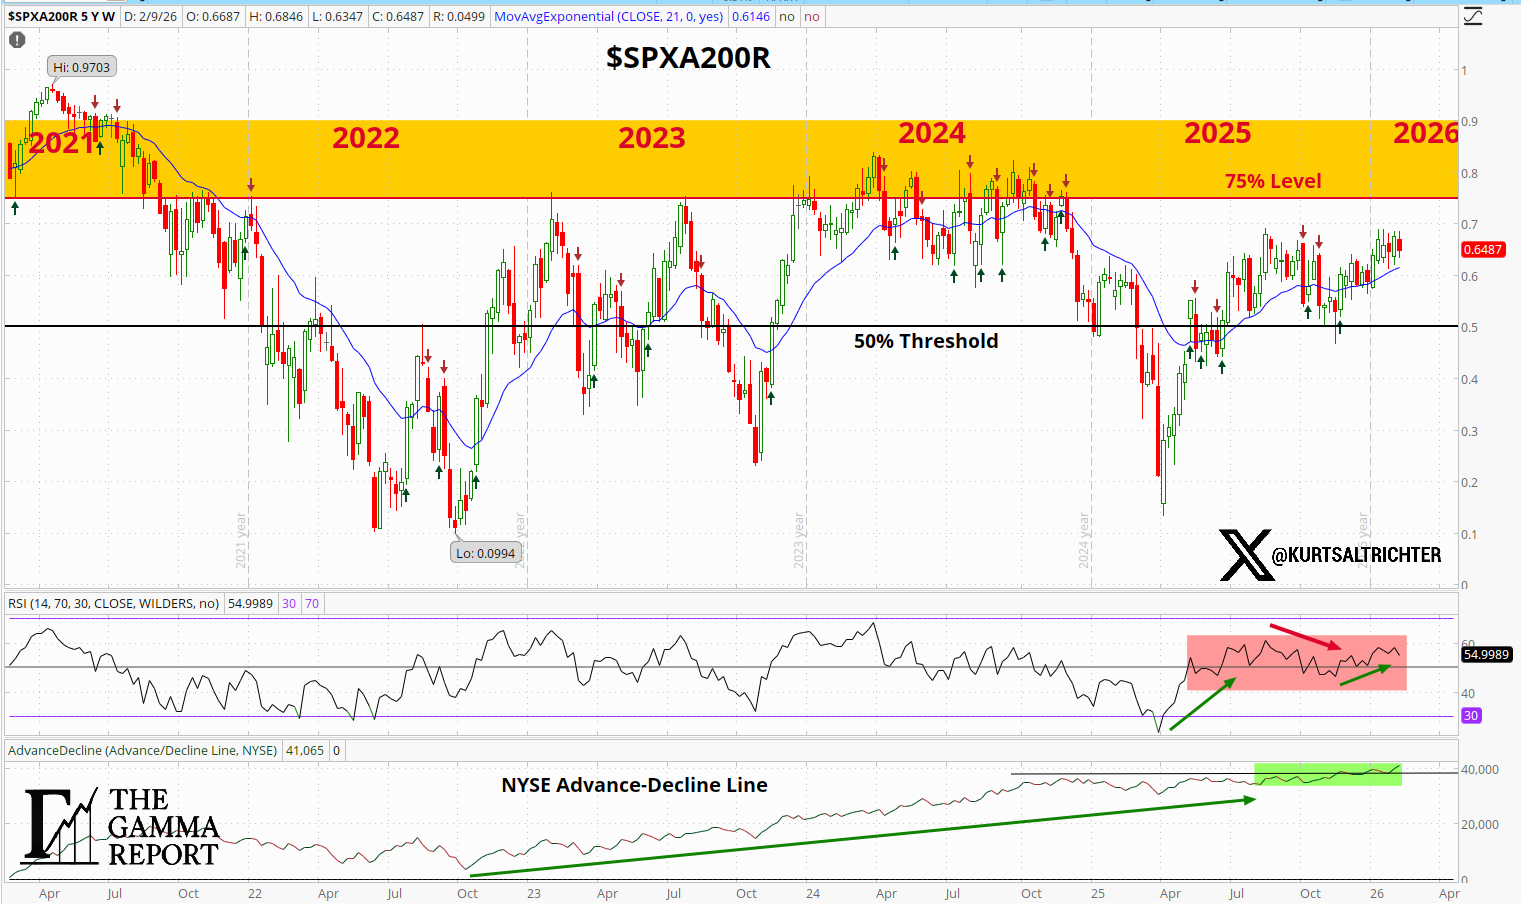
This is the lone constructive signal in the model right now. Participation has held up despite the pullback from the January highs. It means the decline over the past two weeks has not been broad enough to break the underlying structure of the trend.
However, context matters. Breadth has been slowly fading from the mid-to-high 60s range it held through late January. A market that is pulling back with stable breadth is in a different position than a market pulling back with breadth diverging lower. Right now, breadth is providing a floor, not a ceiling.
If breadth holds above 60%, the structural trend remains intact, and the model will continue to read Bullish on this signal. A break below 60% would remove the last remaining bullish input and open the door to a Risk-Off regime.
Composite and Regime
Two signals bearish, one neutral, one bullish. The composite math lands squarely in Neutral territory. This is a model telling you that the structural picture has deteriorated from where it was a week ago, but not enough to trigger a full defensive posture.
Last week, the composite read 0.85, Risk-On. This week it reads -0.20, Neutral. That is a meaningful one-week move. The primary driver was gamma. When spot fell below the flip line on Thursday, the gamma signal moved from Bullish to Bearish. That alone was enough to pull the composite below the Risk-On threshold.
The model does not chase. It does not try to anticipate the next flip. It measures the current state and positions accordingly. Right now, the current state is Neutral. The model respects that.
Tactical Allocation
The model shifted from a Risk-On posture (75% SPHB / 25% SPXL) to a Neutral posture (50% SPLV / 50% SPHB) mid-week when gamma flipped negative, and the composite dropped below the Risk-On threshold.
This is the process working. When structure supported risk, the allocation leaned into high beta and leveraged upside. When the structure deteriorated, the allocation moved to a balanced defensive position. No emotion. No narrative. Just regime measurement driving exposure.
The Neutral allocation splits evenly between low-volatility (SPLV) and high-beta (SPHB). It is designed to participate if markets recover while providing downside protection if the deterioration continues.
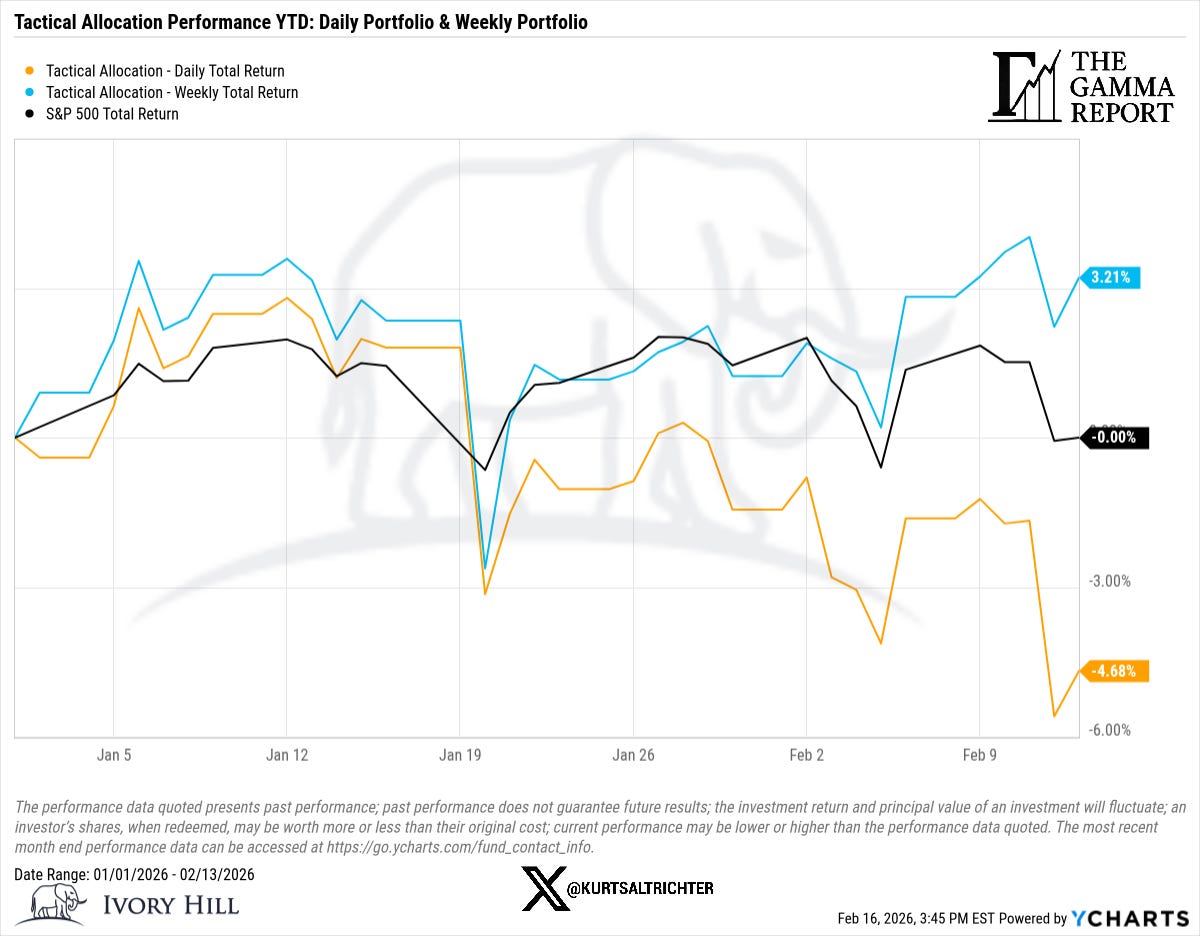
Performance
The process is about alignment, not outcome over any single week.
Bottom Line
Dealers are in negative gamma. SPX sits ~69 points below the flip line at 6,905. Volatility is being amplified.
Realized volatility is rising. 30-day RV at 13.83% is above 90-day at 12.00%. The rate of change is unfavorable for systematic exposure.
Flows are bearish. Both CTAs and vol-control funds are reducing exposure. There is no mechanical bid supporting the tape.
Breadth is the lone bullish signal. 64% of S&P 500 names remain above their 200-day moving average. This is holding the model out of Risk-Off.
The composite regime is Neutral. Allocation is 50% SPLV / 50% SPHB. The model has de-risked from last week’s Risk-On posture.
The market needs to reclaim the 6,905 gamma flip level and hold it to shift the structural picture back toward Risk-On. Until that happens, the regime remains undecided, and the model stays balanced.
And remember - The one fact pertaining to all conditions is that they will change.
Feel free to use me as a sounding board.
Follow me on X for more updates.
Best regards,
Schedule a call with me by clicking HERE
Kurt S. Altrichter, CRPS®
Fiduciary Advisor | President
Disclosure
The Gamma Report is published by Ivory Hill, LLC. All opinions and views expressed in this report reflect our analysis as of the date of publication and are subject to change without notice. The information contained herein is for informational and educational purposes only and should not be considered specific investment advice or a recommendation to buy or sell any security.
The data, models, and tactical allocations discussed in this report are designed to illustrate market structure and positioning trends and may differ from portfolio decisions made by Ivory Hill, LLC or its affiliates. Investing involves risk, including the possible loss of principal. Past performance is not indicative of future results.
Ivory Hill, LLC, and its members, officers, directors, and employees expressly disclaim any and all liability for actions taken based on the information contained in this report.