

As the S&P 500 pushed to fresh highs last week, the options market was telling a very different story beneath the surface. Volatility dislocations and rising index level correlations point to a setup that is far more fragile than price alone suggests. This is the kind of environment where calm can disappear quickly.
Thursday’s 1/29 selloff and reversal was a good reminder of that risk. Positioning has become crowded into short dated index volatility and upside single stock calls. When that happens, it does not take much to trigger outsized moves. Hedging flows accelerate, liquidity thins, and price overshoots in both directions.
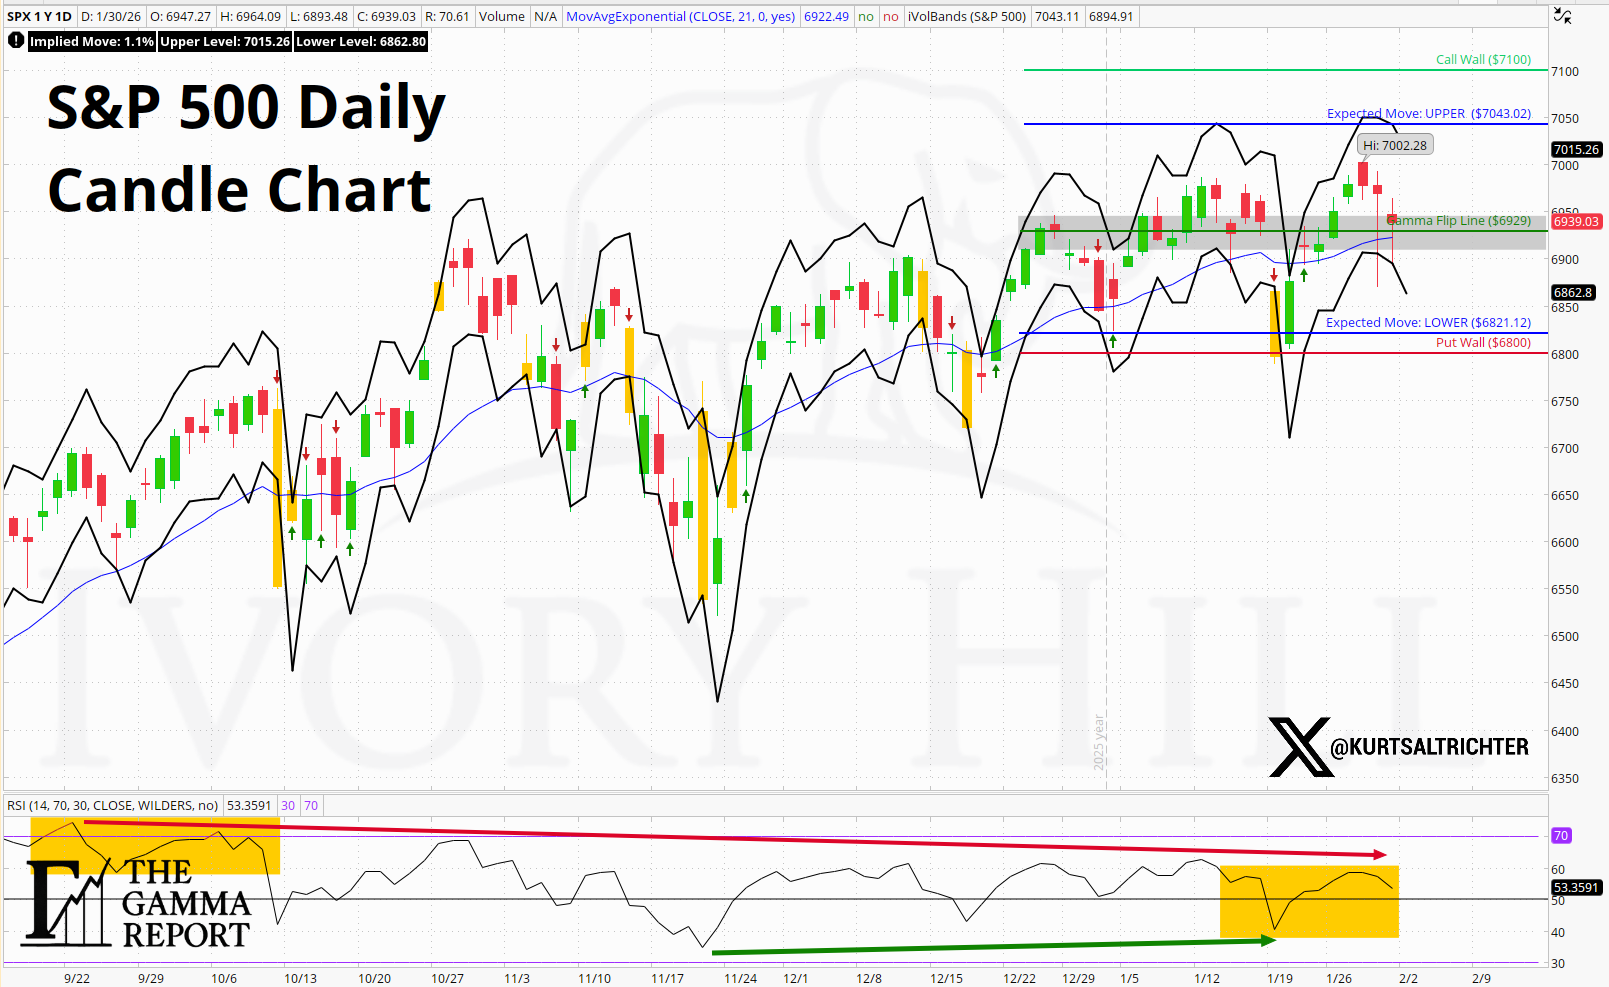
SPX briefly touched 7,000 for the first time and bounced right off of last week’s upper expected move, but the week ended with volatility reasserting itself. That combination, record prices paired with growing instability under the hood, reinforces the need for restraint and discipline as we head into February.
Dealer Gamma and Market Structure
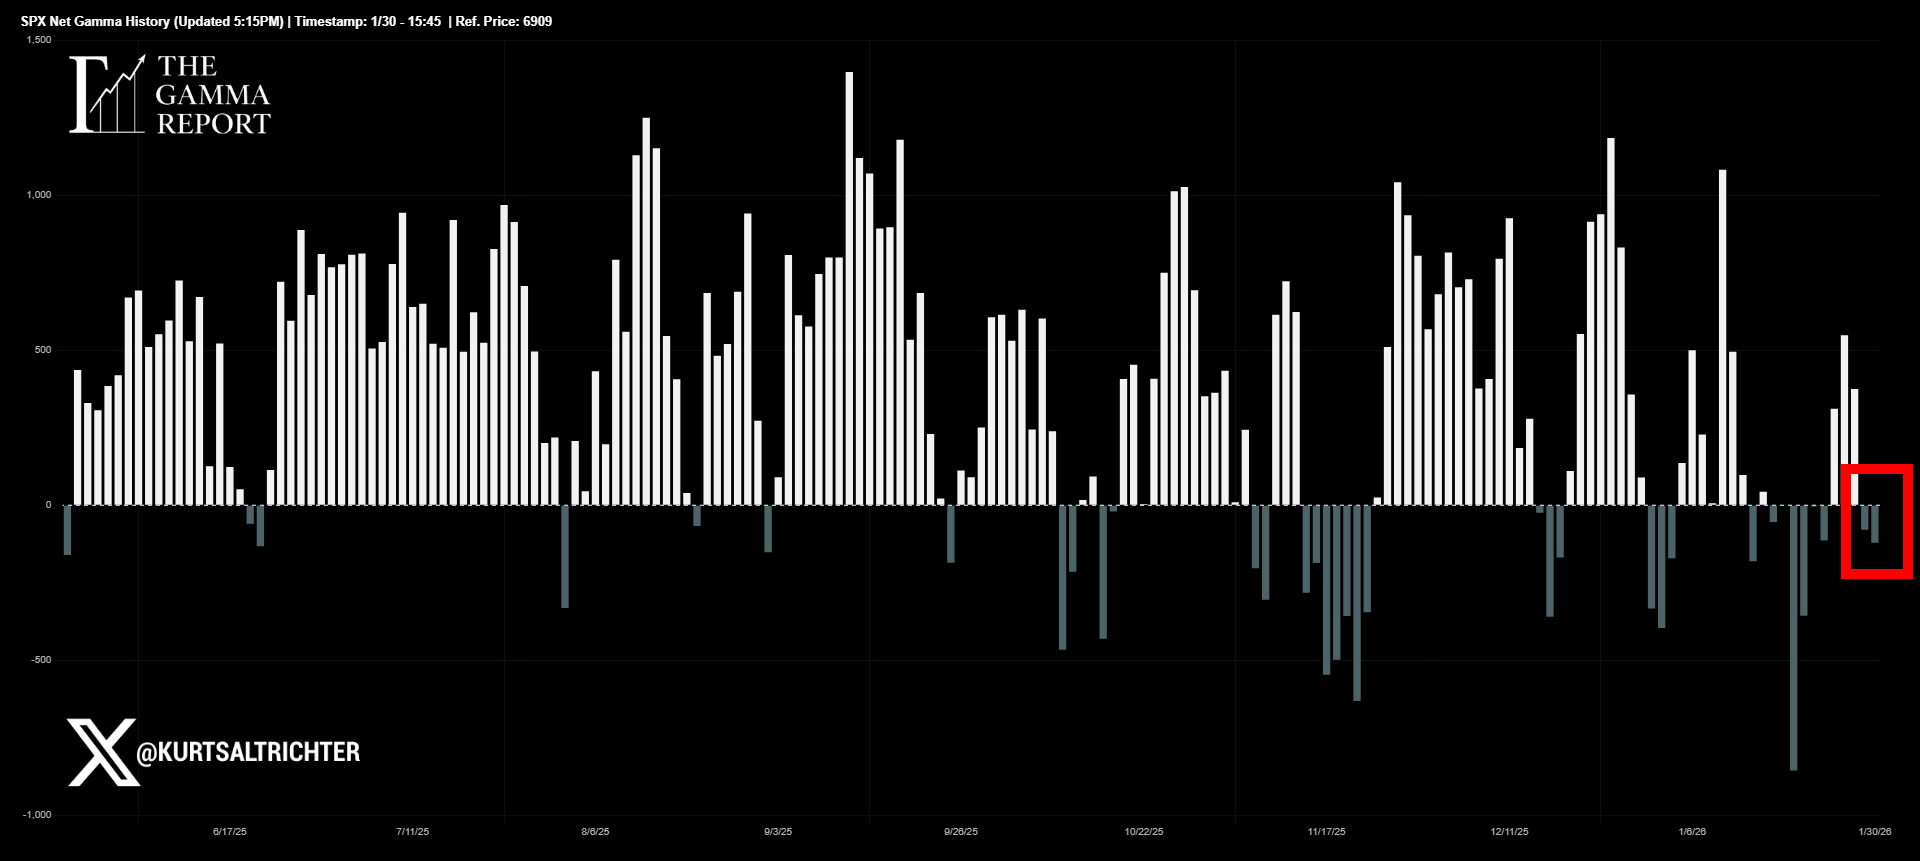
Dealer positioning slipped back into negative gamma late last week. That shift changes how liquidity behaves across the index.
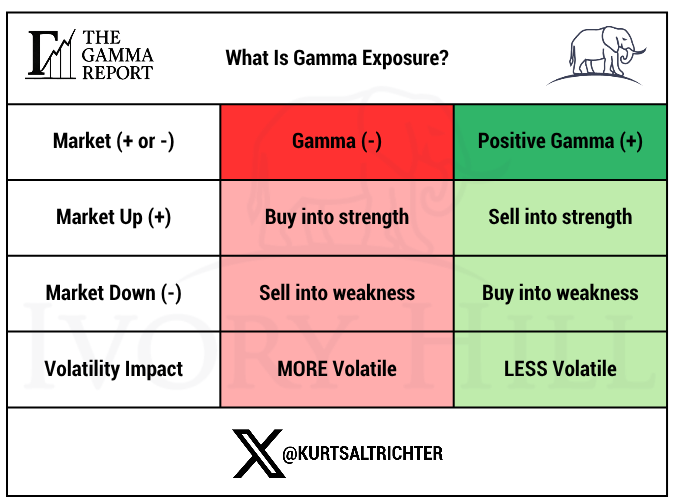
In positive gamma environments, dealers lean against moves in price and suppress volatility. In negative gamma, that dynamic flips. Dealers are forced to hedge with price, buying strength, and selling weakness. The result is faster volatility extensions, deeper pullbacks, and wider intraday ranges even in the absence of headlines.
As of Friday’s close, SPX remains below the gamma flip near 6,929. Until the price can reclaim and hold above that level, the market stays structurally sensitive to flows. This is not a directional call. It is a liquidity call.
Realized Volatility and Vol Control
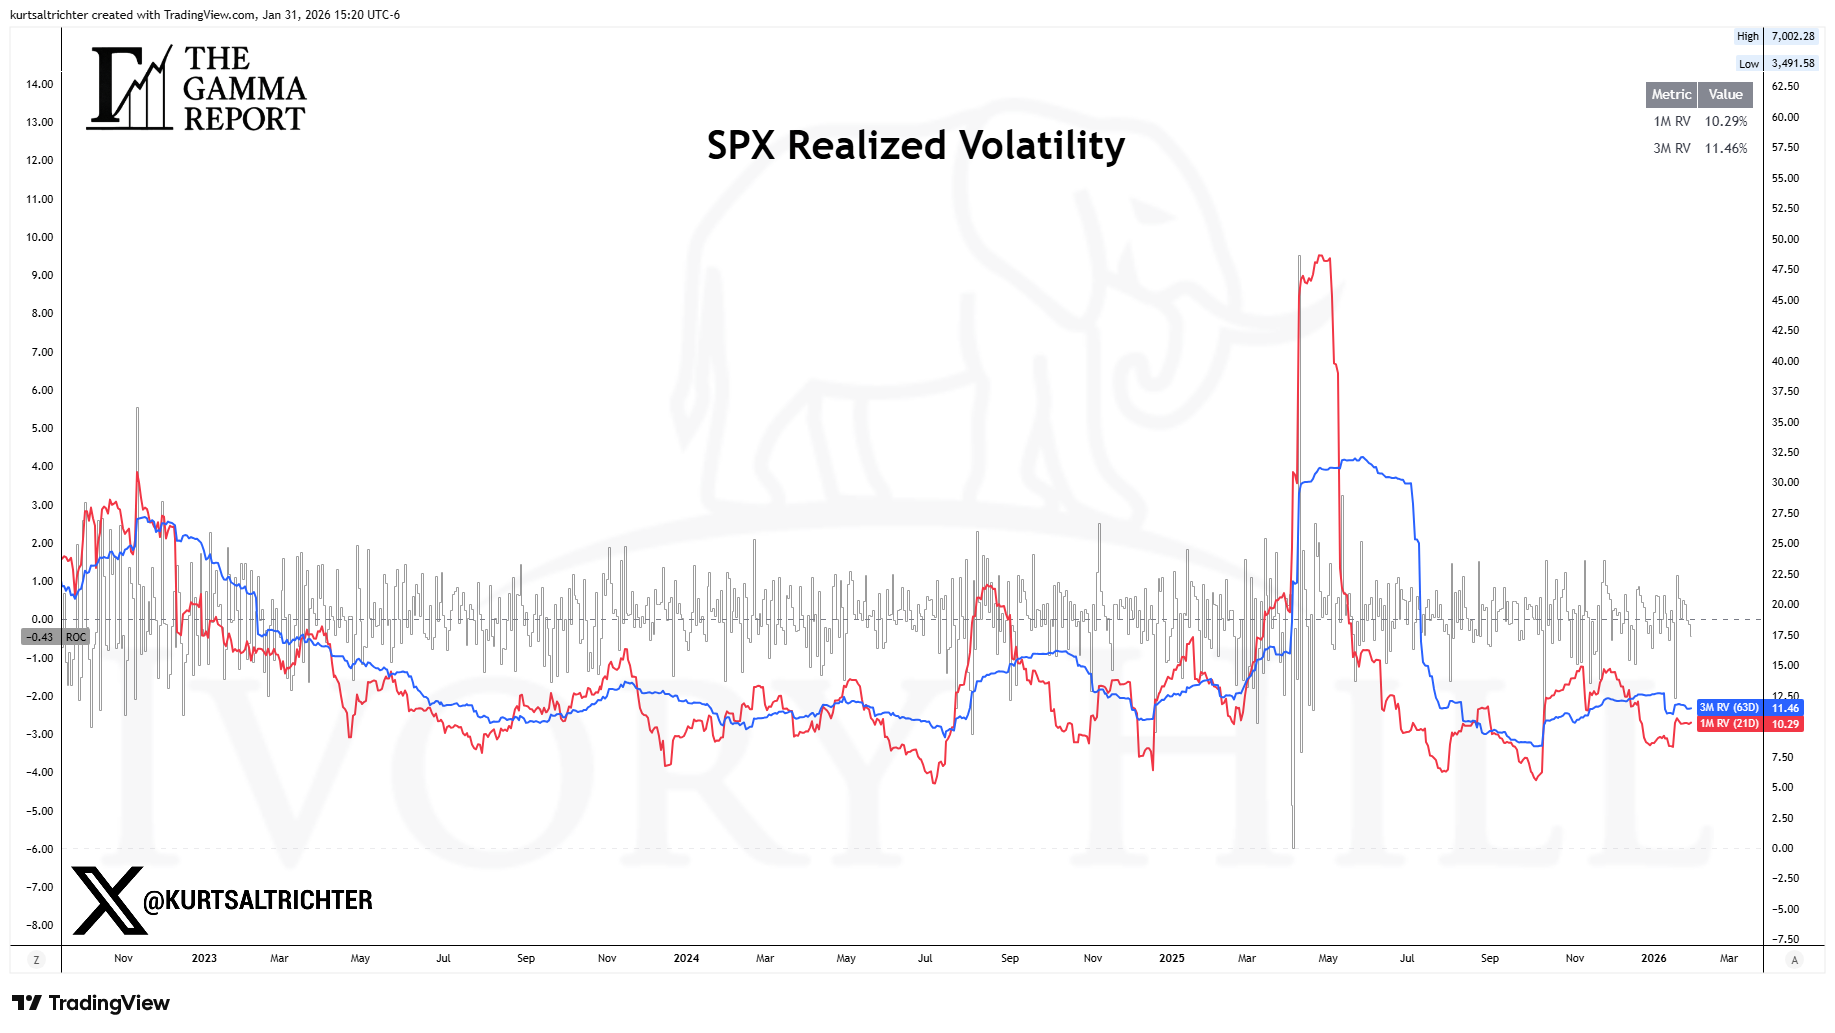
Realized volatility continues to compress, with one-month realized volatility (RV) sitting below three-month RV. That setup keeps volatility targeting strategies engaged, but only marginally.
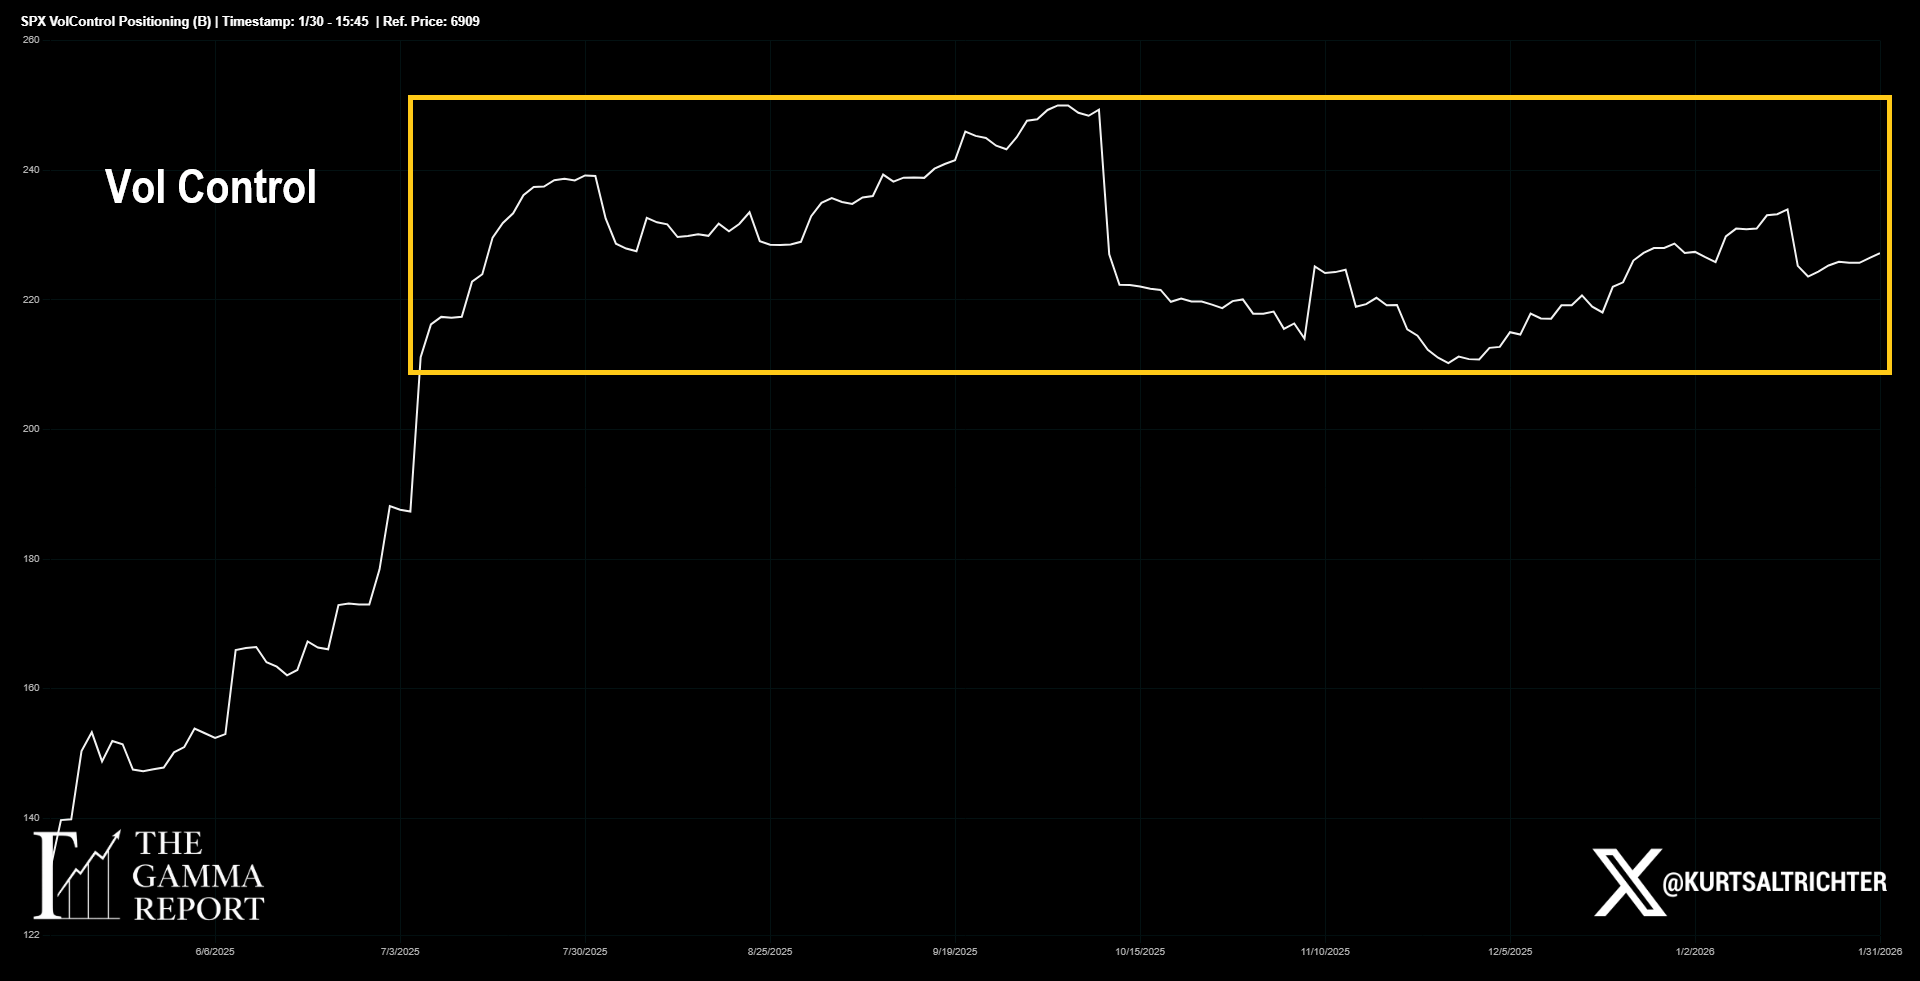
Vol control exposure has stabilized within a defined range. It is providing some downside cushioning, but it is no longer expanding. This is support.
If realized volatility compresses further, vol control can add meaningfully. If volatility rises (the red line moves above the blue line), that support fades quickly. Right now, vol control is neutral at best and should not be relied on to drive upside.
Systematic Flows and CTA Positioning
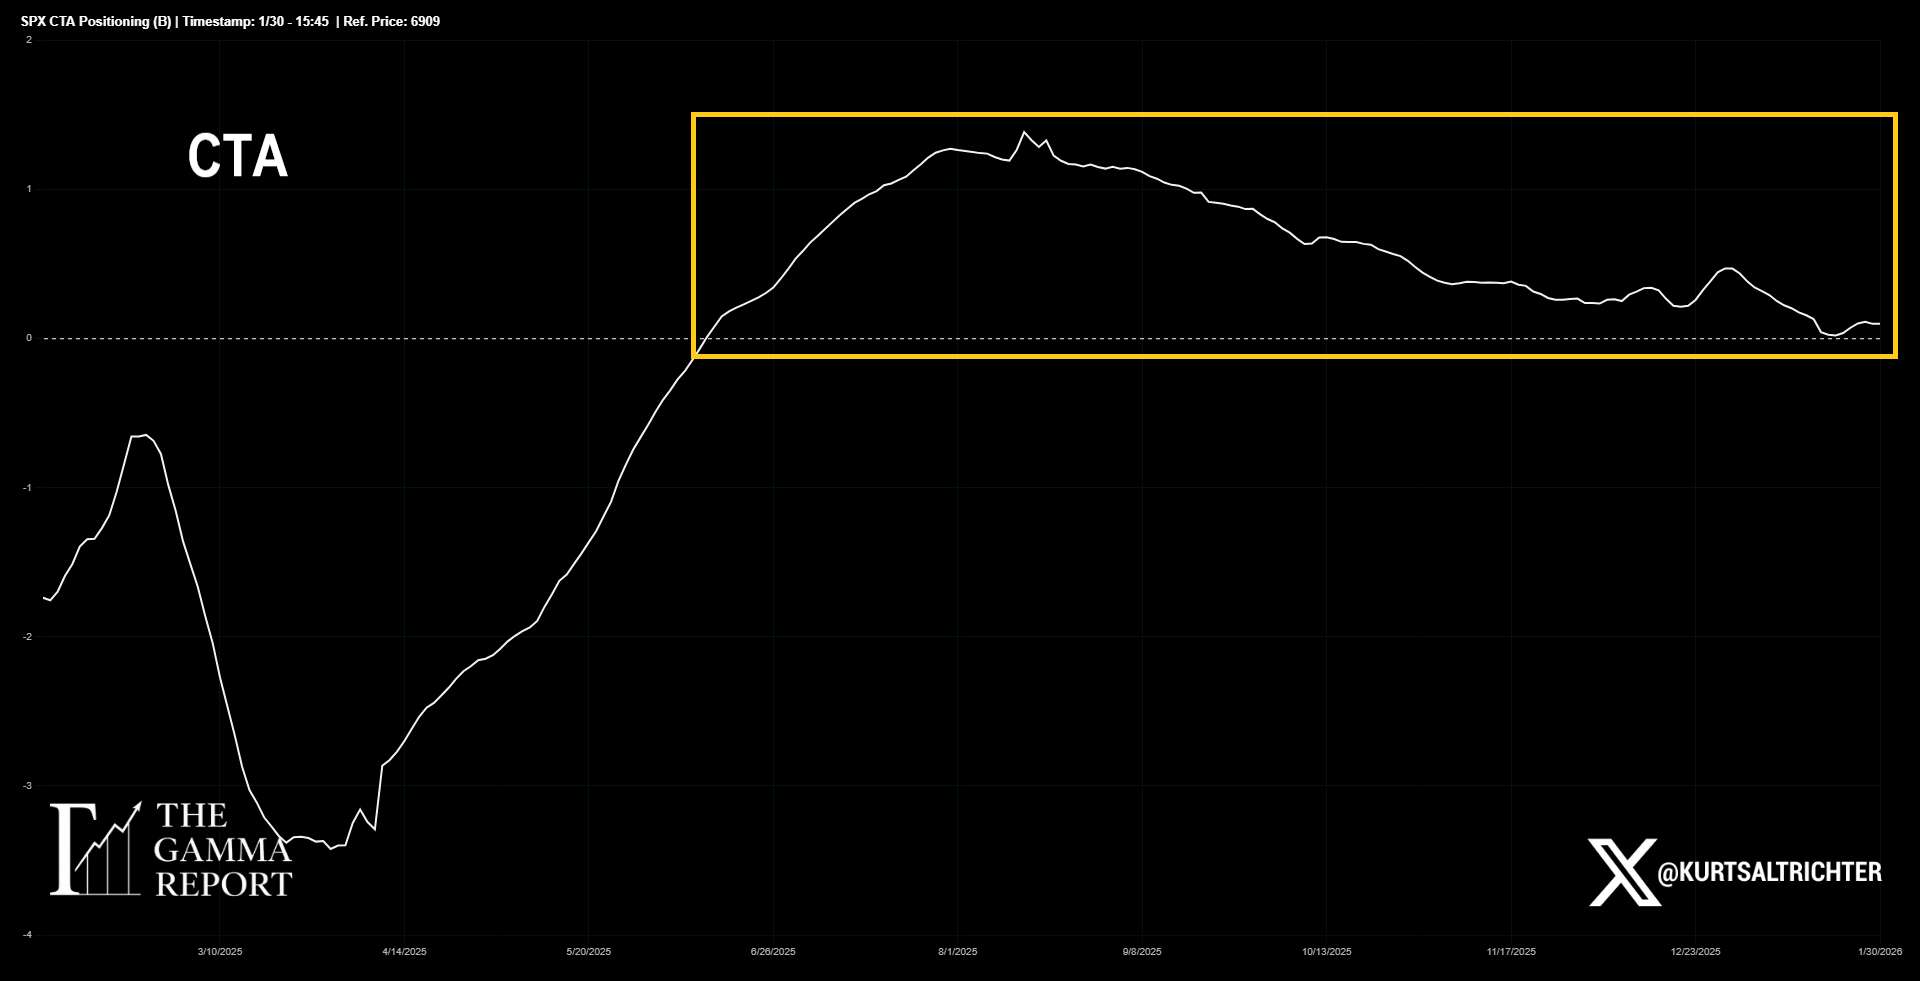
CTA exposure has rolled over and flattened. Trend following models are no longer adding equity exposure and are effectively in a wait-and-see mode.
CTAs are not aggressively short, but they are no longer a source of incremental demand. When CTAs stop buying, and vol control stops expanding, markets tend to compress. That is exactly what we are seeing now.
Systematic flows are no longer driving this tape.
Breadth and Participation
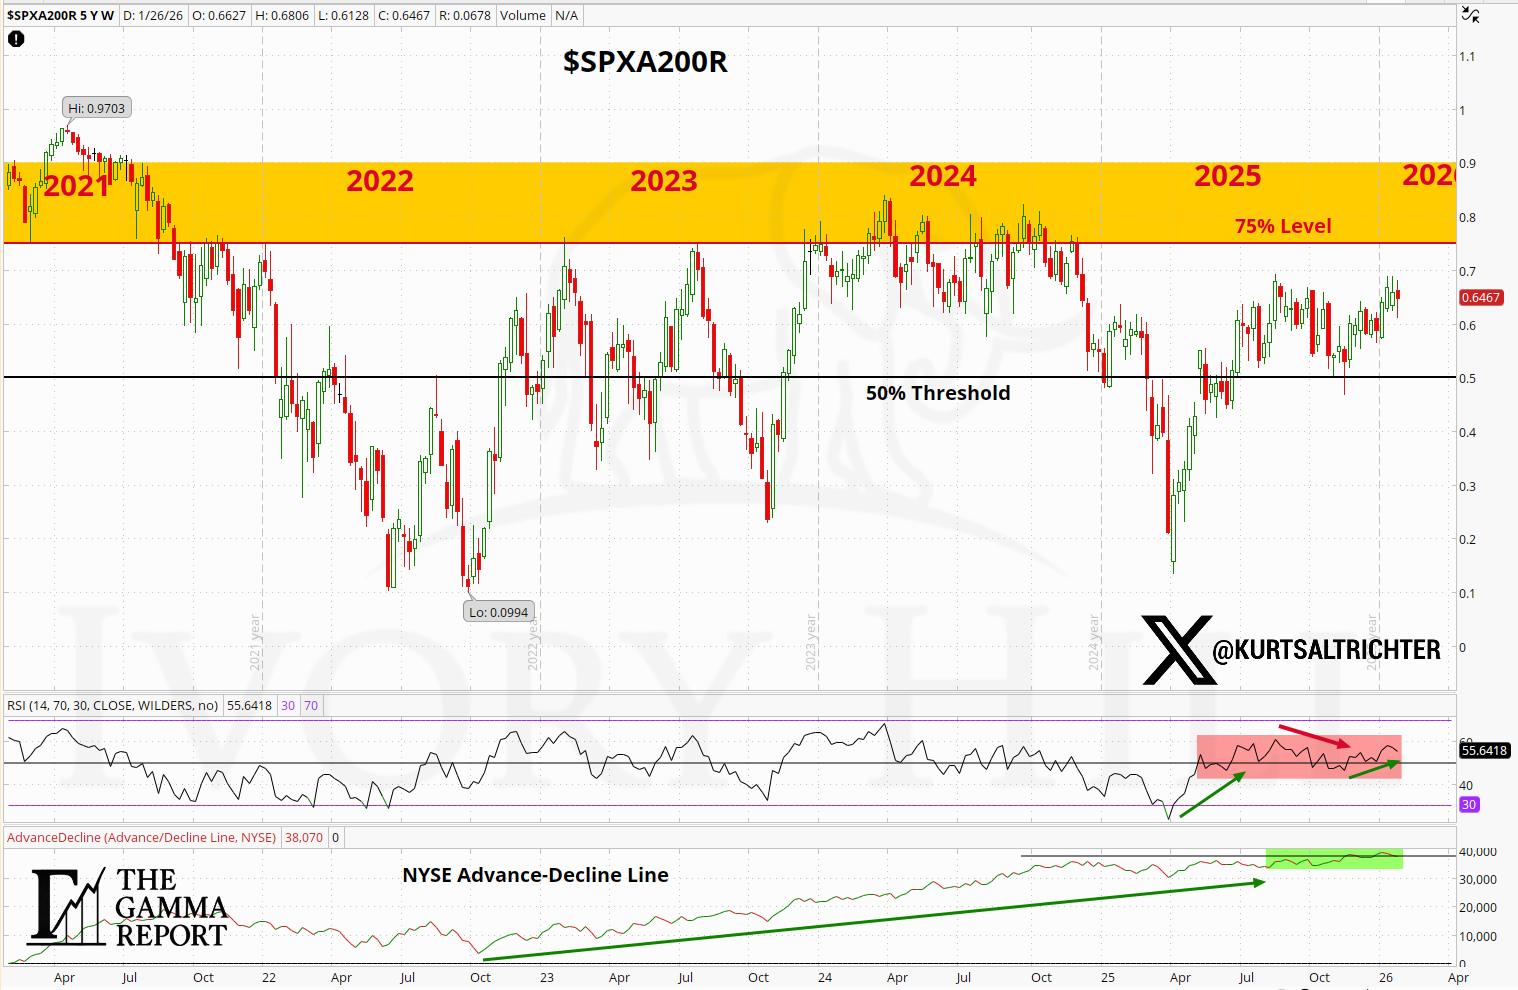
Breadth remains the most important volatility suppressor in this market. Roughly 65% of S&P 500 stocks remain above their 200-day moving average, which has helped keep downside contained despite negative gamma and softer flows.
That said, the message from breadth is changing. The NYSE advance-decline line continues to trend higher, confirming that weakness remains selective rather than systemic. However, the slope has flattened. Participation is no longer accelerating.
Breadth is preventing downside from snowballing, but it is no longer strong enough on its own to justify pressing leverage.
Composite Signal and Regime
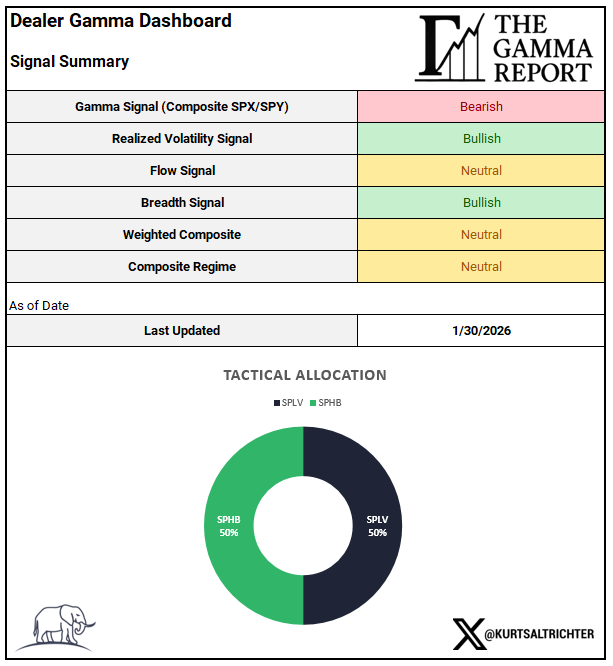
The weighted composite is Neutral, and the composite regime has shifted accordingly.
This is a classic transition setup. Risk is not broken, but it is no longer cheap.
Price, Levels, and the Expected Move
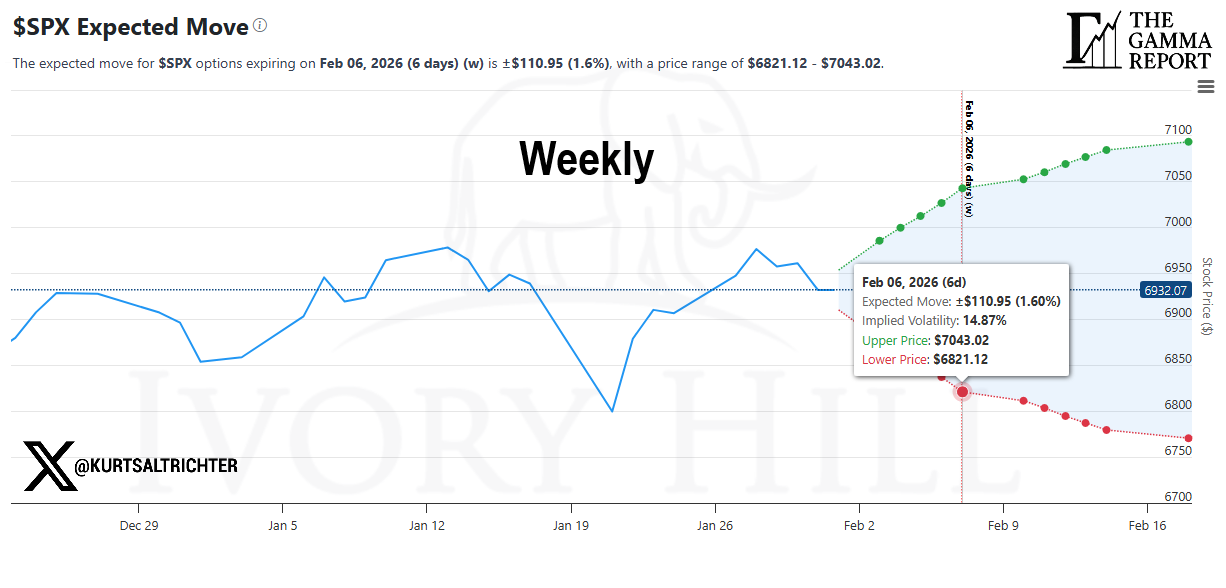
SPX closed the week near 6,900, remaining inside the dealer risk envelope. The weekly expected move is approximately plus or minus 1.6%, defining a range from 6,821 to 7,043.
As long as the price remains inside this range, breakout chasing carries poor risk-to-reward. Acceptance above the upper bound would force dealers to change behavior. Acceptance below the lower bound would do the same in the opposite direction.
Until then, patience is the trade.
Tactical Allocation and Regime
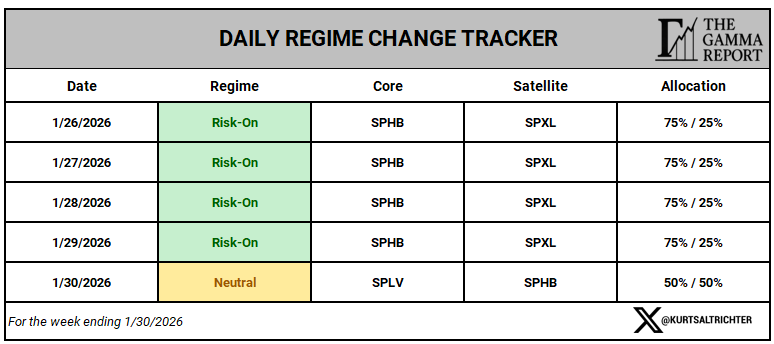
The daily model shifted to Neutral on Friday, holding:
50% SPLV
50% SPHB
The weekly model also closed Neutral after briefly operating in a risk-on posture earlier in the week.
This shift reflects structure, not emotion. The model reduced exposure as gamma weakened, flows faded, and volatility risk increased beneath the surface.
Performance Context
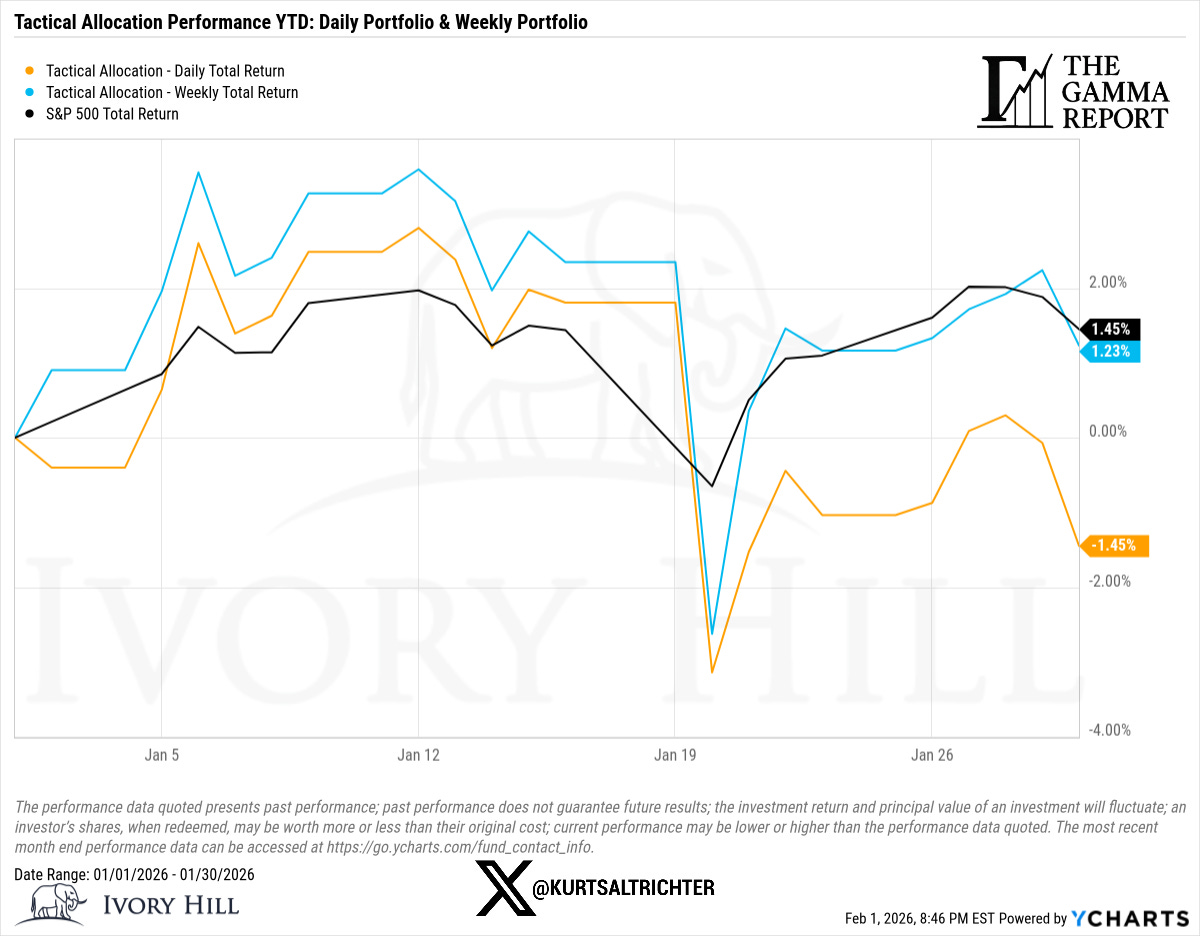
The short-term dispersion between the daily and weekly sleeves reflects regime shifts, not errors. The objective is to align with structure and drawdown control, not to force exposure when conditions deteriorate.
Performance is shown for transparency, not bravado.
Bottom Line
Gamma is negative.
Systematic flows are fading.
Volatility is contained, but not collapsing.
Breadth is supportive, but no longer improving.
These conditions reward balance, not aggression. The edge comes from respecting the regime and letting the structure dictate exposure.
Feel free to use me as a sounding board.
And remember - The one fact pertaining to all conditions is that they will change.
Follow me on X for more updates.
Best regards,
Schedule a call with me by clicking HERE
Kurt S. Altrichter, CRPS®
Fiduciary Advisor | President
Disclosure
The Gamma Report is published by Ivory Hill, LLC. All opinions and views expressed in this report reflect our analysis as of the date of publication and are subject to change without notice. The information contained herein is for informational and educational purposes only and should not be considered specific investment advice or a recommendation to buy or sell any security.
The data, models, and tactical allocations discussed in this report are designed to illustrate market structure and positioning trends and may differ from portfolio decisions made by Ivory Hill, LLC or its affiliates. Investing involves risk, including the possible loss of principal. Past performance is not indicative of future results.
Ivory Hill, LLC, and its members, officers, directors, and employees expressly disclaim any and all liability for actions taken based on the information contained in this report.