

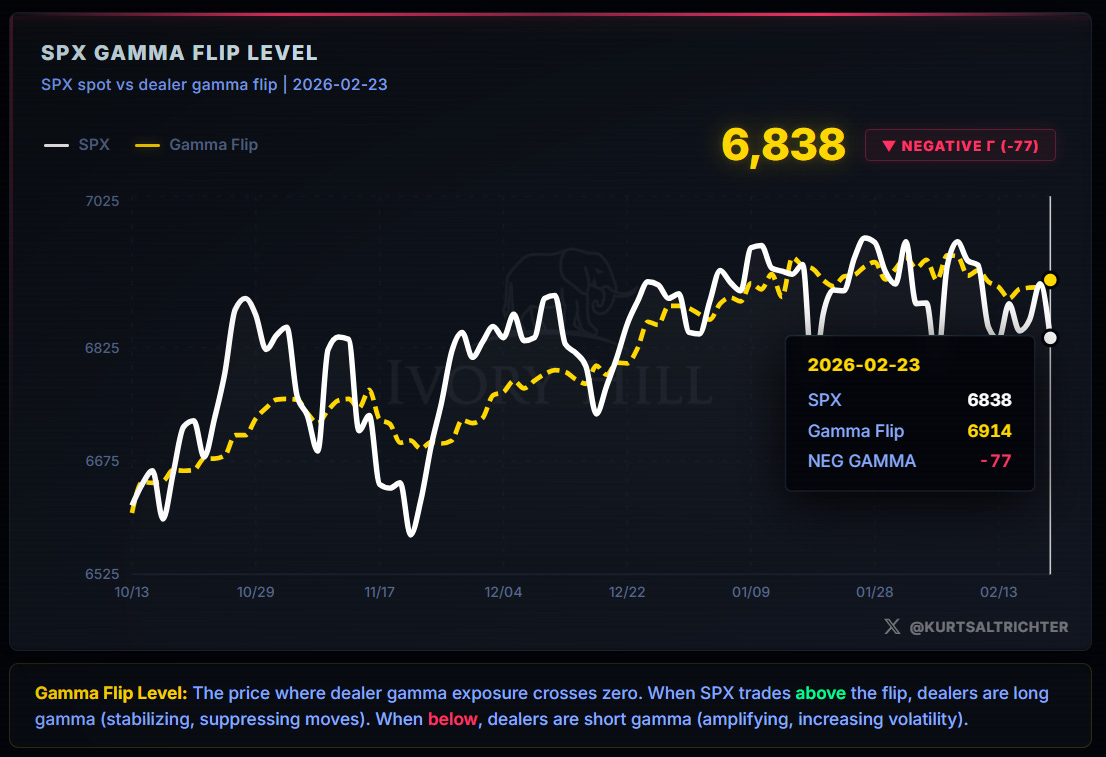
The market is operating in a familiar pattern. Push above the flip line, generate a brief window of positive gamma, then give it back. Last week provided another clean example. As of the close on Monday, February 23, 2026, SPX sits at 6,838 with the gamma flip line at 6,914. The gap has narrowed slightly, but not enough to change the structural picture.
This is not a tape for high-conviction directional bets. It is a tape for discipline.
Dealer Gamma and Market Structure
SPX closed Monday at 6,838. The gamma flip line sits at 6,914. That puts spot 76 points below the threshold, firmly in negative gamma territory.
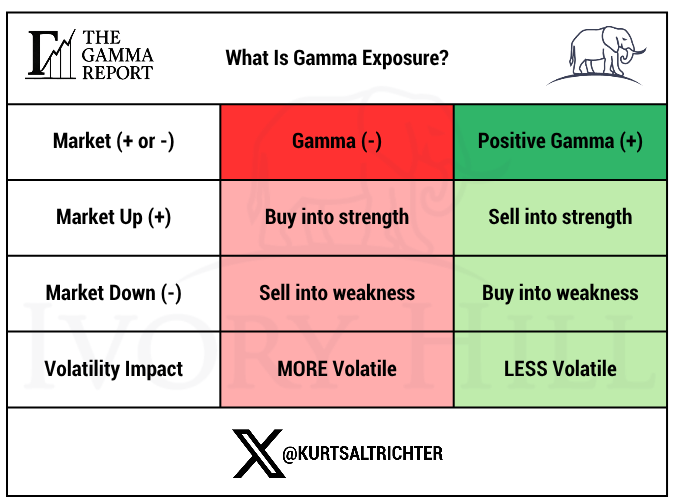
Below the flip, dealer hedging works with the move, not against it. When the price falls, dealers sell into weakness. When price rallies, dealers buy into strength. The result is fat intraday ranges, fast reversals, and moves that feel larger than whatever headline is driving them. This is why you want to use the expected moves as your range.
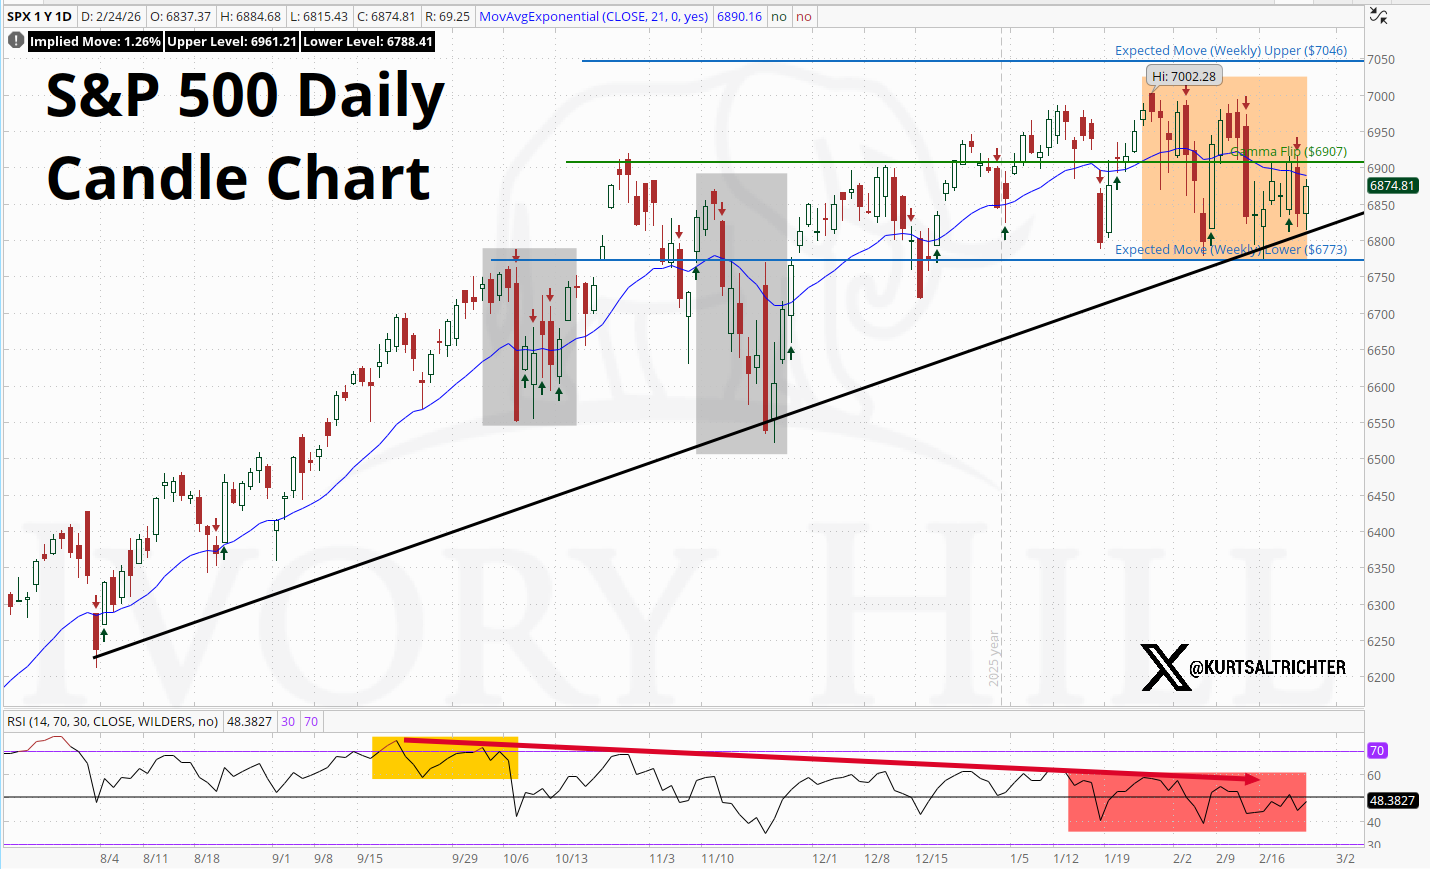
Key levels from the chart:
Gamma Flip: 6,914
Upper Expected Move: 7,046
Lower Expected Move: 6,773
Call Wall: 7,000
Put Wall: 6,800
Implied move: ~1.32%
The market remains pinned between Put Wall support and Gamma Flip resistance. Until price can reclaim and hold 6,914, the structural picture stays unchanged.
Realized Volatility and Vol Control
30-day realized volatility (RV) sits at 12.3%. 90-day realized volatility is 11.7%. The 1M reading is running above the 3M reading, a condition that mechanically pressures vol-control funds to reduce equity exposure.
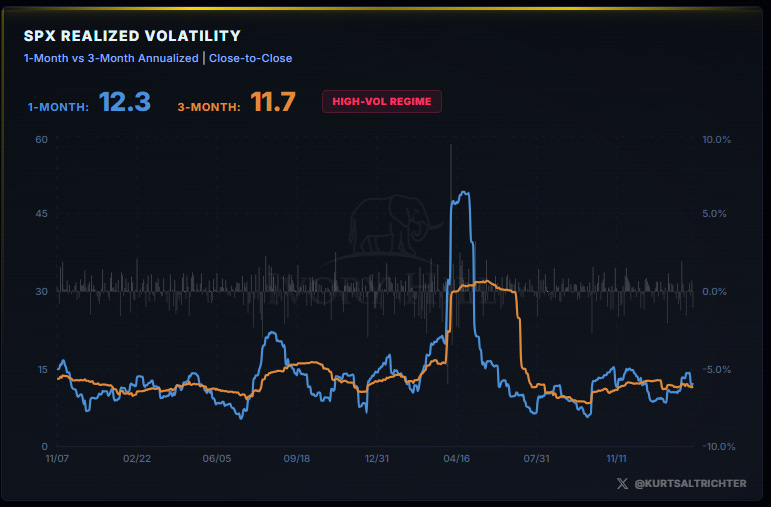
The directional trend matters more than the level. 30-day RV has been rising since early February. Short-term volatility is still above longer-term volatility, a condition that pressures vol-control funds to reduce exposure.
The RV signal remains Neutral. The threshold for a Bearish reading has not been triggered, but the current trajectory is not giving us hope. If 30-day RV continues to climb while 90-day holds steady, the signal will flip. For now, vol-control funds are not providing a tailwind.
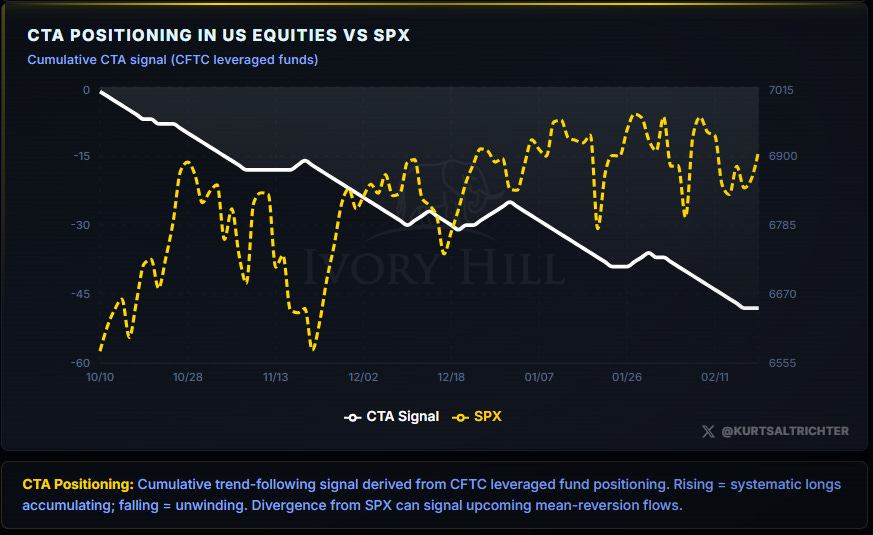
Flows: CTA and Vol Control
CTAs are in a Falling trend. The failure to hold above the flip line and the subsequent pullback to 6,838 have put CTAs into reduction mode. This is the third consecutive week with bearish CTA readings.
Vol-control exposure is also softening. With 30-day realized vol rising, these strategies are mechanically reducing equity allocation. That flow has been working against the tape, but it could flip back to buying if NVDA follows through on earnings tomorrow.
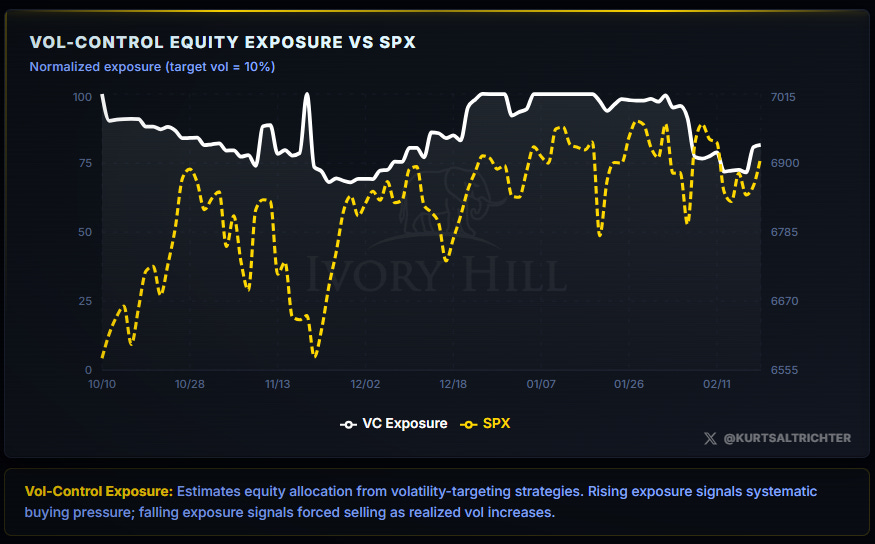
The combined flow signal reads Neutral this week, as Vol-Control exposure has stabilized enough from its recent lows to pull the reading back from last week’s Bearish. However, the underlying message is the same: systematic demand is not supporting this market. Any rally from here has to come from discretionary buyers, not mechanical flows. That is a structurally weaker setup than one in which systematic flows do the lifting.
Breadth and Participation
66% of S&P 500 constituents are trading above their 200-day moving average. The breadth signal remains Bullish. The Optimism threshold is 60%, and the market is holding above it.
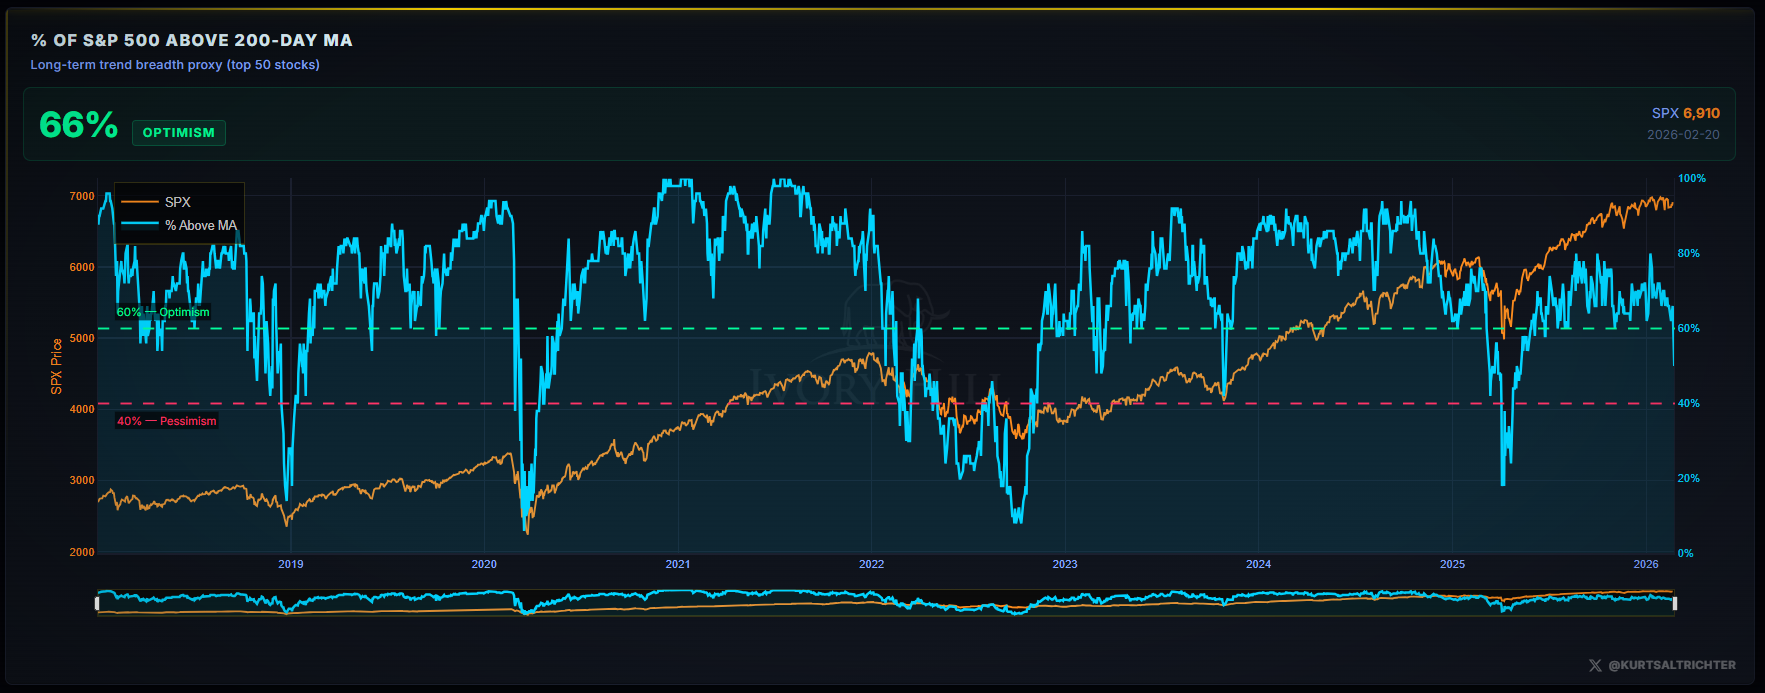
This is the one signal the bears cannot fully claim. Two-thirds of the index is still trading above its 200-day moving average, which means the pullback from January has been orderly rather than indiscriminate. The underlying trend structure has not broken. That is not a green light, but it is a meaningful distinction.
However, context matters. Breadth has been slowly fading from the mid-to-high 60s range it held through late January. A market that is pulling back with stable breadth is in a different position than a market pulling back with breadth diverging lower. Right now, breadth is providing a floor, not a ceiling. Watch the 60% level closely. If breadth slips toward that threshold, the one remaining bullish signal in the model loses its edge.
Composite Signal and Regime
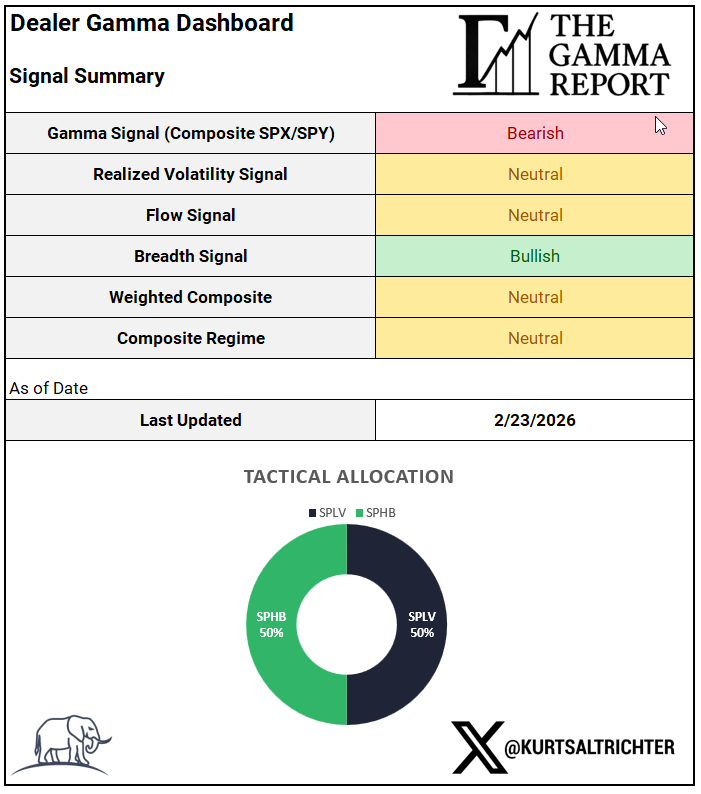
The composite signal remains Neutral. The inputs:
Gamma Signal: Bearish — SPX below the gamma flip, negative gamma territory
RV Signal: Neutral — 1M RV above 3M RV, High-Vol Regime, at the threshold
Flow Signal: Neutral — CTA and vol-control softening, but not in full unwind
Breadth Signal: Bullish — 66% above 200DMA, holding the Optimism zone
Three of four signals are Neutral or Bearish. The weighted composite resolves to Neutral, and the Composite Regime is Neutral.
The pattern from the past three weeks has been consistent: push above the flip line, get a few days of positive gamma calm, give it back. Until the market can hold positive gamma territory for more than a few sessions, the structural picture remains unconvincing. For the model to shift to Risk-On, two things need to happen:
SPX must reclaim and hold above 6,914
Realized volatility must stop rising and begin to fall
Tactical Allocation
As of the close on Friday, February 20, 2026, the model remains Neutral:
50% SPLV
50% SPHB
The Neutral allocation is designed to participate if markets recover while providing downside protection if deterioration continues. SPLV provides defensiveness against a negative gamma acceleration. SPHB preserves exposure to the upside if price reclaims the flip line and holds.
The model is not forecasting a direction. It is positioning for the regime. Forcing a conviction bet in either direction is not what the signals are saying. The job right now is to stay balanced and avoid forcing exposure.
Performance
Year-to-date performance as of February 20, 2026:
Tactical Allocation — Weekly Rebalance: +4.12%
S&P 500 Total Return: +1.10%
Tactical Allocation — Daily Rebalance: -3.84%
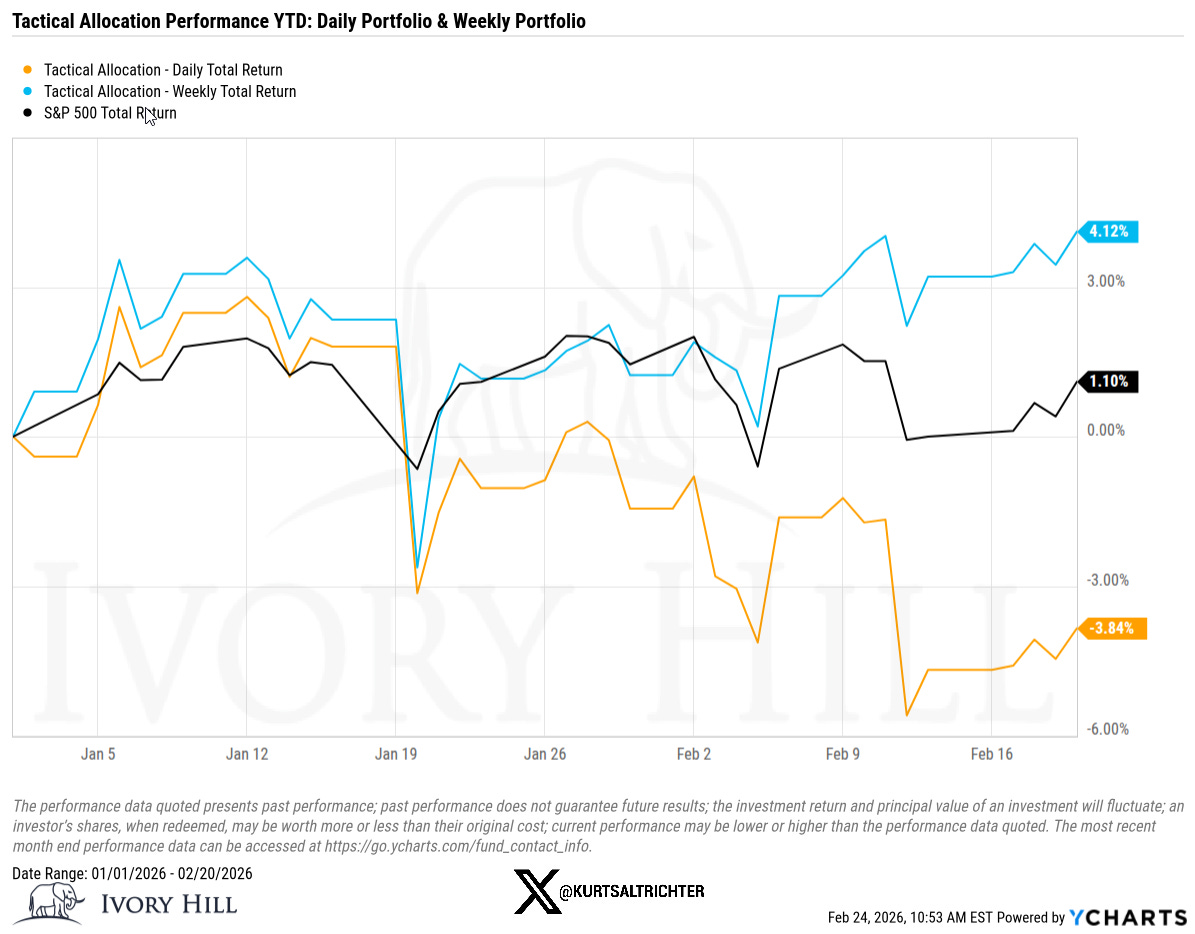
The weekly rebalance portfolio continues to outperform meaningfully. In a market that has been straddling the gamma flip line on a near-daily basis, weekly rebalancing avoids the friction and whipsaw cost of chasing each regime shift in real time. The performance gap between the daily and weekly approaches is a live illustration of why regime stability matters. When signals shift multiple times in a week, daily rebalancing pays a cost each time. Weekly rebalancing holds the regime and lets the structural signal play out. This is exactly why I decided to run this model on two different timelines.
Bottom Line
This is a market where price can look stable while the structure gets tighter.
Gamma is negative, and the price is below the flip. Vol spikes hard in both directions.
Realized volatility is rising. The systematic bid from vol-control is softening.
CTAs are reducing. Trend-following flows are not a tailwind.
Breadth is holding, but fading. The one constructive signal is not getting stronger.
The model stays Neutral. If the tape earns a Risk-On reading by reclaiming 6,914, sustaining it, and allowing realized volatility to fall, the model will shift. Until then, the discipline is the edge.
The process is about alignment, not prediction.
And remember - The one fact pertaining to all conditions is that they will change.
Feel free to use me as a sounding board.
Follow me on X for more updates.
Best regards,
Schedule a call with me by clicking HERE
Kurt S. Altrichter, CRPS®
Fiduciary Advisor | President
Disclosure
The Gamma Report is published by Ivory Hill, LLC. All opinions and views expressed in this report reflect our analysis as of the date of publication and are subject to change without notice. The information contained herein is for informational and educational purposes only and should not be considered specific investment advice or a recommendation to buy or sell any security.
The data, models, and tactical allocations discussed in this report are designed to illustrate market structure and positioning trends and may differ from portfolio decisions made by Ivory Hill, LLC or its affiliates. Investing involves risk, including the possible loss of principal. Past performance is not indicative of future results.
Ivory Hill, LLC, and its members, officers, directors, and employees expressly disclaim any and all liability for actions taken based on the information contained in this report.