

Six points.
That is the entire margin between this market and a structural regime change. SPX at 6,882. Gamma flip at 6,888. Six points of separation after four consecutive weeks of failure below the line.
You know what that is? That is not progress. That is the market bleeding toward the flip without earning it. There is a difference between drifting up to resistance and reclaiming it. This tape has not reclaimed anything. It has just gotten closer to the line it keeps failing to hold.
Four weeks below the flip. Four weeks of failed recovery attempts. The bulls keep pointing at the price. The structure keeps saying no (for now).
Dealer Gamma and Market Structure
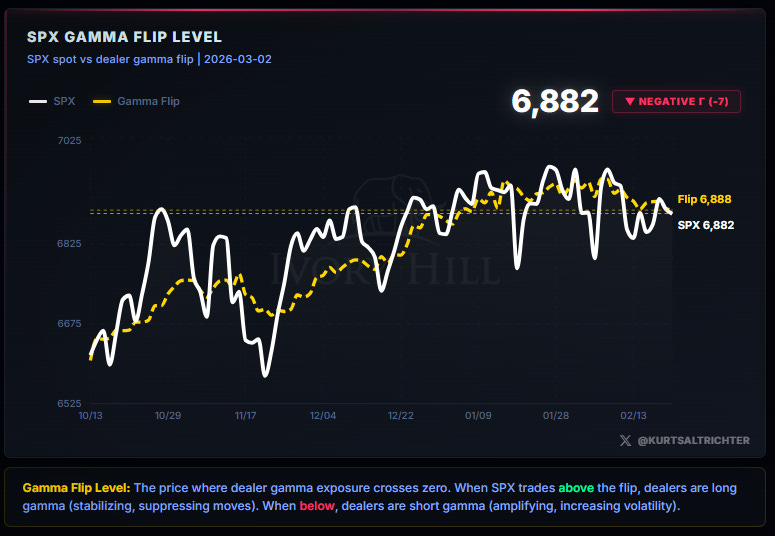
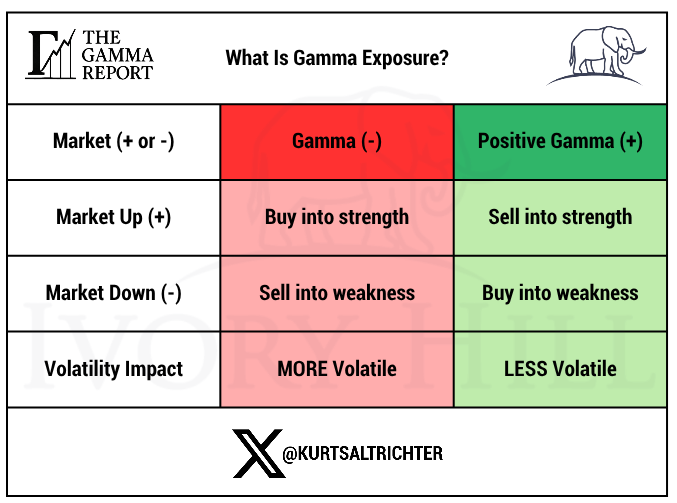
Let me be clear about what negative gamma means because people keep getting this wrong. This is not a prediction. This is not an opinion. This is mechanics. Below the flip, dealers hedge WITH price movement. Market goes down, they sell. Market goes up, they buy. They are gasoline on every move. That is why this tape feels unstable. That is why you get these fat intraday ranges and fast reversals. That is the structure doing exactly what it is supposed to do.
Now look at the futures chart. Price rejected hard off 7,015 in January. The 21-day EMA is at 6,910, sitting above the market like a ceiling. RSI is in a bearish divergence pattern that has been building for weeks. The rising trendline from the August lows and the 6,785 horizontal support are meeting directly below the current price.
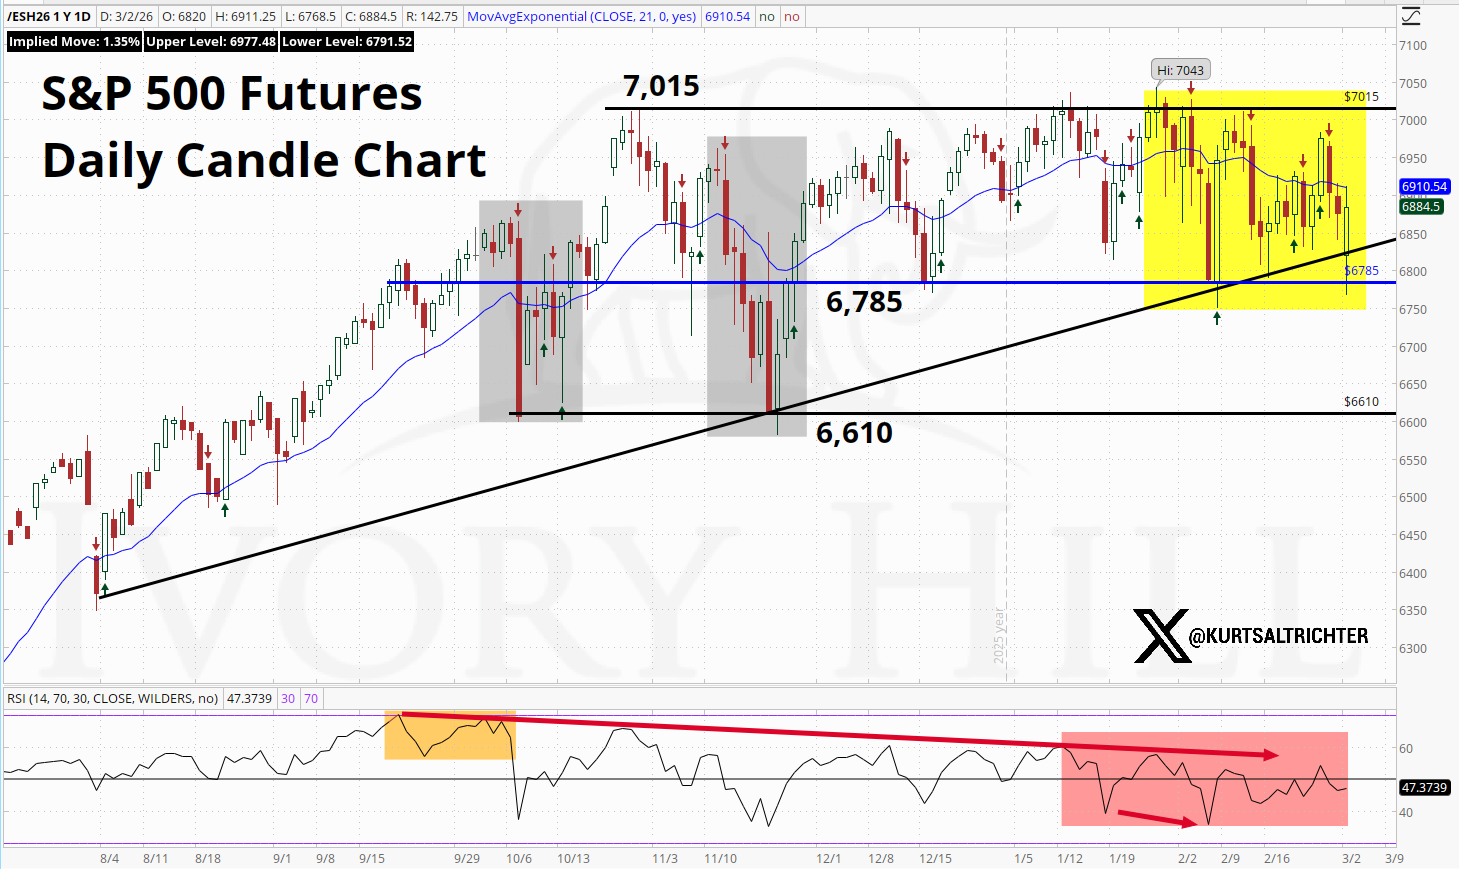
The market is coiling. That is not a bullish statement. Coils resolve. The question is which direction. Right now the weight of the evidence says the burden of proof is on the bulls. Get above 6,888 and hold it. Until then, nothing has changed.
Realized Volatility and Vol Control
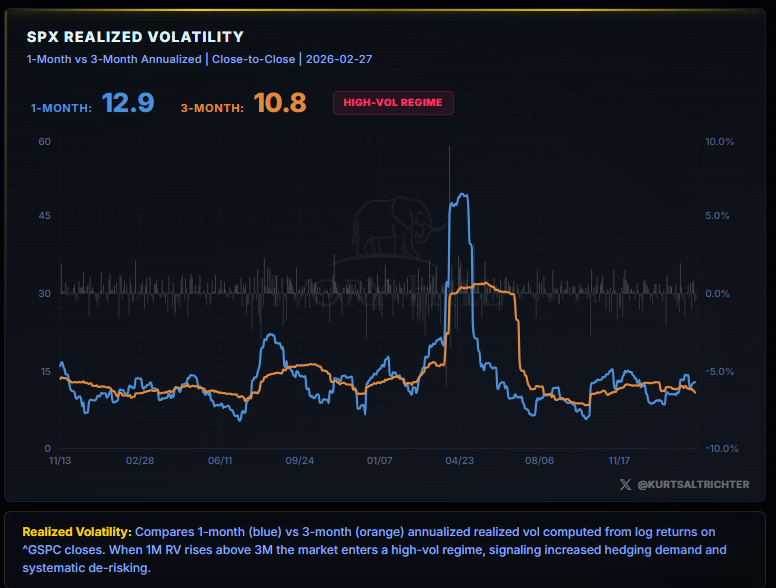
Here is what the volatility bulls are missing. It is not the level that matters. It is the direction. Last week 1M was 12.3 against 11.7. Now it is 12.9 against 10.8. The spread is widening. Every week that 1M RV creeps higher while 3M holds steady is another week that vol-control funds are mechanically reducing equity exposure. They are not reading your favorite newsletter written by influencers who don’t actually run money for a living. They are not watching the Fed speakers. They are responding to a single input: realized volatility. And realized volatility is telling them to sell.
The RV signal is still Neutral. But neutral with a worsening trajectory is not the same as neutral with a stable one. This signal is one bad week away from flipping Bearish. If it does, the flow picture gets significantly worse in a hurry.
The market needs a quiet week. It has not had one in over a month.
Flows: CTA and Vol Control
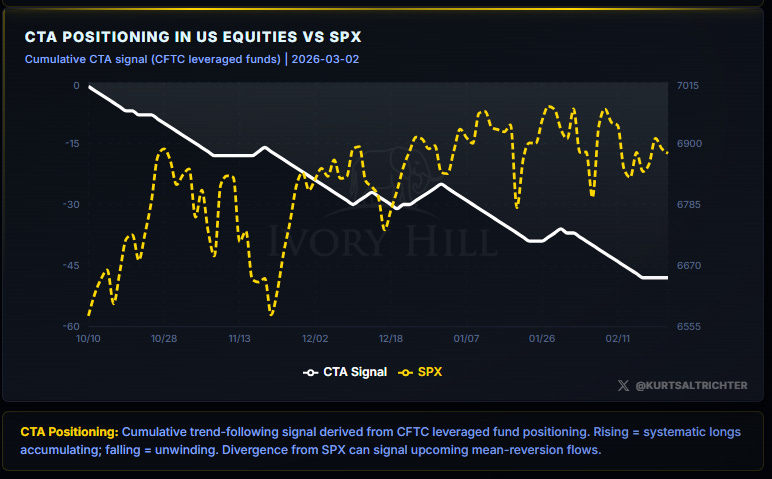
CTAs: Falling. Four consecutive weeks. This is not a fluke.
Look at that cumulative signal chart. It has been a one-way street lower since early February. Every failed attempt to hold above the flip line is another trigger for systematic selling. CTAs do not care about your fundamental thesis. They only care about the trend. The trend is down. They are selling into every bounce. Period.
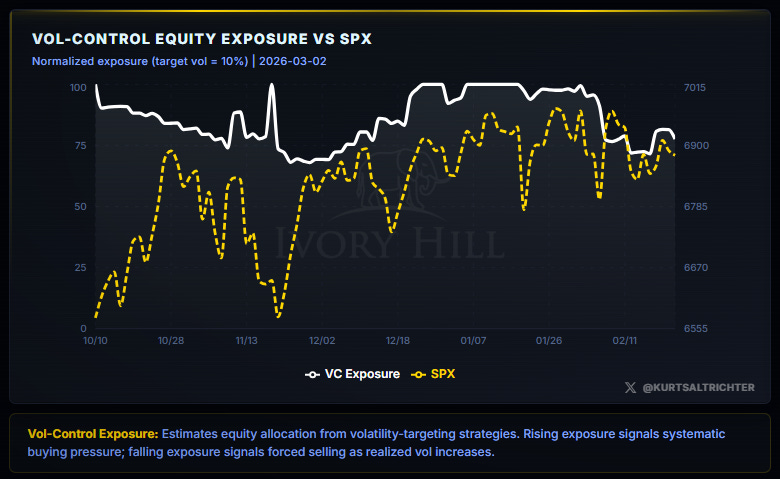
Vol-control is doing the same thing. Exposure is softening. These strategies are mechanically reducing equity exposure as realized vol rises. That is algorithmic. And it has been working against this tape for four straight weeks.
Combined flow signal: Bearish.
Any rally from here has to be carried by discretionary buyers stepping in and overpowering the systematic selling. That is a much harder lift than a tape where vol-control and CTA flows are adding exposure. You are rowing against the current. And that matters.
Breadth and Participation
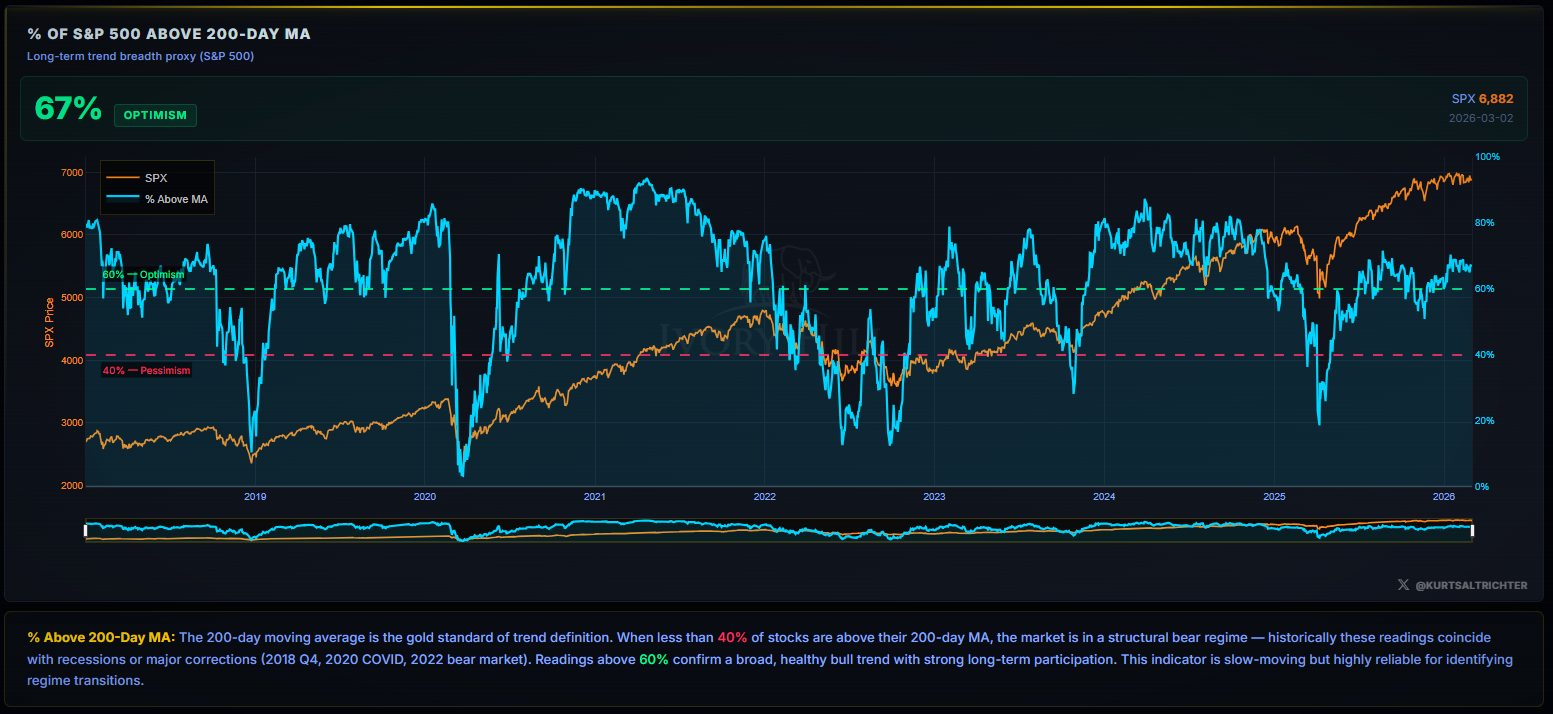
67% of S&P 500 constituents are trading above their 200-day moving average. The breadth signal is Bullish.
This is the one signal the bears cannot fully claim. Two-thirds of the index is still trading above its long-term trend line. The pullback from the January highs has been orderly, not indiscriminate. The underlying trend structure has not broken.
67% is above the 60% Optimism threshold. Readings above 60% confirm broad healthy participation in the bull trend. This is not a market where the index is being carried by five stocks while everything else rolls over. The participation is real.
But context matters. Breadth has been fading from its highs. Watch the 60% level closely. That is the line between Bullish and Neutral. If breadth slips below 60%, the one remaining bullish signal in the model loses its edge. We are not there yet. But with gamma negative, vol rising, and CTA flows bearish for four straight weeks, breadth is the only thing keeping this composite from flipping Risk-Off. And if we were risk-off, we would be getting chopped up. This is why we have multiple signals in the model.
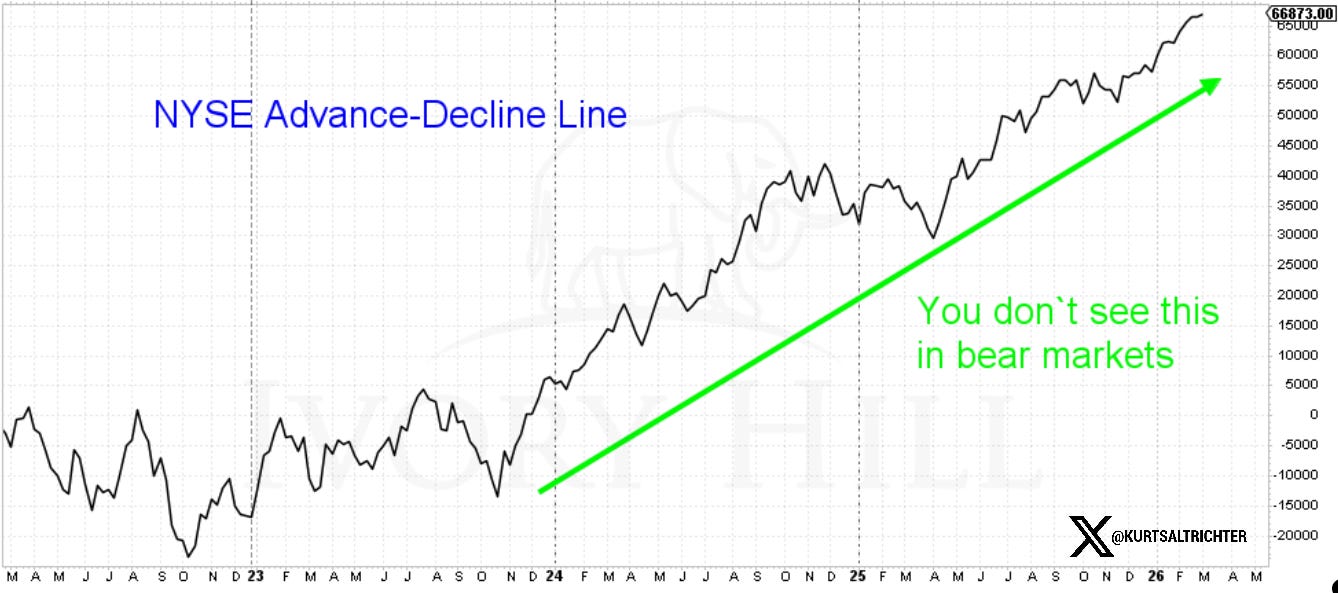
The NYSE Advance-Decline Line continues its long-term uptrend. The multi-year structure is intact. Right now, breadth is the floor. Do not take it for granted.
Composite Signal and Regime
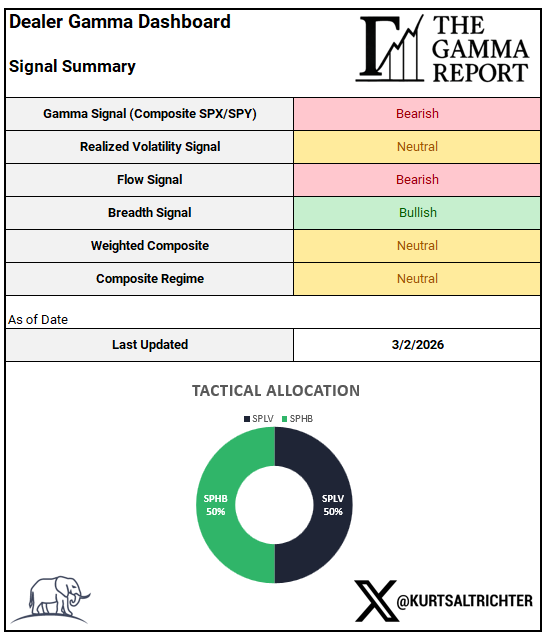
Two Bearish. Two Neutral. Composite: Neutral. Regime: Neutral.
Four weeks at Neutral. That is the model doing its job. This is not a broken market. It is a structurally impaired one. There is a difference. Broken markets make new lows every week. Impaired markets chop, frustrate, and eventually force a decision.
That decision is coming. The compression cannot last forever.
Tactical Allocation
Model stays Neutral:
50% SPLV
50% SPHB
This is the right posture for a market that has not earned a directional bet in either direction. SPLV is the anchor if this thing breaks lower. SPHB participates if the bulls finally reclaim the flip and hold it.
The flip to Risk-On requires three things. SPX above 6,888 and holding. Realized vol flattening or declining. Breadth stabilizing above 50%. None of those three conditions is currently met. SPX is 6 points away from the first one. Being close is not the same as being there.
The flip to Risk-Off requires breadth breaking below 50%, the RV signal going Bearish, and price failing 6,785. Not there yet either.
Stay balanced. Do not force it.
Performance
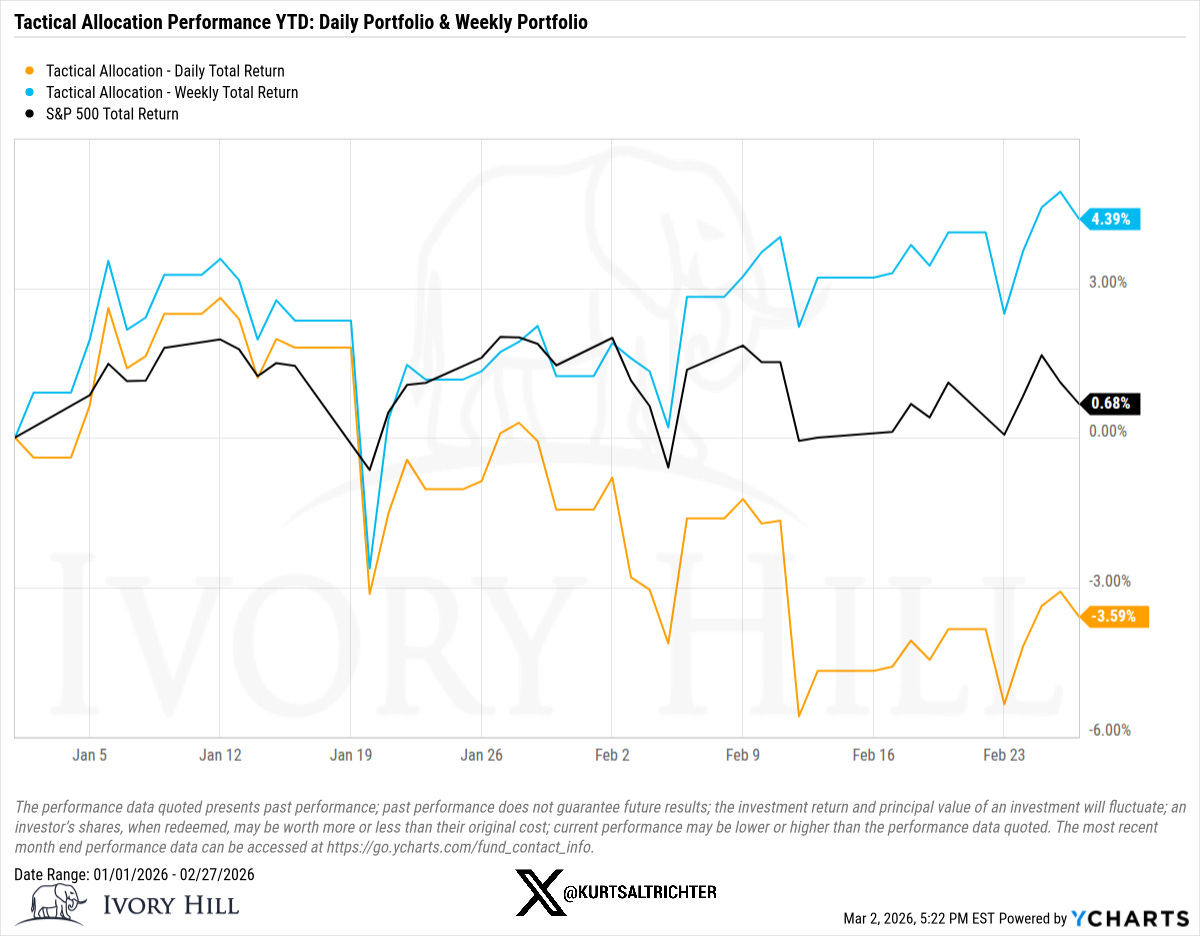
Tactical Allocation: Weekly Rebalance: +4.12% YTD
Tactical Allocation: Daily Rebalance: -3.59%
S&P 500 Total Return: +1.10% YTD
Three hundred basis points of outperformance in a market that has been grinding sideways and whipsawing daily. That gap exists because the weekly rebalance does not chase every intraday regime flip. It holds the signal and lets the structure work. Discipline over activity. Every time.
Past performance is not indicative of future results.
Bottom Line
Six points below the gamma flip. Fourth consecutive week below it. The tape is drifting toward the line it has failed to hold three times already.
Here is what the data says right now:
Gamma is negative. Every move gets amplified, not suppressed.
Realized vol is rising. The spread between 1M and 3M is widening.
CTA flows are bearish for the fourth consecutive week. Systematic selling is not done.
Breadth is Bullish at 67% above 200DMA and holding the 60% Optimism threshold, but it is the only bullish signal left in the model. If it fades, the composite shifts.
The model is Neutral. The allocation is 50% SPLV, 50% SPHB.
Close above 6,888 and hold it. That is the only thing that changes the structural picture. A failure there and a break of 6,785 opens the door to 6,610 in a hurry. This market is not broken. But the model is putting it on notice.
And remember - The one fact pertaining to all conditions is that they will change.
Feel free to use me as a sounding board.
Follow me on X for more updates.
Best regards,
Schedule a call with me by clicking HERE
Kurt S. Altrichter, CRPS®
Fiduciary Advisor | President
Disclosure
The Gamma Report is published by Ivory Hill, LLC. All opinions and views expressed in this report reflect our analysis as of the date of publication and are subject to change without notice. The information contained herein is for informational and educational purposes only and should not be considered specific investment advice or a recommendation to buy or sell any security.
The data, models, and tactical allocations discussed in this report are designed to illustrate market structure and positioning trends and may differ from portfolio decisions made by Ivory Hill, LLC or its affiliates. Investing involves risk, including the possible loss of principal. Past performance is not indicative of future results.
Ivory Hill, LLC, and its members, officers, directors, and employees expressly disclaim any and all liability for actions taken based on the information contained in this report.