

The S&P 500 has been below the gamma flip line for nine weeks. Risk-Off. Same allocation as last week.
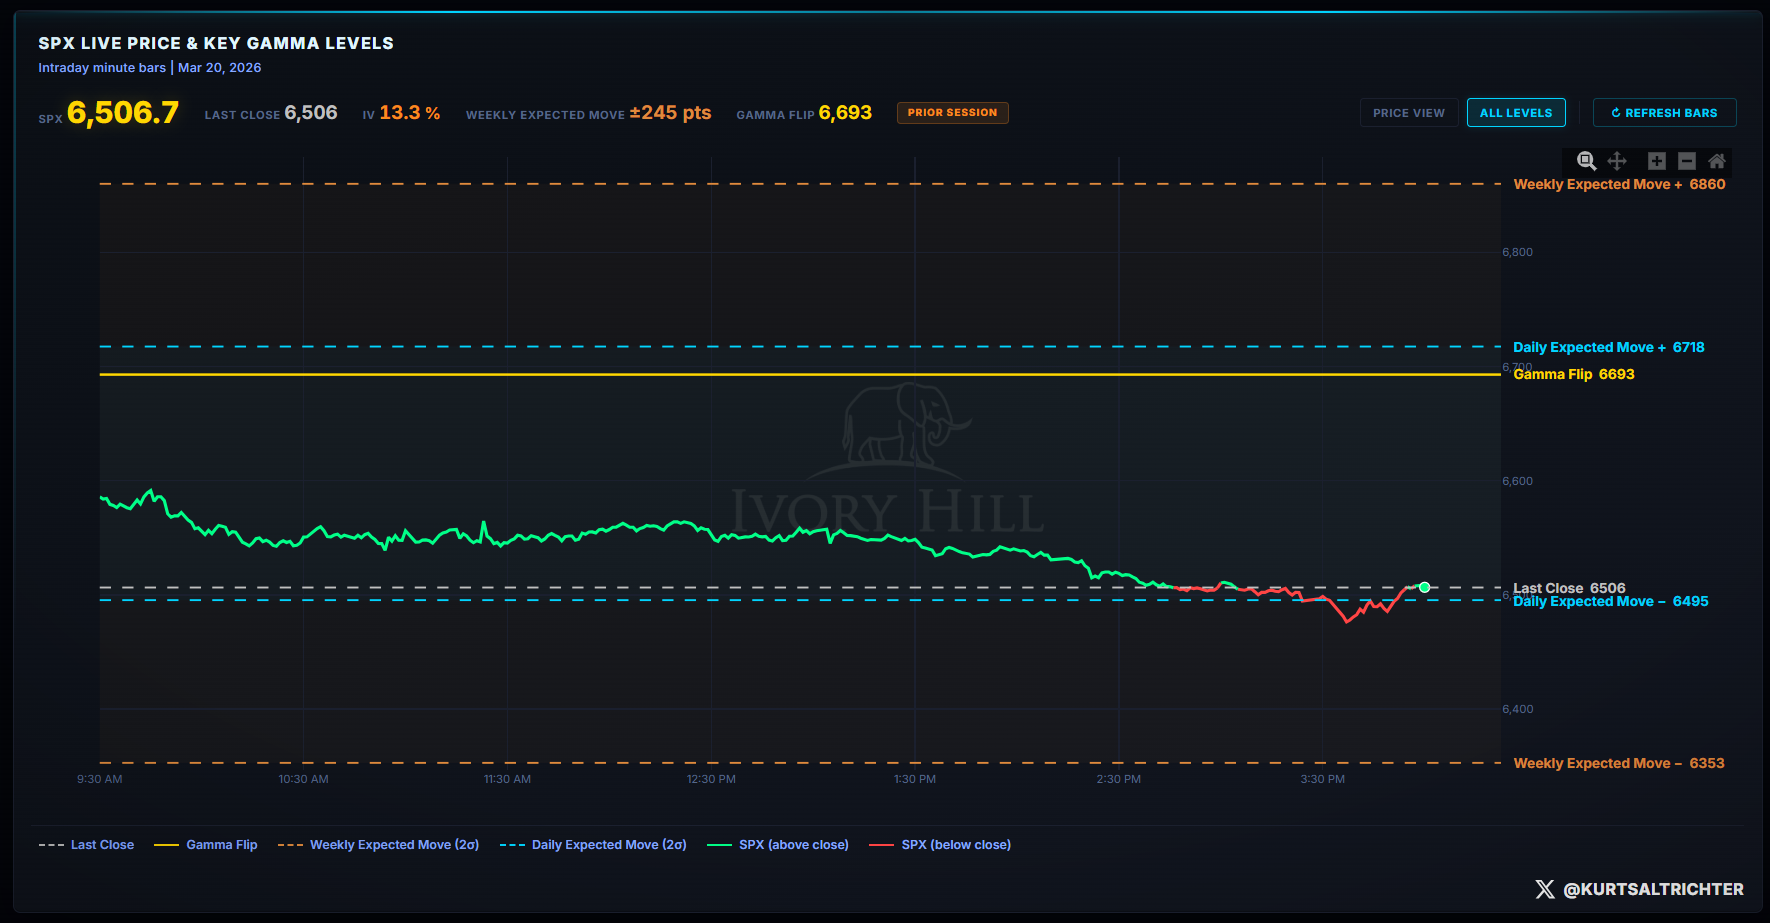
The S&P 500 dropped another 126 points last week. Closed Friday at 6,506. The flip line is at 6,693. That is 187 points between here and a market that starts behaving itself. Three weeks ago, the distance was 116. It is not getting smaller.
Breadth is at 45%. Five points from structural bear market territory. Conditions are not improving at all.
What the Market Is Pricing This Week?
Three high-impact events this week. Consumer Confidence Tuesday. GDP Q4 Final Estimate Thursday. PCE Price Index Friday.
The options market is already pricing in the risk. Expected move by Thursday’s expiration is ±2.83%. Put/call ratios sit above 1.0 all week, meaning the hedging crowd is larger than the betting-on-a-rally crowd into every major print. SPX IV steps up from 19.06 Monday to 24.20 by Thursday as each event adds another layer of uncertainty.
Consumer Confidence lands Tuesday with a ±2.07% expected move. In a negative gamma environment, a bad number does not get absorbed quietly. It gets amplified.
GDP Q4 Final and PCE close the week back-to-back. These are the two data points the Fed watches most closely right now. The market knows it. That is why implied vol keeps climbing as the week goes on.
Here is the plain version: the market is already nervous. Dealers are set up to make big moves bigger. And this week hands the market three separate chances to spook itself. And Iran isn’t even on the calendar. You do not need to predict which way it goes. You need to know the moves will be larger than they normally would be.

Dealer Gamma and Market Structure
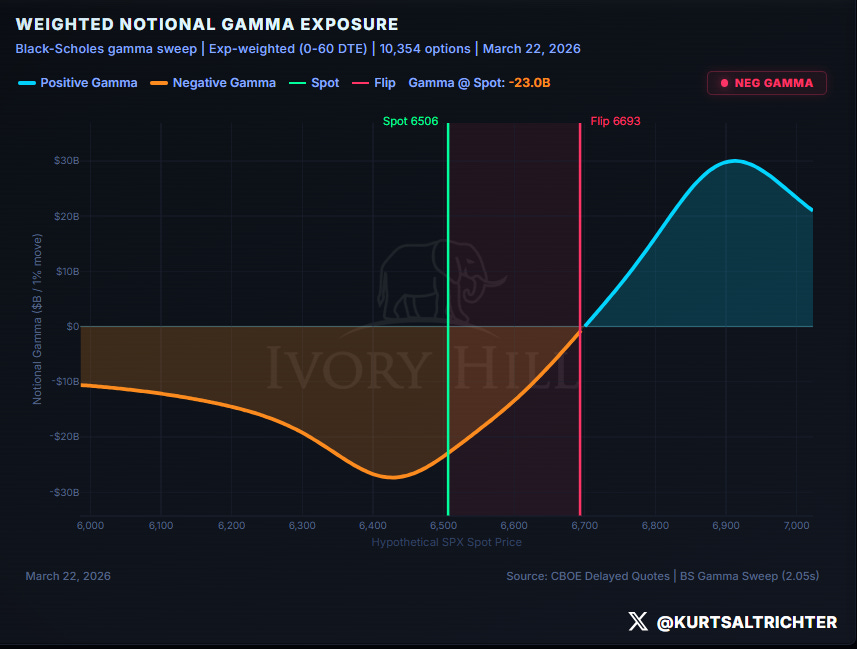
Every point between here and the flip line is negative gamma. Dealers are feeding volatility right now.

When the price drops, they sell. When it bounces, they buy into it. Both directions get amplified. That is not sentiment. That is the mechanical reality of sitting 187 points below the flip line in a market with $23 billion of negative gamma at the current price.
The weekly expected move is 6,860 upper, 6,353 lower. The S&P 500 closed near the bottom of that range. Getting back above 6,693 and holding it requires a lot of buyers with a lot of discretionary capital to bid against months of systematic computer selling. That has not materialized and is highly unlikely at this point in time.
The flip line itself continues to drift lower as open interest repositions. The target is moving. Reclaiming it requires a price to recover and the options structure that sets it to move at the same time.
Realized Volatility
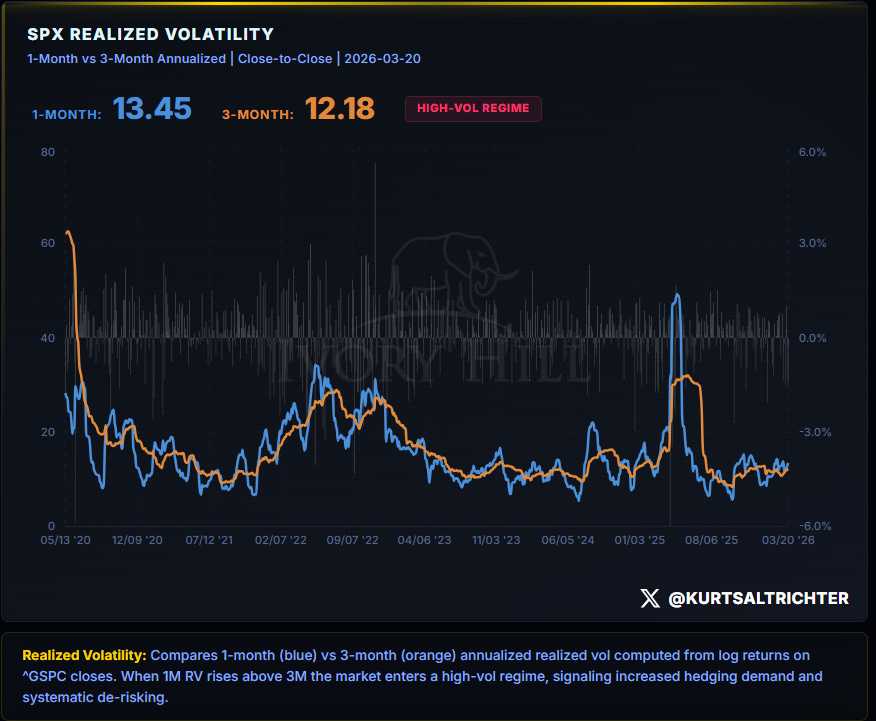
The spread between short and long-dated realized volatility was 0.7 last week. Now it is 1.27. The one week of narrowing did not hold. Vol-control funds do not rebuild equity exposure until the 1-month falls back below the 3-month and stays there. That has not happened. The mechanical selling is still running on the kitchen floor.
Flows
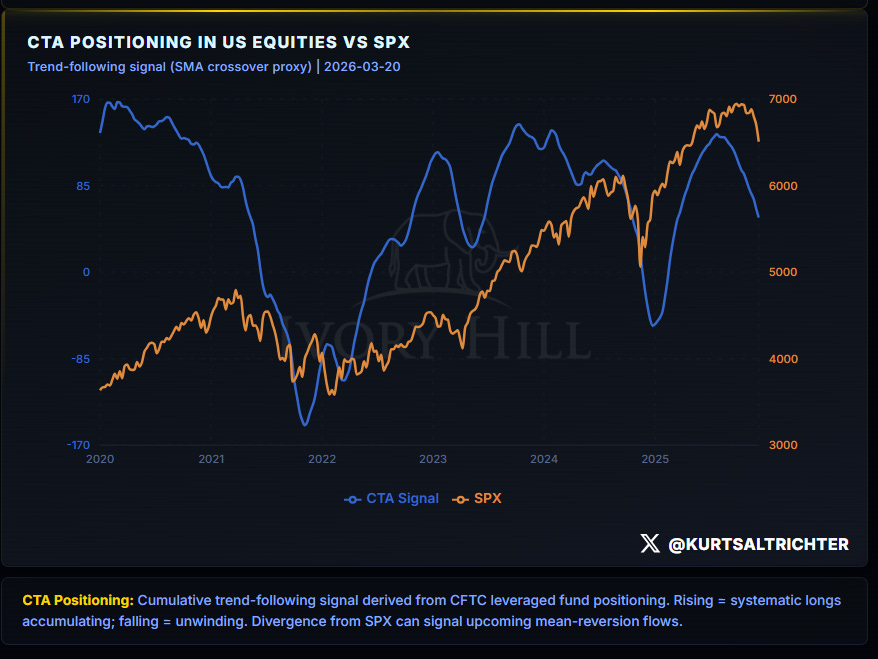
CTA trend: Falling. Vol-control trend: Falling. Flow Signal: Bearish.
The week prior, CTAs slowed down enough to move the flow signal from Bearish to Neutral. Last week they went right back to Bearish. The pause did not produce a bid. It produced a head fake.
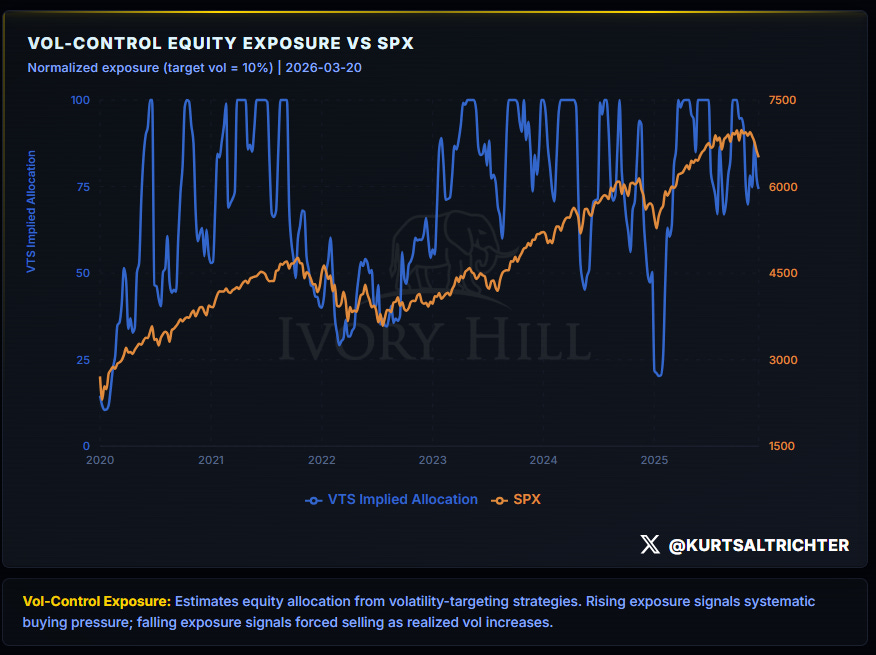
Vol-control funds are doing what they always do when realized vol is elevated: selling!
They do not care about the narrative or your feelings. They respond to the math. The math says sell.
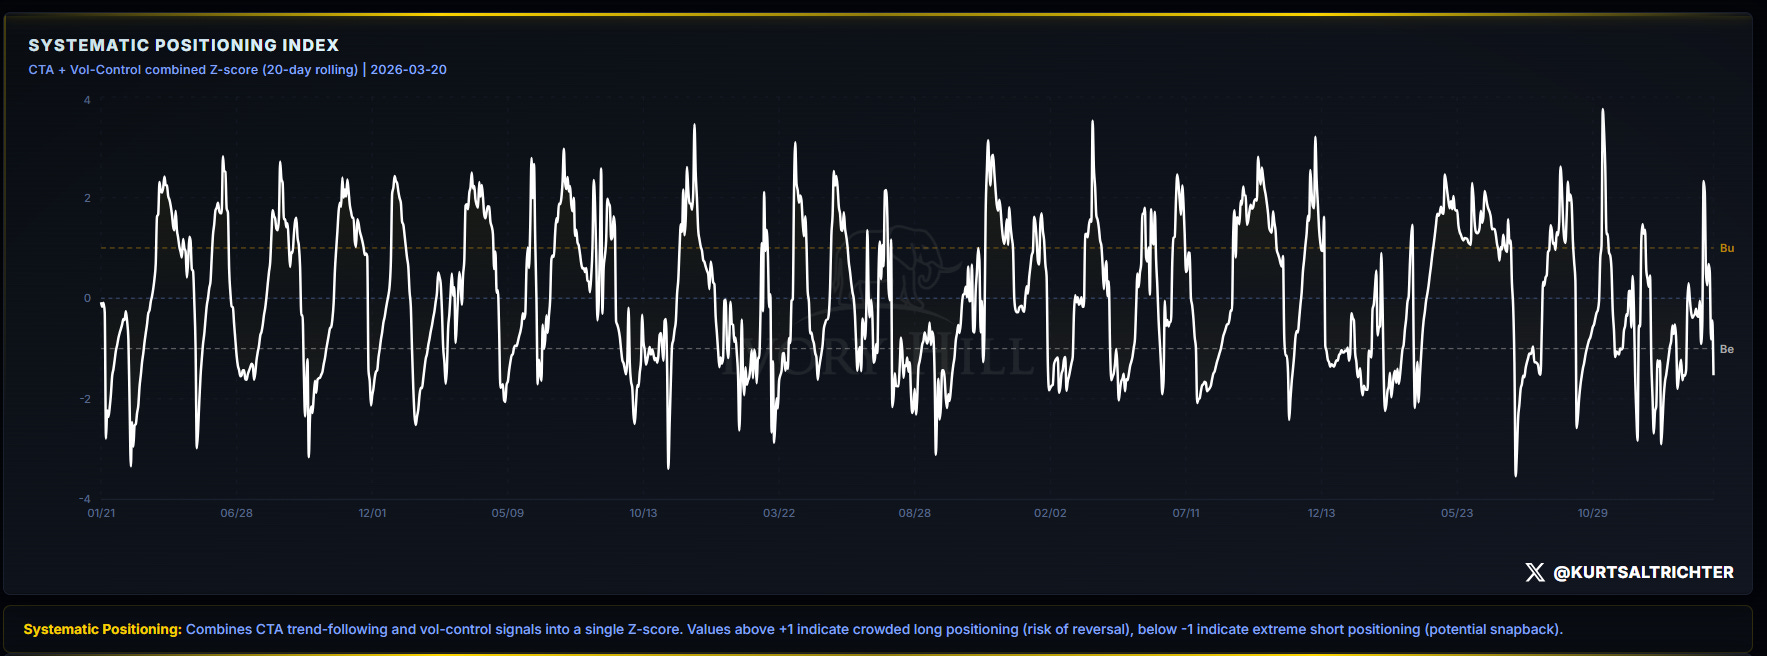
The combined Z-score is still negative. Short-side crowding is building. That is not a reason to buy today. It is a reason to know that when this turns, it turns fast.
Breadth and Participation
45% of S&P 500 stocks are above their 200-day moving average. Breadth Signal: Bearish.
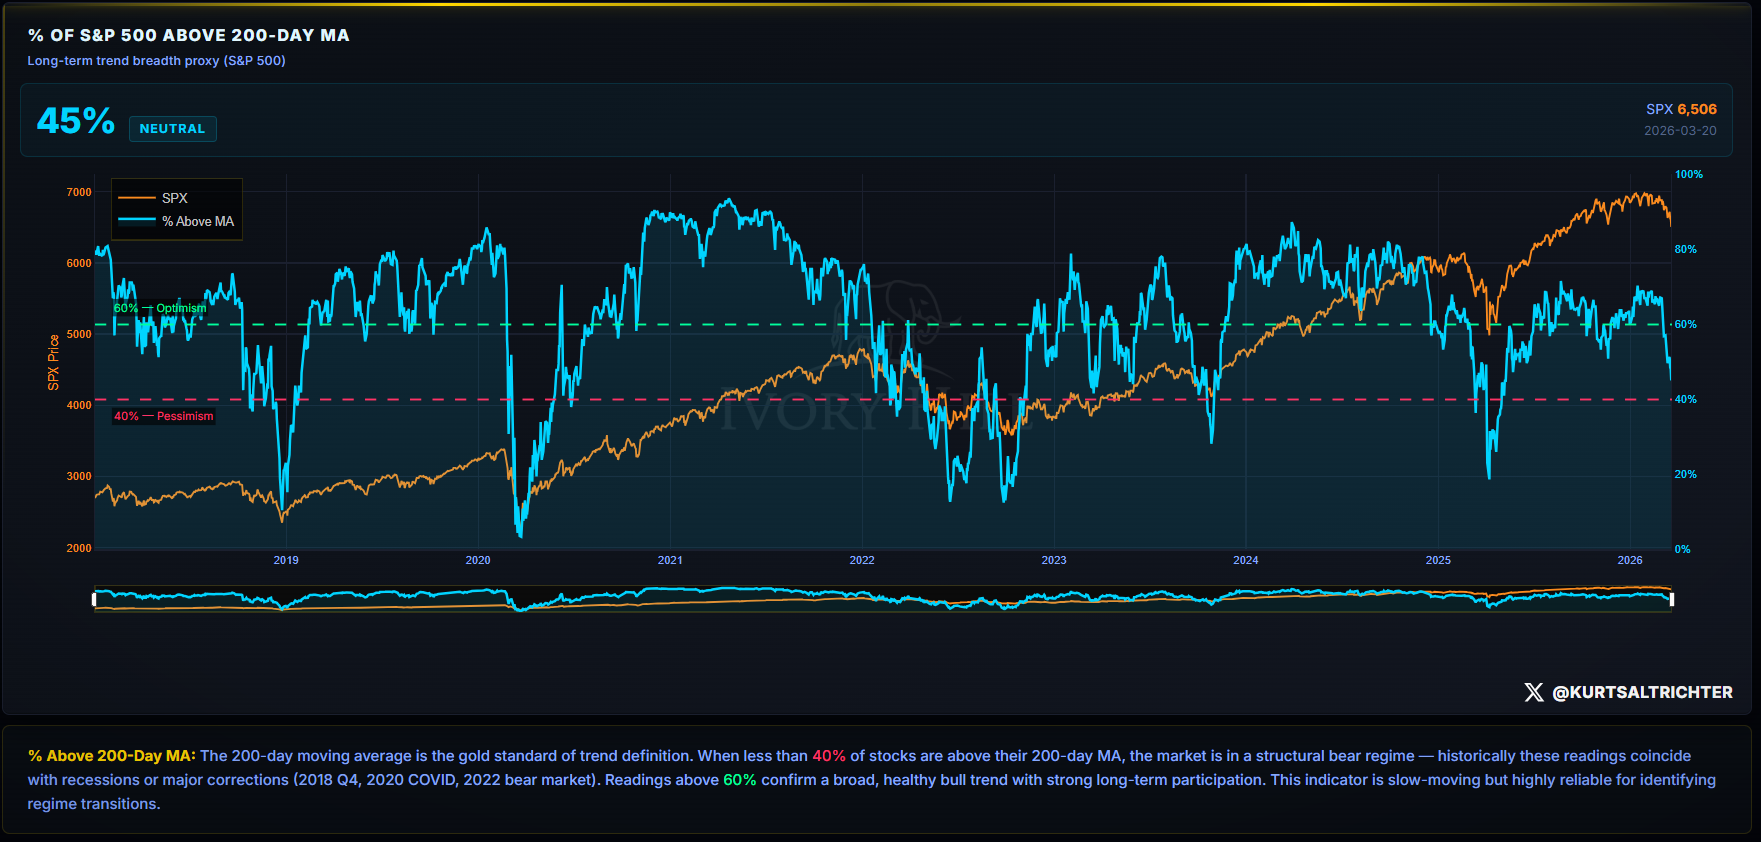
Six weeks ago, breadth was 68%. It has fallen every week since. Three weeks ago, 57.6%. Two weeks ago, 49.8%. Last week, 45.1%. Twelve and a half percentage points gone in three weeks. This is not a rotation. This is breadth deterioration.
The 40% level is where bear markets live. Recessions. Major market corrections. 2018. 2020. 2022. Five points away.
Composite Signal and Regime
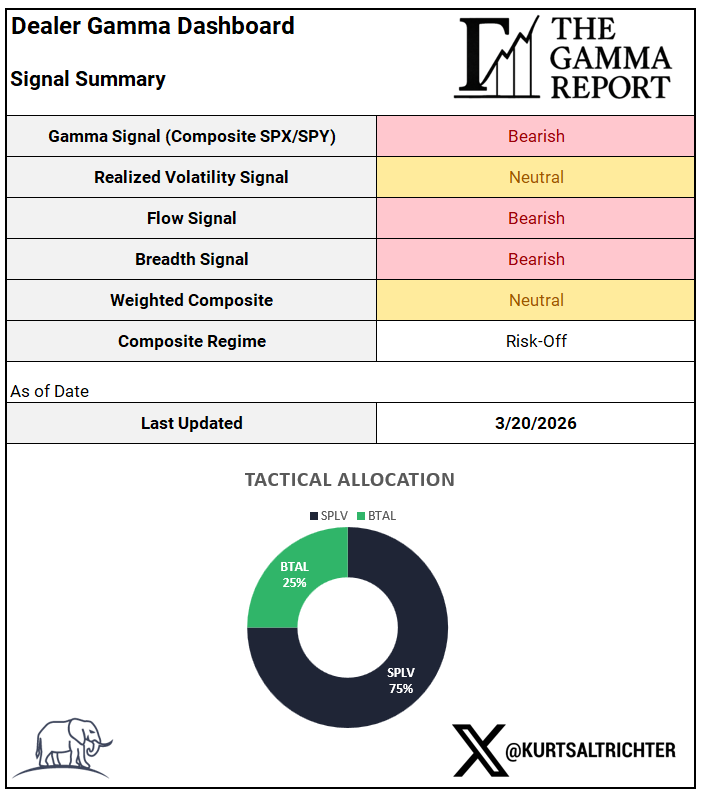
Gamma: Bearish. Realized Volatility: Neutral. Flows: Bearish. Breadth: Bearish. Weighted Composite: Neutral. Regime: Risk-Off.
Three Bearish. One Neutral. Zero Bullish. Third consecutive week of Risk-Off.
Three things change the allocation. The S&P 500 reclaims 6,693 and holds it. Realized volatility flattens and 1-month falls back below 3-month. Breadth recovers above 60%. Zero out of three right now. Not trending toward any of them.
Performance
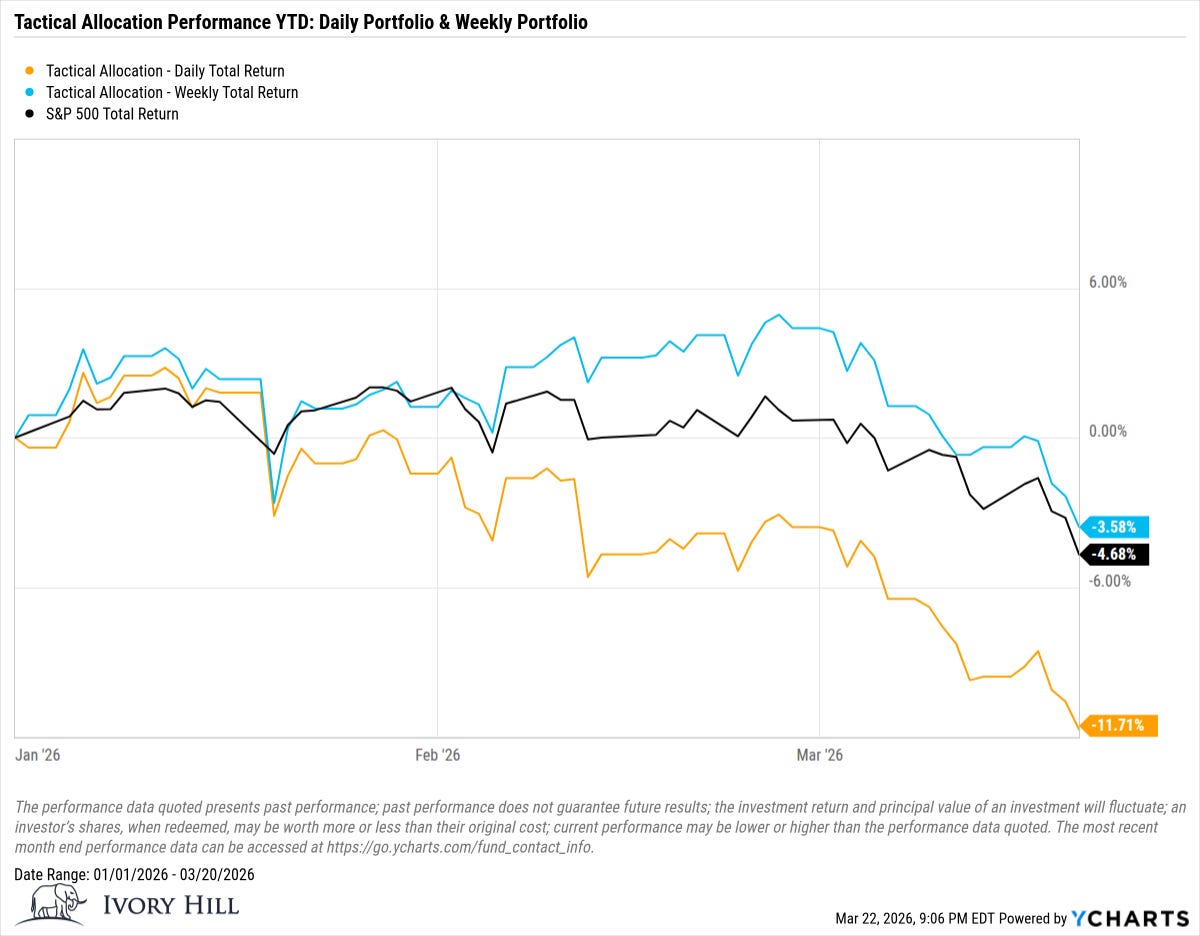
Weekly rebalance: -3.58% YTD. S&P 500: -4.68%. Daily rebalance: -11.71%.
The daily portfolio got chopped up by the intraday noise. The weekly portfolio was updated once a week (on Fridays) when the signal was clear, and avoided most of it. That difference is the whole point of the process.
Down 3.58% while the index is down 4.68% in one of the most volatile starts to a year in recent memory. The posture is working.
A note on performance: this model is fully invested at all times. That is by design. The goal is not to beat the index; it is to stay aligned with market structure and manage equity beta exposure accordingly. The ETF constraints are not how this works in practice. That is something I have learned building this process in real time. A raw return comparison does not capture that. Going forward, the performance visual will evolve into something that better reflects what the model is actually telling you about equity risk in the current regime. I’ll keep posting it until that project is done.
Bottom Line
187 points below the flip. Three Bearish signals. Breadth five points from structural bear market territory. Realized vol widened again. Flows back to Bearish after one week of false hope.
Nothing has changed for the better, but conditions have gotten worse.
And remember - The one fact pertaining to all conditions is that they will change.
Feel free to use me as a sounding board.
Follow me on X for more updates.
Best regards,
Schedule a call with me by clicking HERE
Kurt S. Altrichter, CRPS®
Wealth Advisor | President
Disclosure
The Gamma Report is published by Ivory Hill, LLC. All opinions and views expressed in this report reflect our analysis as of the date of publication and are subject to change without notice. The information contained herein is for informational and educational purposes only and should not be considered specific investment advice or a recommendation to buy or sell any security.
The data, models, and tactical allocations discussed in this report are designed to illustrate market structure and positioning trends and may differ from portfolio decisions made by Ivory Hill, LLC or its affiliates. Investing involves risk, including the possible loss of principal. Past performance is not indicative of future results.
Ivory Hill, LLC, and its members, officers, directors, and employees expressly disclaim any and all liability for actions taken based on the information contained in this report.