

The floor gave way.
Last week breadth was the one thing keeping this model out of Risk-Off. 67% of S&P 500 stocks above their 200-day MA.
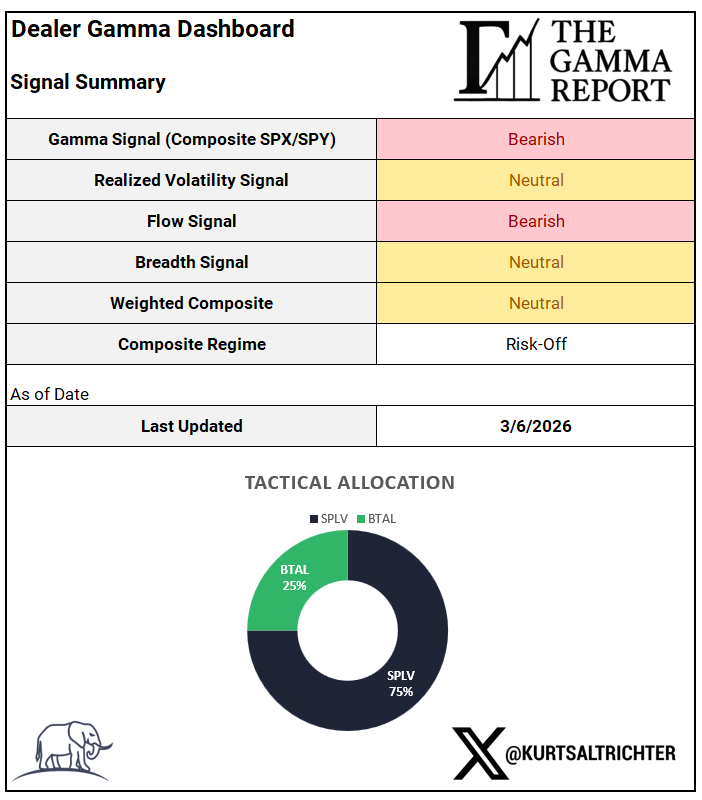
This week it dropped to 57%. Below the 60% threshold. Breadth flipped from Bullish to Neutral. The model flipped to Risk-Off. First time in 2026.
Two Bearish signals. Two Neutral. Zero Bullish. That is where we are.
Dealer Gamma and Market Structure
SPX is at 6,702. The gamma flip is at 6,859. That is 157 points of separation.
Six weeks ago, it was six points. Then 69. Now 157. The bulls are not just failing to reclaim the flip. They are getting dragged away from it.
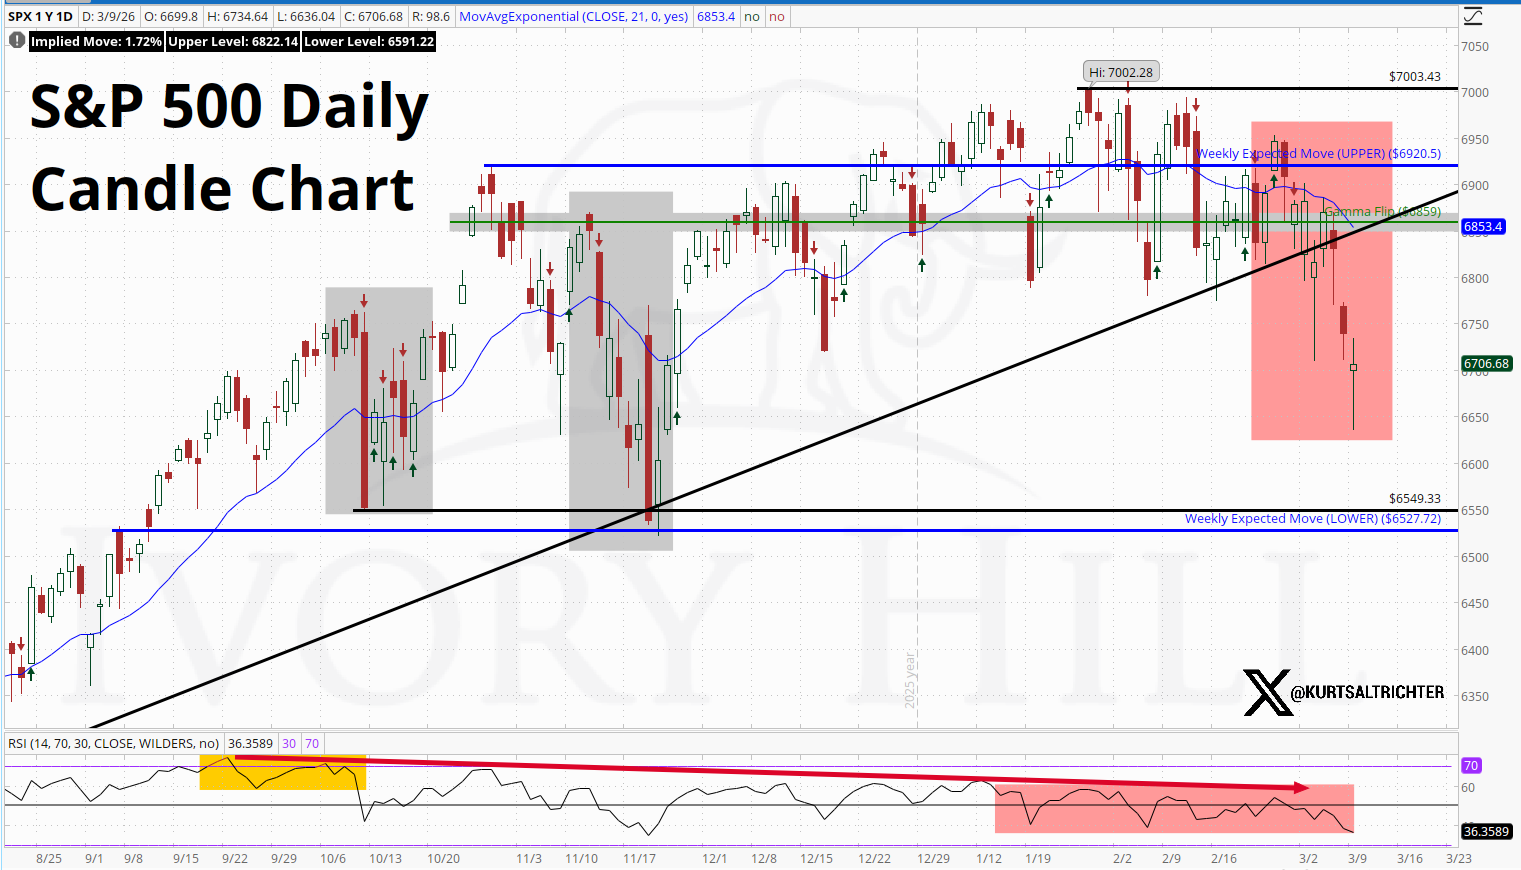
The rising trendline from the August lows is broken. The bearish RSI divergence that was building for weeks has just been confirmed. There is no nearby technical support that means anything right now.
The gap has widened every week. The bulls have not just failed to reclaim the flip. They have lost ground. The tape has moved from drifting below the line to getting dragged away from it.
Look at the chart. The 21-day EMA is at 6,853. That is a ceiling, not a floor. RSI sits at 36.36. That is not oversold. That is a deteriorating market printing lower lows on momentum. The bearish RSI divergence that was building for weeks has now confirmed. The rising trendline from the August lows is broken. Price is in open air below multiple layers of structural support.
The weekly expected move for this week is 6,920 upper and 6,527 lower. The implied move is 1.72%. The market has room to move in either direction. But the structure says the path of least resistance is not up.
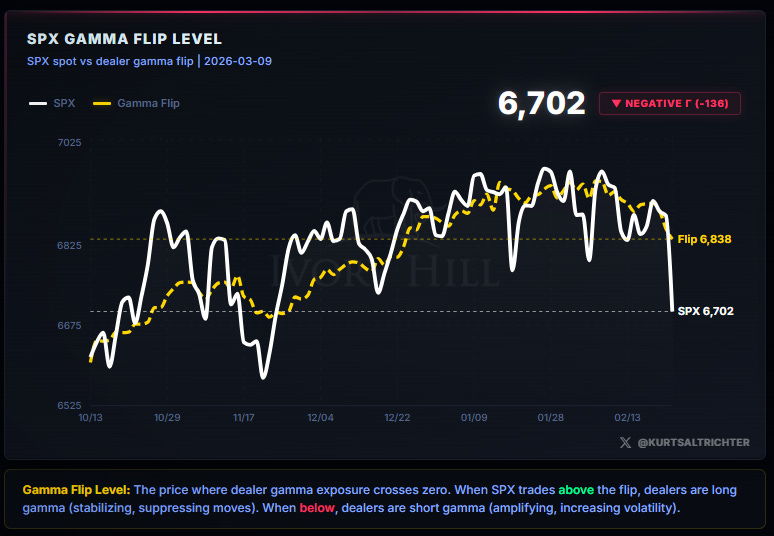
In negative gamma, dealers hedge WITH price. Market drops, they sell. Market bounces, they buy into strength. They are an accelerant on every move in both directions. That is why this tape feels unstable. That is not an opinion. That is the mechanical reality of where spot sits relative to the flip.
Getting back to the flip line from here is not a one-day trade. It requires a sustained multi-session bid from discretionary buyers. Those buyers are currently competing against a wall of systematic selling. More on that in a moment.
Realized Volatility (RV) and Vol Control
1-month RV: 13.8. 3-month RV: 11.2. Spread: 2.6 points. Five consecutive weeks of widening.
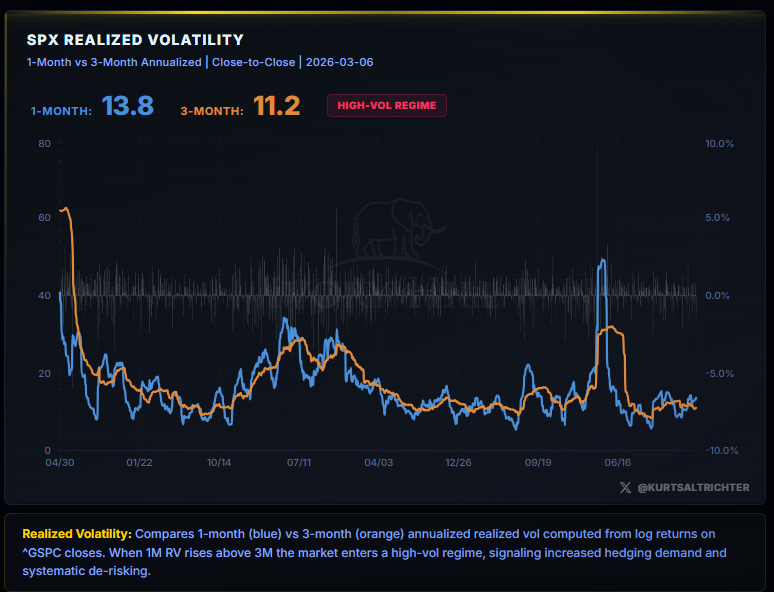
The RV signal is still technically Neutral. But the trajectory has not reversed. It has accelerated. And vol-control funds do not care about thresholds. They care about the number. The number keeps going up. They keep reducing equity exposure.
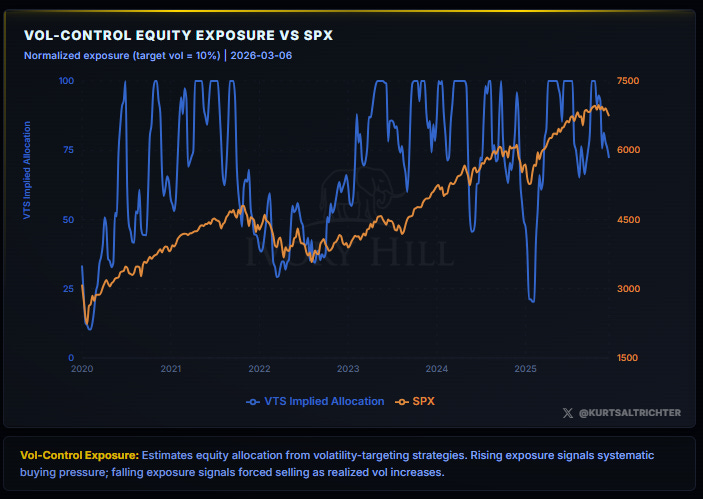
Look at the VTS implied allocation chart. Compare January to today. That decline is algorithmic. Mechanical. It does not stop until realized vol flattens. Realized vol has not flattened.
CTAs are doing the same thing.
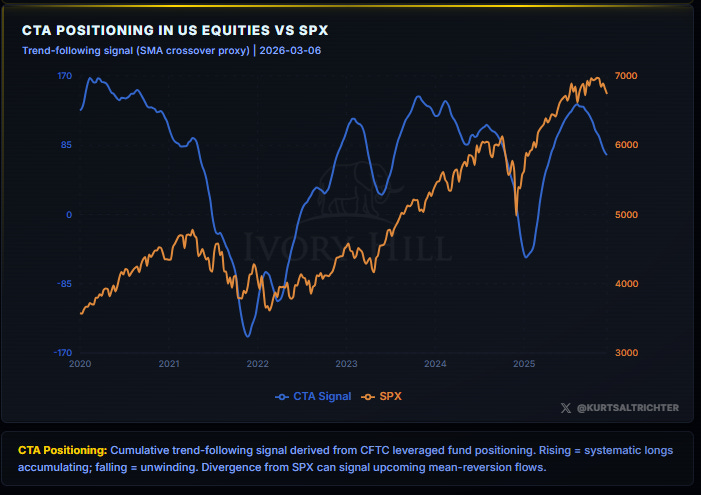
The CTA signal has been falling in a straight line since early February. Five consecutive weeks. Every failed rally below the flip triggers another round of selling.
Combined flow signal: Bearish. Still.
Any rally has to overpower this selling with discretionary buying. You are rowing against the current.
Breadth and Participation
57% of S&P 500 stocks are above their 200-day MA. Breadth Signal: Neutral.
Three weeks ago, this was 68%. Two weeks ago, 67%. Now 57%. Ten points in two weeks. That drop cost the model its only remaining bullish signal and flipped the regime.
The 50% level is the next line to watch. That is the boundary between Neutral and Bearish. You now have a 7-point buffer. Last week, you had 7 points between breadth and neutral. The week before that, it was fine. Things can move fast.
Composite Signal and Regime
First Risk-Off reading of 2026.
This is not a prediction of a crash. It is a statement about what the evidence shows right now. Two of four signals are Bearish. Neither neutral signal is trending toward Bullish. The model does not support offensive positioning.
Tactical Allocation
Risk-Off. Allocation:
75% SPLV 25% BTAL
SPLV anchors the downside. BTAL is long quality, short beta. It is built for a tape where risk appetite is deteriorating and systematic flows are a headwind. This allocation is not a zero-equity call. It is the model doing exactly what it is designed to do.
What changes it: SPX reclaims 6,838 and holds it. Realized vol flattens, and the spread starts compressing. Breadth recovers above 60%. All three need to move in the right direction. Right now, none of them are.
Performance
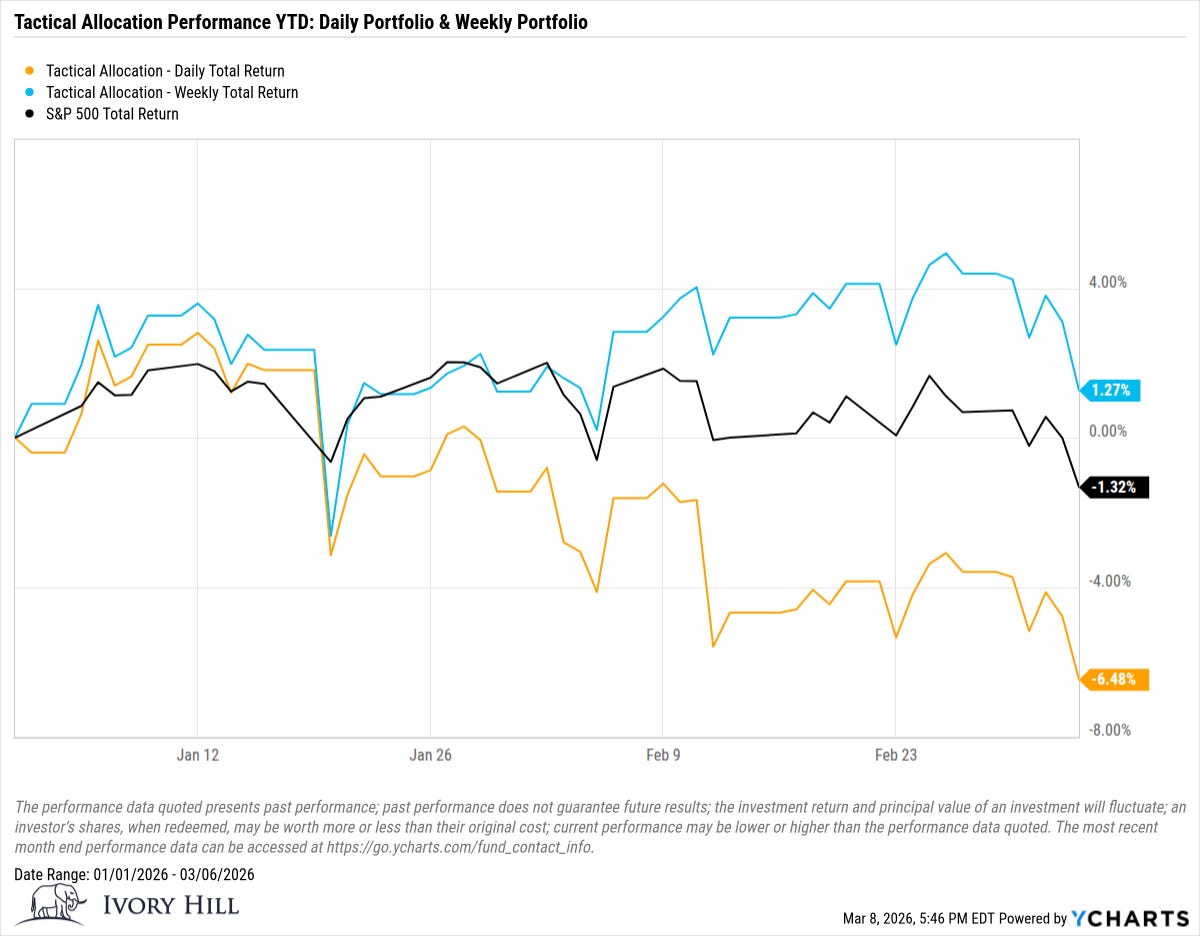
Weekly rebalance: +1.27% YTD. S&P 500 Total Return: -1.32% YTD.
While the index went negative for the year, the weekly rebalance remained positive because it maintained a defensive posture as the structure deteriorated. That is the entire point of a process-driven framework.
Discipline over activity. Every time.
Bottom Line
Risk-Off. First time in 2026. Here is what got us here.
SPX is below the gamma flip. Dealers are amplifying every move. Realized vol is in a HIGH-VOL REGIME with a widening 1M/3M spread. CTA and vol-control flows have been Bearish for five straight weeks. Breadth dropped from 67% to 57% and crossed below the Optimism threshold.
Two Bearish. Two Neutral. Composite Neutral. Regime Risk-Off. Allocation 75% SPLV / 25% BTAL.
The market is not broken. But it has earned a defensive posture. The bulls need to reclaim 6,838, flatten vol, and rebuild breadth above 60%. Until all three happen, nothing changes.
And remember - The one fact pertaining to all conditions is that they will change.
Feel free to use me as a sounding board.
Follow me on X for more updates.
Best regards,
Schedule a call with me by clicking HERE
Kurt S. Altrichter, CRPS®
Fiduciary Advisor | President
Disclosure
The Gamma Report is published by Ivory Hill, LLC. All opinions and views expressed in this report reflect our analysis as of the date of publication and are subject to change without notice. The information contained herein is for informational and educational purposes only and should not be considered specific investment advice or a recommendation to buy or sell any security.
The data, models, and tactical allocations discussed in this report are designed to illustrate market structure and positioning trends and may differ from portfolio decisions made by Ivory Hill, LLC or its affiliates. Investing involves risk, including the possible loss of principal. Past performance is not indicative of future results.
Ivory Hill, LLC, and its members, officers, directors, and employees expressly disclaim any and all liability for actions taken based on the information contained in this report.