

“There is always a disposition in people’s minds to think the existing conditions will be permanent. When the market is down and dull, it is hard to make people believe that this is the prelude to a period of activity and advance. When the prices are up and the country is prosperous, it is always said that while preceding booms have not lasted, there are circumstances connected with this one, which make it unlike its predecessors and give assurance of permanency. The one fact pertaining to all conditions is that they will change.”
– Charles Dow, 1900
The S&P 500 closed the week at 6,817. The gamma flip sits at 6,783. Positive gamma territory by 63 points.
Last week, SPX was at 6,583, sitting 68 points below the flip in negative gamma. The index rallied 234 points, reclaimed the flip line mid-week, and held it through Friday’s close. That is the first sustained reclaim of positive gamma territory since February.
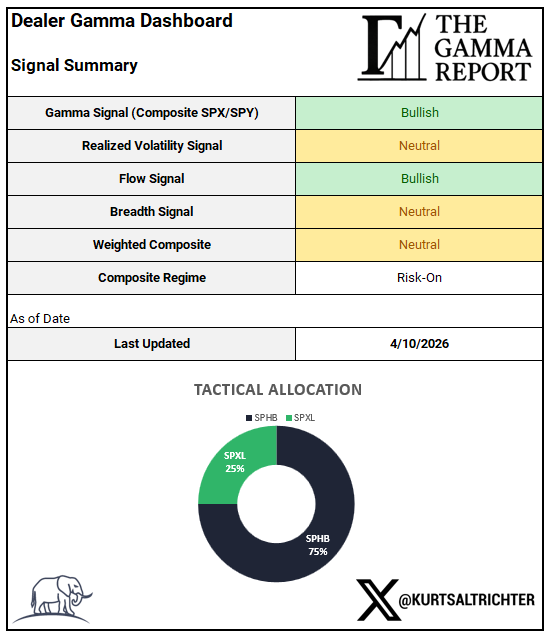
The model shifted from Risk-Off to Neutral to Risk-On last week. The allocation moved from 75% SPLV / 25% BTAL to 50% SPHB / 50% SPLV to 75% SPHB / 25% SPXL. Three of the four signals improved. That does not happen often.
Do not confuse a regime change with an all-clear. Realized volatility is still elevated. Breadth is still below the optimism threshold. The market structure has improved but it has not fully healed.
What the Market Is Pricing This Week
PPI lands Tuesday, April 14. The options market is pricing a ±1.61% expected move around that print. Put/call skew indicates that traders are paying significantly more for downside protection than for upside exposure.
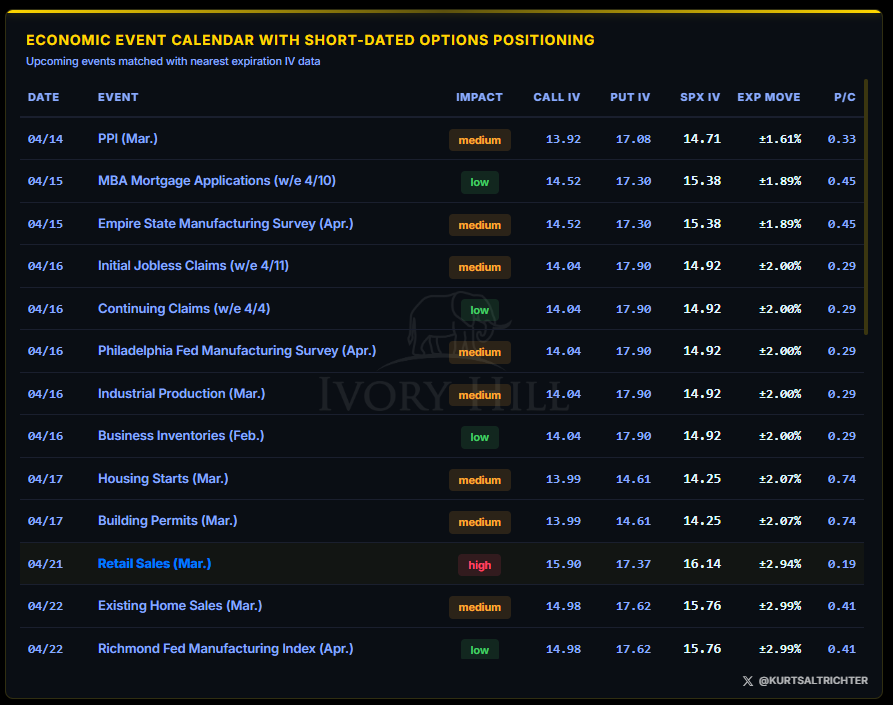
Retail Sales (March) on April 21 is the high-impact event this cycle. The market is pricing a ±2.94% expected move with a put/call ratio of 0.19. That is one of the widest expected moves on the calendar.
The rest of the week fills in around the edges. Initial Jobless Claims (April 16, ±2.00%), Philly Fed Manufacturing (April 16, ±2.00%), Housing Starts and Building Permits (April 17, ±2.07%). All medium impact. None of them individually changes the structure, but stacked together, they create multiple windows where a surprise print could move the tape.
What this means in plain language: The options market is telling you that traders expect moves of 1.5% to 3% around each of these data releases. In a calm market, expected moves around mid-tier economic data run closer to 0.5% to 1%. The premiums are elevated because realized volatility has been elevated. Traders are paying up for protection because the market has been delivering larger volatility swings than it has in the past. If you see the S&P 500 move 1-2% on a PPI print or a jobless claims number, that is not a surprise.
Dealer Gamma and Market Structure
SPX: 6,845. Gamma Flip: 6,783. Positive Gamma: +63 points.
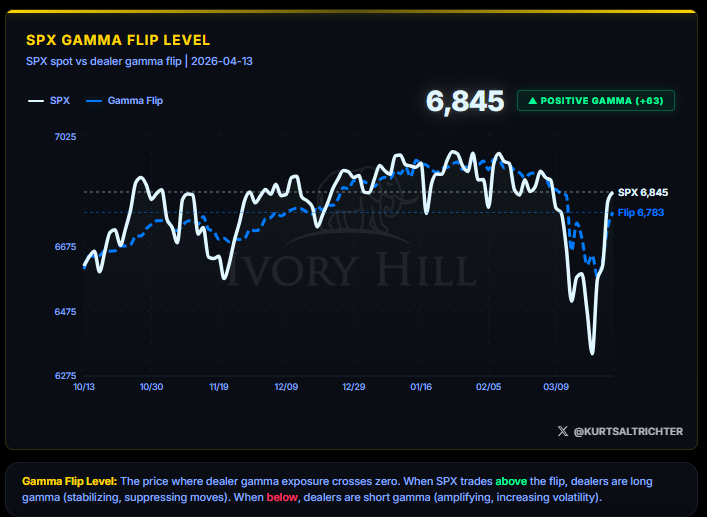
The flip was reclaimed on Wednesday, April 8. SPX jumped from 6,616 on Tuesday to 6,782, crossing above the gamma flip line at 6,677. It held above the flip through Thursday (6,824, flip at 6,730) and Friday (6,817, flip at 6,742). The flip line itself has been rising, from 6,677 on Wednesday to 6,783 as of today. This means dealer positioning is stabilizing at higher levels.
Above the flip line, dealers are long gamma. They buy dips and sell rips. That suppresses volatility. Intraday ranges get tighter. Reversals get absorbed instead of amplified.
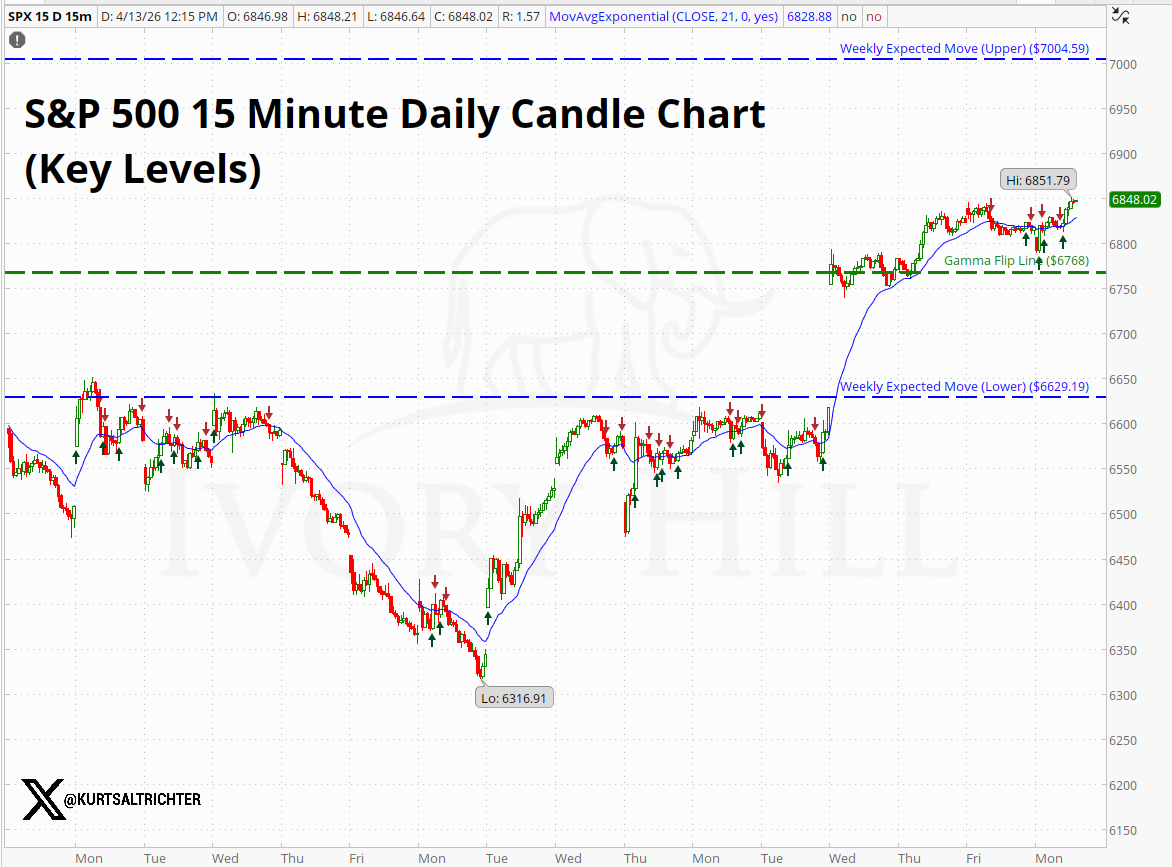
From the 15-minute chart, SPX is trading at 6,848 with a weekly expected move at 6,851.79 and a low from the prior week cycle of 6,316.91.
Key levels from the chart:
Gamma Flip: 6,783
Weekly Expected Move Upper: 7,004.59
Weekly Expected Move Lower: 6,629.19
What this means: For the past eight weeks, dealers were short gamma. That meant every drop got worse and every bounce got sold into. The market was mechanically wired to amplify volatility in both directions. That changed last week. Dealers flipped to long gamma, which means they are now working against the move instead of with it. The key number is 6,783. As long as SPX stays above that level, this stabilizing effect remains in place. If it drops back below, the volatility amplification returns.
Realized Volatility and Vol Control
1-Month RV: 19.08. 3-Month RV: 15.08. HIGH-VOL REGIME.
Short-term volatility is still running 4 points above long-term volatility. That spread has not closed. Last week it was 18.32 vs. 14.29. The 1-month number rose through the week before settling at 19.08 on today's reading. The 3-month measure moved from 14.29 to 15.08.
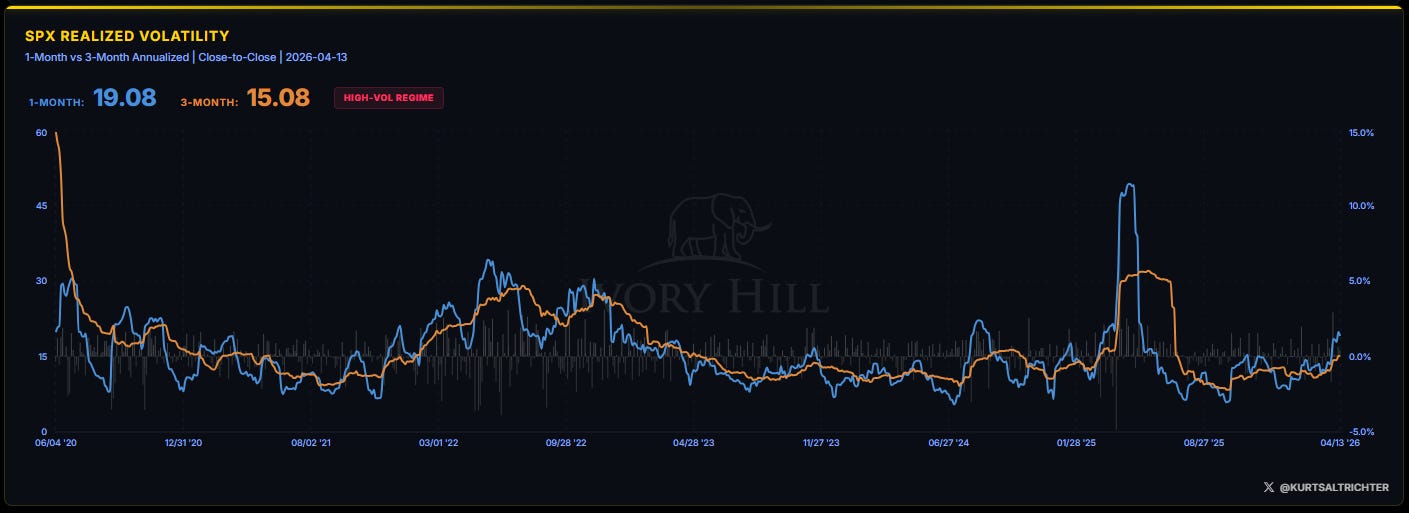
The RV signal remains Neutral. The threshold for a bearish reading has not been triggered, but the spread between short-term and long-term volatility is still wide enough to keep vol-control funds on a leash.
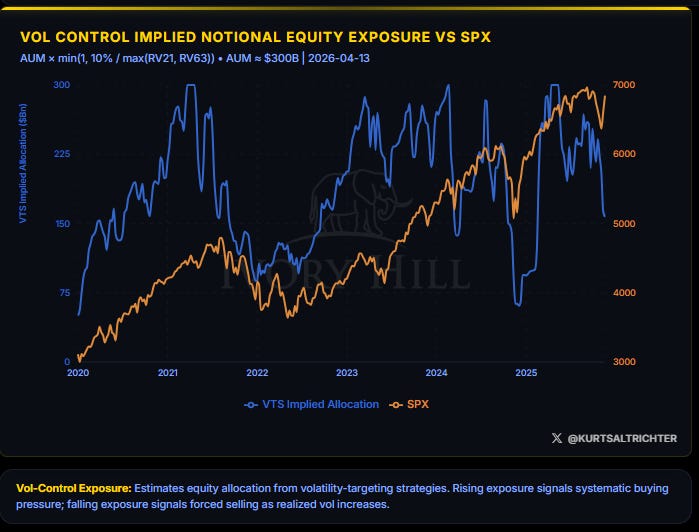
Vol-control implied notional equity exposure remains depressed. The chart shows the implied allocation sitting near $150 billion, well below the $225 billion+ levels from late 2024 and early 2025. The sharp decline that started in early 2025 has not reversed. These funds cut exposure as realized volatility spiked, and they have not added it back.
What this means: Vol-control funds are the autopilot of the stock market. They manage roughly $300 billion and make one simple decision: when the market is calm, buy more stocks; when it gets volatile, sell. For the past several months, realized volatility was rising, so these funds were selling. They took their equity exposure from over $225 billion down to roughly $150 billion. That selling has paused. The trend label flipped to Rising, which means these funds are no longer actively cutting. But the exposure level is still low. Think of it as a car that was decelerating hard and has now taken its foot off the brake. It has not hit the gas yet. The headwind is gone. The tailwind has not arrived.
Systematic Fund Flows
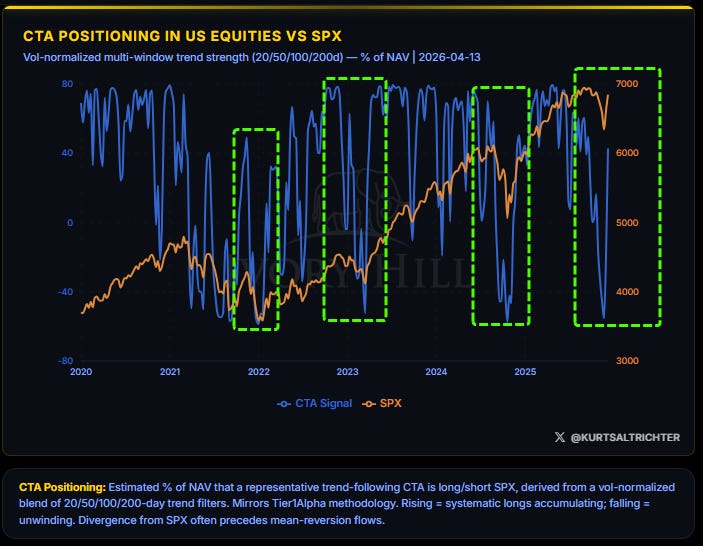
CTAs follow price trends. The trend broke in March. They sold. Now the short-term trend filters are turning positive. The CTA positioning chart shows the signal rising from deep negative territory, approaching the zero line. That is not a full reversal. It is the early stage of one. CTAs are covering short positions and beginning to add long exposure as the 20-day and 50-day trend filters turn.
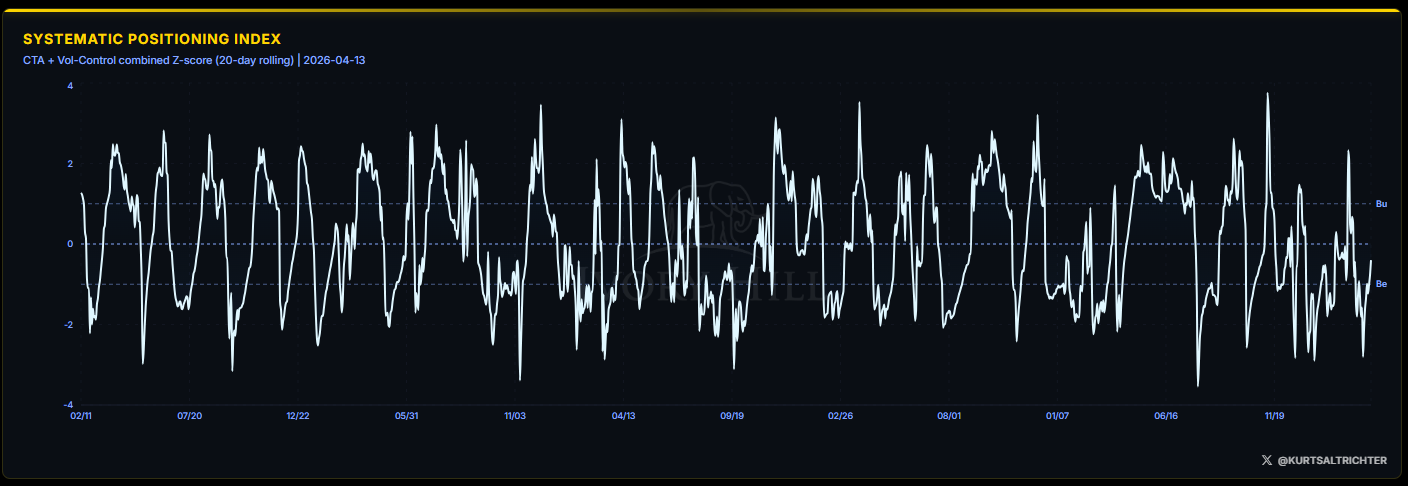
The Systematic Positioning Index sits near -1 as of today’s chart, up from approximately -2 over the past couple of weeks. That is still bearish territory, but the direction is what matters. When the index was near -2, systematic funds were near maximum short-side crowding. That crowding is now unwinding. The remaining selling pressure from these funds is thinner than it was a week ago.
What this means in plain language: There are two types of large systematic funds that move the market mechanically. Trend-following funds (CTAs) buy when prices are rising and sell when prices are falling. Volatility-targeting funds buy when the market is calm and sell when it is not. Both were selling aggressively through March and into early April. Both have now reversed or paused direction. They are not yet fully positioned on the long side. Think of it as a fire hose spraying selling pressure on the market. The hose has been turned off. It has not yet been pointed in the other direction with full force, but the selling is done for now. Any rally from here is likely supported by CTA flows going forward.
Breadth and Participation
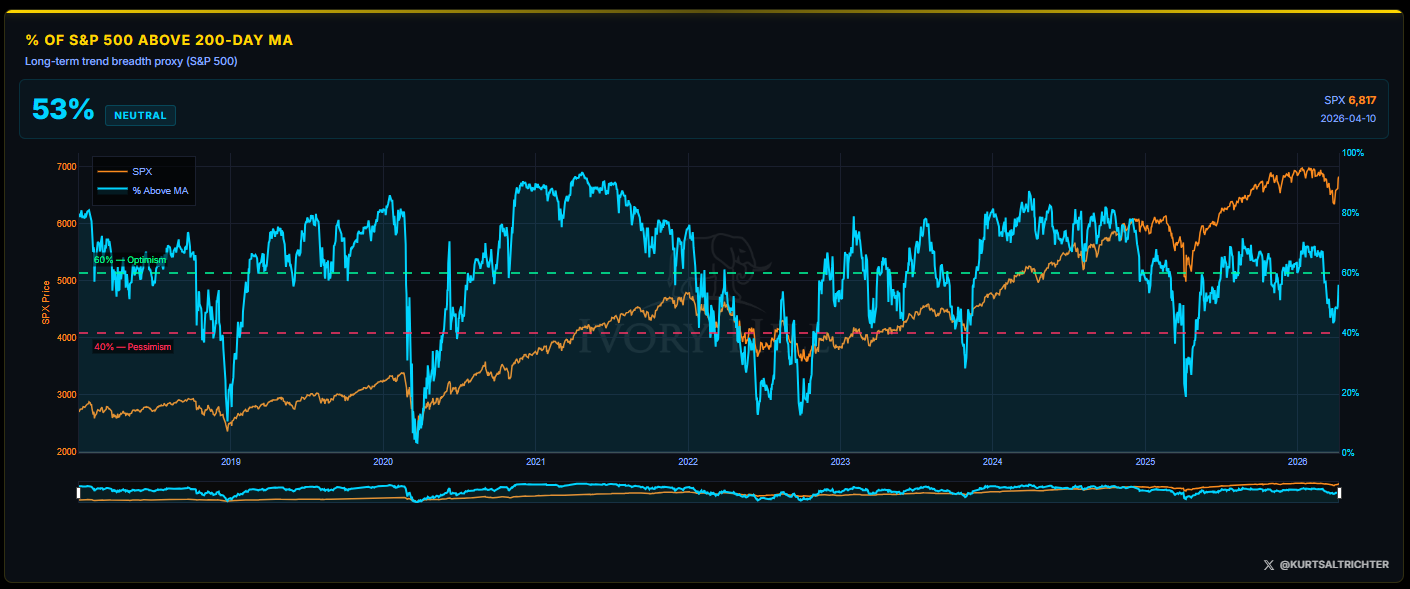
53% of S&P 500 constituents are trading above their 200-day moving average. Last week that number was 49%, which triggered a bearish reading. The recovery to 53% lifts the signal to Neutral.
The 60% level is the optimism threshold. Above 60%, breadth confirms a broad-based advance. Below 40%, every comparable period in recent history was associated with a recession or major correction. We are in the middle. Not broken, not confirmed.
What this means in plain language: Breadth measures how many stocks are participating in the market’s move. If the S&P 500 is going up but only a handful of large tech stocks are driving it, breadth is narrow, and the rally is weak. If most stocks are going up together, breadth is wide, and the rally has a stronger foundation. Right now, 53% of stocks are above their long-term trend line. That is not great, but it is better than last week’s 49%. The model needs to see 60% before it calls breadth bullish. Think of it this way: a little more than half the market is in an uptrend. That is enough to keep the floor from falling out, but not enough to suggest the rally has broad conviction behind it.
Composite Signal and Regime
Last week: Gamma Bearish, RV Neutral, Flow Bearish, Breadth Bearish, Regime Risk-Off.
Three signals improved. Gamma went from Bearish to Bullish. The flow went from Bearish to Bullish. Breadth went from Bearish to Neutral. The weighted composite moved from -0.9 to +0.8. That is the largest single-week improvement since the model began tracking.
Bottom Line
The structure improved. That is the story this week. Gamma flipped positive for the first time in eight weeks. Now we need it to hold. CTAs reversed from selling to buying. Breadth recovered from bearish to neutral. The model moved from Risk-Off to Risk-On and reallocated accordingly.
That said, realized volatility is still elevated. The 1-month/3-month spread has not closed. Breadth is at 53%, still below the 60% optimism threshold. The regime improved on momentum, not on confirmation. If SPX drops back below 6,783 and stays there, the gamma signal flips back to bearish and the whole calculus changes. With all the Trump Tape Bombs going on over the last month, anything is possible.
What holds the allocation here: positive gamma territory, rising systematic flows, and improving breadth. What threatens it: another volatility spike that pushes 1-month RV further above 3-month, or a loss of the gamma flip level.
The market earned a regime upgrade this week. Now it has to hold it, or I think we stay range-bound for a little while longer.
In all probability, I think the markets have put in a short-term bottom, but the violent volatility has not. The trend is working hard to firm up, which could happen any day now.
And remember - The one fact pertaining to all conditions is that they will change.
Feel free to use me as a sounding board.
Follow me on X for more updates.
Best regards,
Schedule a call with me by clicking HERE
Kurt S. Altrichter, CRPS®
Wealth Advisor | President
Disclosure
The Gamma Report is published by Ivory Hill, LLC. All opinions and views expressed in this report reflect our analysis as of the date of publication and are subject to change without notice. The information contained herein is for informational and educational purposes only and should not be considered specific investment advice or a recommendation to buy or sell any security.
The data, models, and tactical allocations discussed in this report are designed to illustrate market structure and positioning trends and may differ from portfolio decisions made by Ivory Hill, LLC or its affiliates. Investing involves risk, including the possible loss of principal. Past performance is not indicative of future results.
Ivory Hill, LLC, and its members, officers, directors, and employees expressly disclaim any and all liability for actions taken based on the information contained in this report.