
7,000 Here We Come
Stocks Positioned for a Sizeable Move

CLIENT ANNOUNCEMENT: We welcomed our baby yesterday! I’ll be slow to respond to emails and calls for the next few days. If something is time-sensitive, please text my cell or leave a voicemail on my office line.
The Ivory Hill RiskSIGNAL™ remains green, which means the broader trend is still intact, and any pullback should be viewed as a buying opportunity within that framework.
Since stocks carved out a "capitulation-style" bottom followed by a sharp V-shaped recovery in April, the market has been grinding higher through another volatility crush in the derivatives market. A volatility crush follows a surge in implied volatility, like we saw leading up to the April peak in the VIX and the bottom in equities.
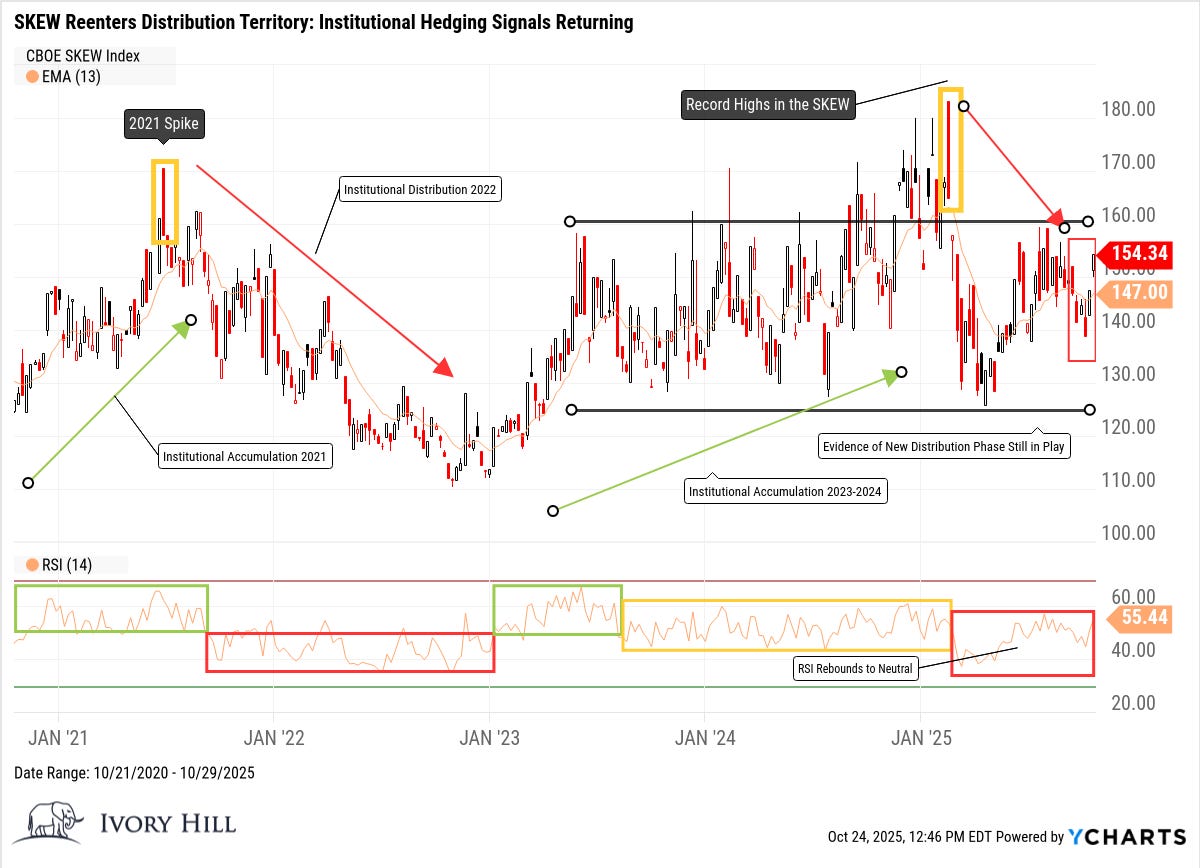
Initially, traders rush into equity puts or long volatility positions to hedge portfolios at any cost. But as the cost of downside protection rises and the breakeven levels on those puts move far below current market prices, the risk and reward of holding them collapse. At that point, portfolio managers are often better off adjusting exposure directly, either selling underlying positions, adding to longs, or setting stop levels near those same put thresholds.
At the same time, option speculators who built up long put exposure during the selloff start offloading those contracts to late-cycle panic sellers. This period of volatility exhaustion is what flipped money flows bullish back in April, and a similar setup has taken shape again this month.
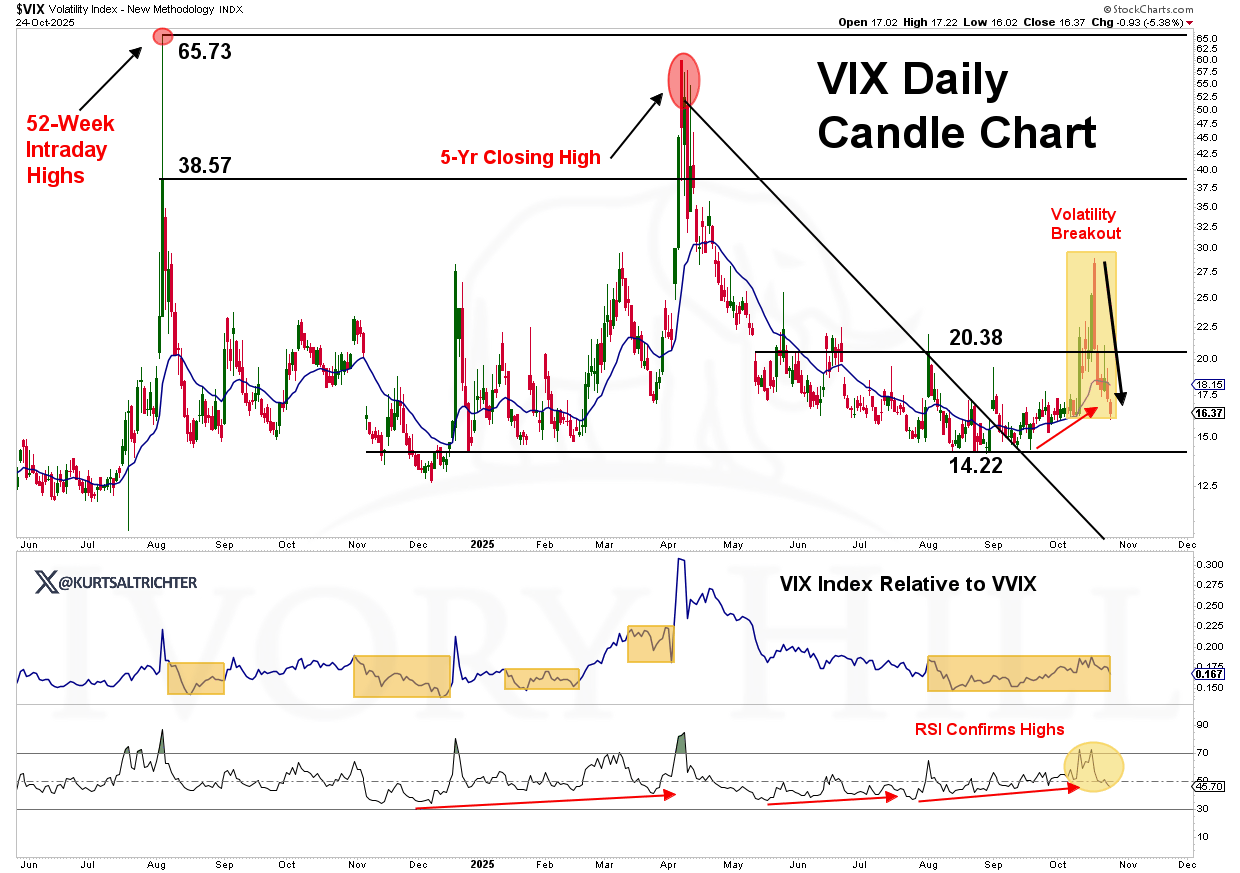
The VIX spiked toward 29 on October 10 and has since fallen sharply, closing yesterday at 17.3, a 40 percent collapse in implied volatility. The question now is whether that was the full reset or only the prelude to another round of volatility.
While certainty is impossible, several technical and momentum indicators offer useful clues.
Technical View: S&P 500 Hourly Chart
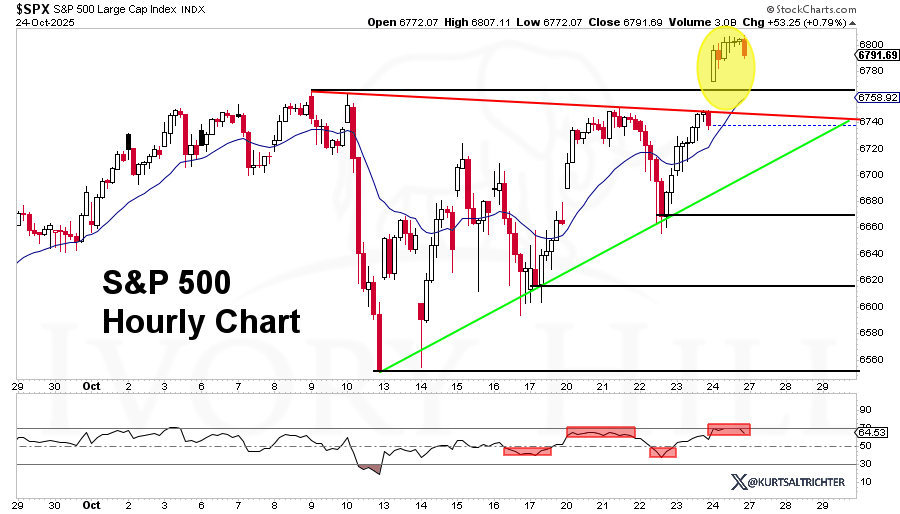
The S&P 500 pushed decisively through the 6,760 resistance zone earlier this week and closed the session near 6,792, marking a strong confirmation of the breakout. The hourly chart now shows price consolidating just above the former resistance trendline, with a series of tight candles forming near the highs.
This type of behavior is typical after a breakout as traders test whether the move is sustainable. The area around 6,760 to 6,780 now serves as near-term support. Holding above this zone would suggest that the market is digesting gains rather than reversing, keeping the path open for a measured move toward 6,970, which aligns with the technical target derived from the prior consolidation range. If we hit 6,970, then it will only be a matter of time until the S&P 500 makes new all-time highs at the psychological 7,000 level.
However, if the S&P 500 fails to hold this newly established support and closes back below 6,750, it would indicate a false breakout and open the door for a retest of 6,670, followed by a possible decline toward 6,550.
Momentum & Sentiment
The hourly RSI remains near 64, showing steady momentum but with early signs of cooling. The RSI pattern continues to form lower highs, hinting at short-term fatigue in the recent rally. That said, as long as RSI holds above the 50 line, the short-term trend remains intact.
From a sentiment perspective, the recent volatility crush has reduced hedging pressure, allowing for more orderly price action. Dealers are no longer forced to sell into weakness, which has shifted the near-term bias toward volatility suppression rather than chaos.
And remember - The one fact pertaining to all conditions is that they will change.
Follow me on X for more updates.
Best regards,
-Kurt
Schedule a call with me by clicking HERE
Kurt S. Altrichter, CRPS®
Fiduciary Advisor | President
Disclosure
The RiskSignal Report is published by Ivory Hil, LLC. All opinions and views expressed in this report reflect our analysis as of the date of publication and are subject to change without notice. The information contained herein is for informational and educational purposes only and should not be considered specific investment advice or a recommendation to buy or sell any security.
The data, models, and tactical allocations discussed in this report are designed to illustrate market structure and positioning trends and may differ from portfolio decisions made by Ivory Hill, LLC or its affiliates. Investing involves risk, including the possible loss of principal. Past performance is not indicative of future results.
Ivory Hil, LLC, and its members, officers, directors, and employees expressly disclaim any and all liability for actions taken based on the information contained in this report.
Thank you Kurt. Congratulations on welcoming your newborn into the world!