

When I started publishing a weekly report, I realized something important. Most investors are not looking for another prediction about what the market will do next. They are trying to understand why it moves the way it does and how to use that information to make better decisions.
My goal with the Gamma Report is to explain the unseen forces that drive markets, such as liquidity, volatility, and dealer positioning, and turn them into a framework investors can actually use.
This report is for traders who respect process, who understand that the left side of the equal sign determines the right, not the other way around.
This guide will help you understand how the model works, how to read the signals, and how to use the tactical allocations to stay aligned with the market’s structure.
1. What the Gamma Report Measures
The Gamma Report focuses on market structure, not stories or opinions. It looks at how liquidity, volatility, and dealer hedging interact beneath the surface of price movement. The purpose is to define the environment the market is trading in so that you can adjust your exposure accordingly.
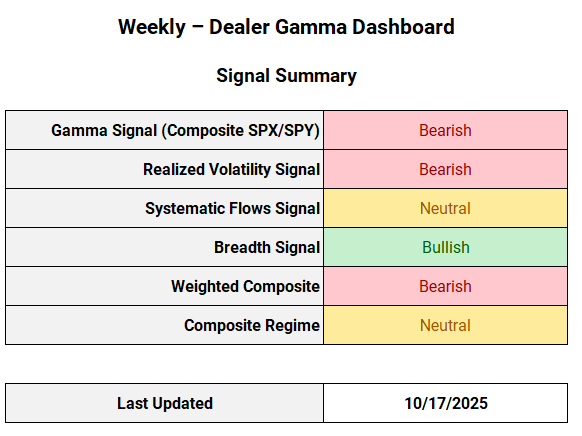
Every week, the model evaluates five signals that capture the true tone of risk in the market. Each signal is scored to reflect bullish, neutral, or bearish structural conditions.
2. How the Composite Regime Works
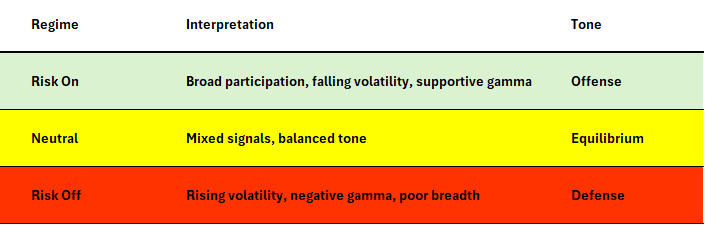
The composite regime converts the five signals into a clear reading of market tone.
When three or more signals point in the same direction, conviction increases. Gamma and volatility drive short-term regime shifts, while flows and breadth confirm whether those moves are sustainable.
3. How to Read the Gamma vs Spot Chart
Gamma exposure is one of the most important inputs in the model because it defines the market’s short-term stability. The other signals, such as volatility, systematic flows, and breadth, build on this foundation to form the broader market picture.
The Gamma Flip Line
Each chart includes a level called the Gamma Flip Line. This is the price level where dealers transition from positive gamma to negative gamma.
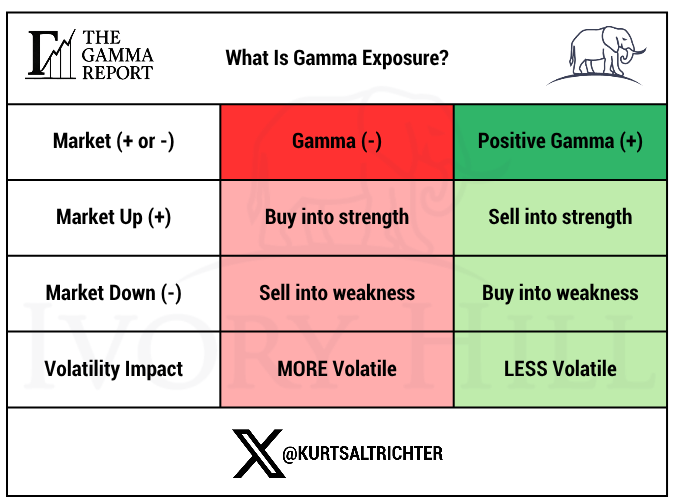
When the market trades above the flip line, dealers are long gamma, and volatility tends to stay low.
When the market trades below the flip line, dealers are short gamma, and volatility tends to rise.
Think of the flip line as the dividing point between a calm sea and rough water. Above it, the market is self-stabilizing. Below it, every wave becomes larger.
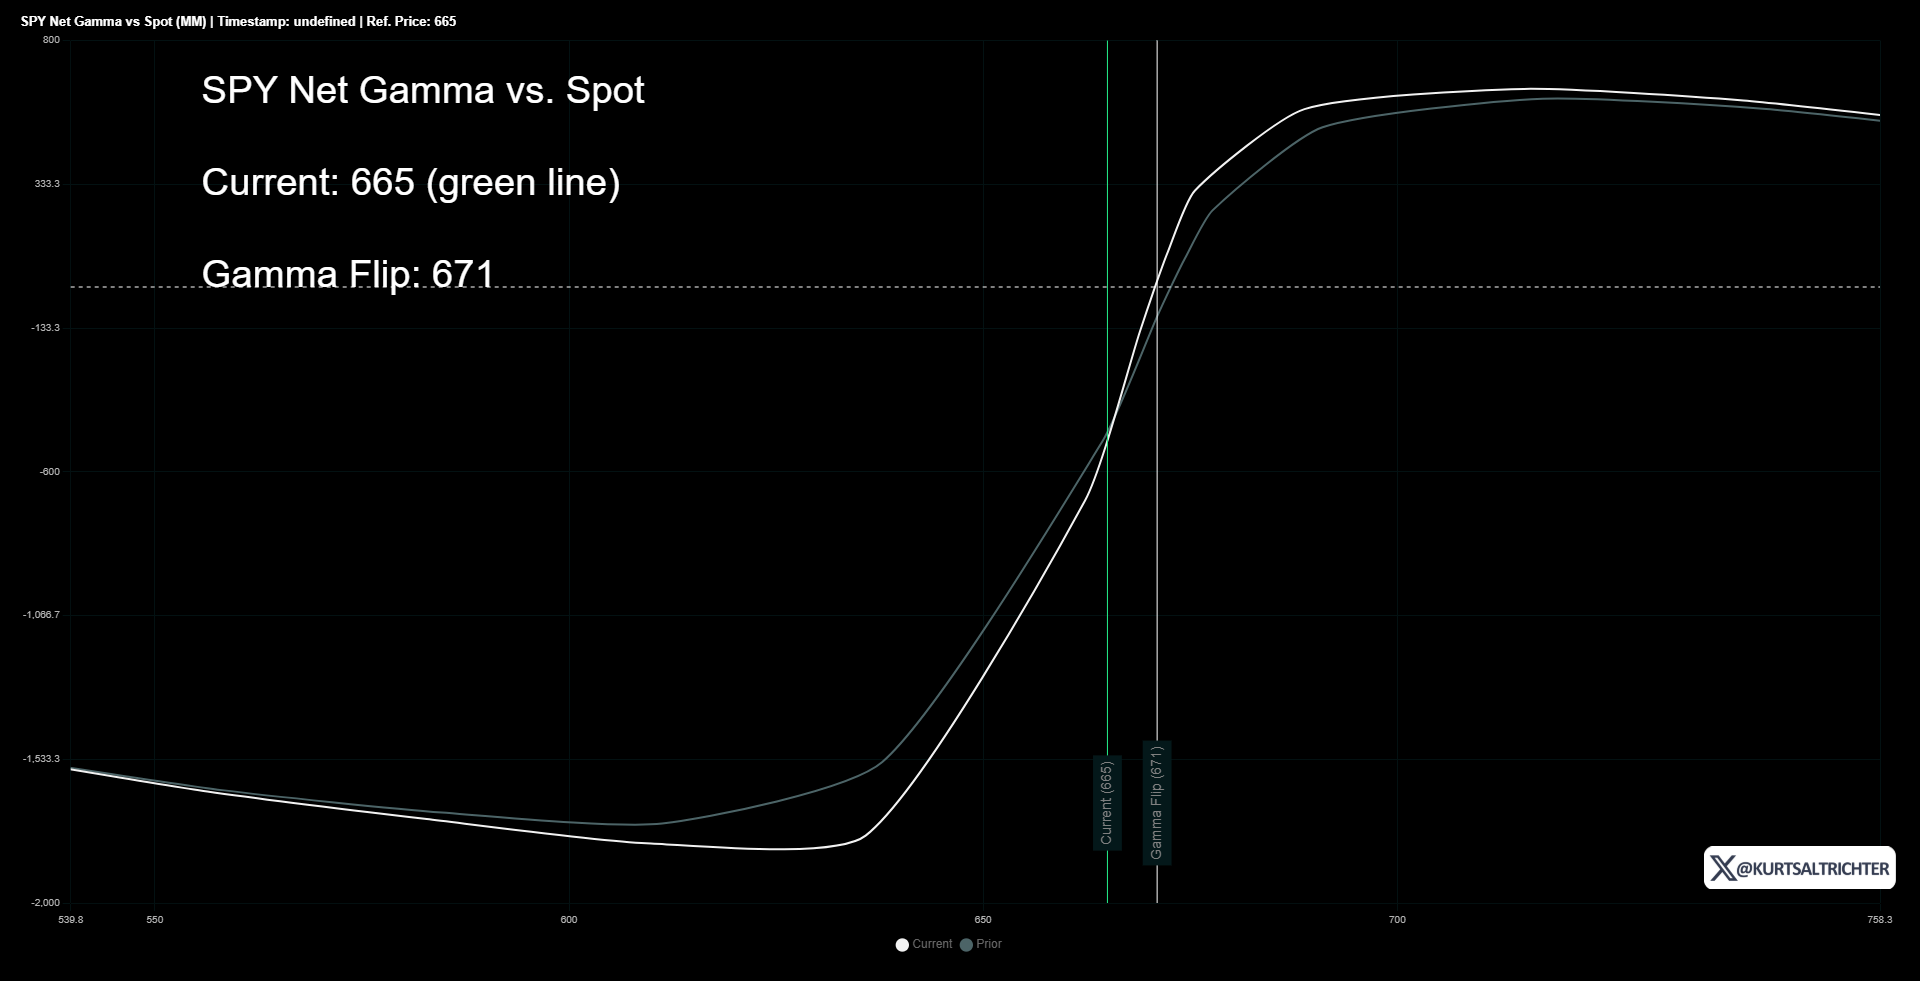
Gamma Curve
When the spot price (green line) is left of the gamma flip point (white line), dealers are in a negative gamma regime. When the green line is to the right, they are in a positive gamma regime.
SPX vs SPY Weighting
The Gamma Report uses a 70/30 weighting between SPX and SPY to reflect two types of flow.
SPX represents institutional hedging and large position management.
SPY represents ETF-related flows and short-term liquidity.
Combining both improves accuracy by capturing how professional and retail hedging behavior overlap.
Reading the Chart Behavior
When the index hovers around the flip line, the market experiences intraday chop as dealers adjust hedges.
When the index moves ABOVE, volatility is suppressed, and price action becomes smoother.
When the index moves well BELOW, volatility expands, and swings grow more intense, IN BOTH DIRECTIONS.
Why These Levels Matter
The gamma flip line is not just a technical level. It represents real structural positioning. Large options dealers are forced to hedge dynamically around it. Price movement near this level often reflects mechanics rather than emotion.
Investor Takeaway
Understanding where the market sits relative to the flip line gives investors an inside look at the market’s structure. Above it, risk-taking is rewarded. Below it, liquidity thins and volatility increases.
4. How to Read the Realized Volatility Chart
Realized volatility measures how much the market is actually moving each day. Unlike implied volatility, which is based on expectations, realized volatility shows what has already happened in price action. The chart tracks 30-day and 90-day realized volatility to show whether movement is accelerating or calming down.
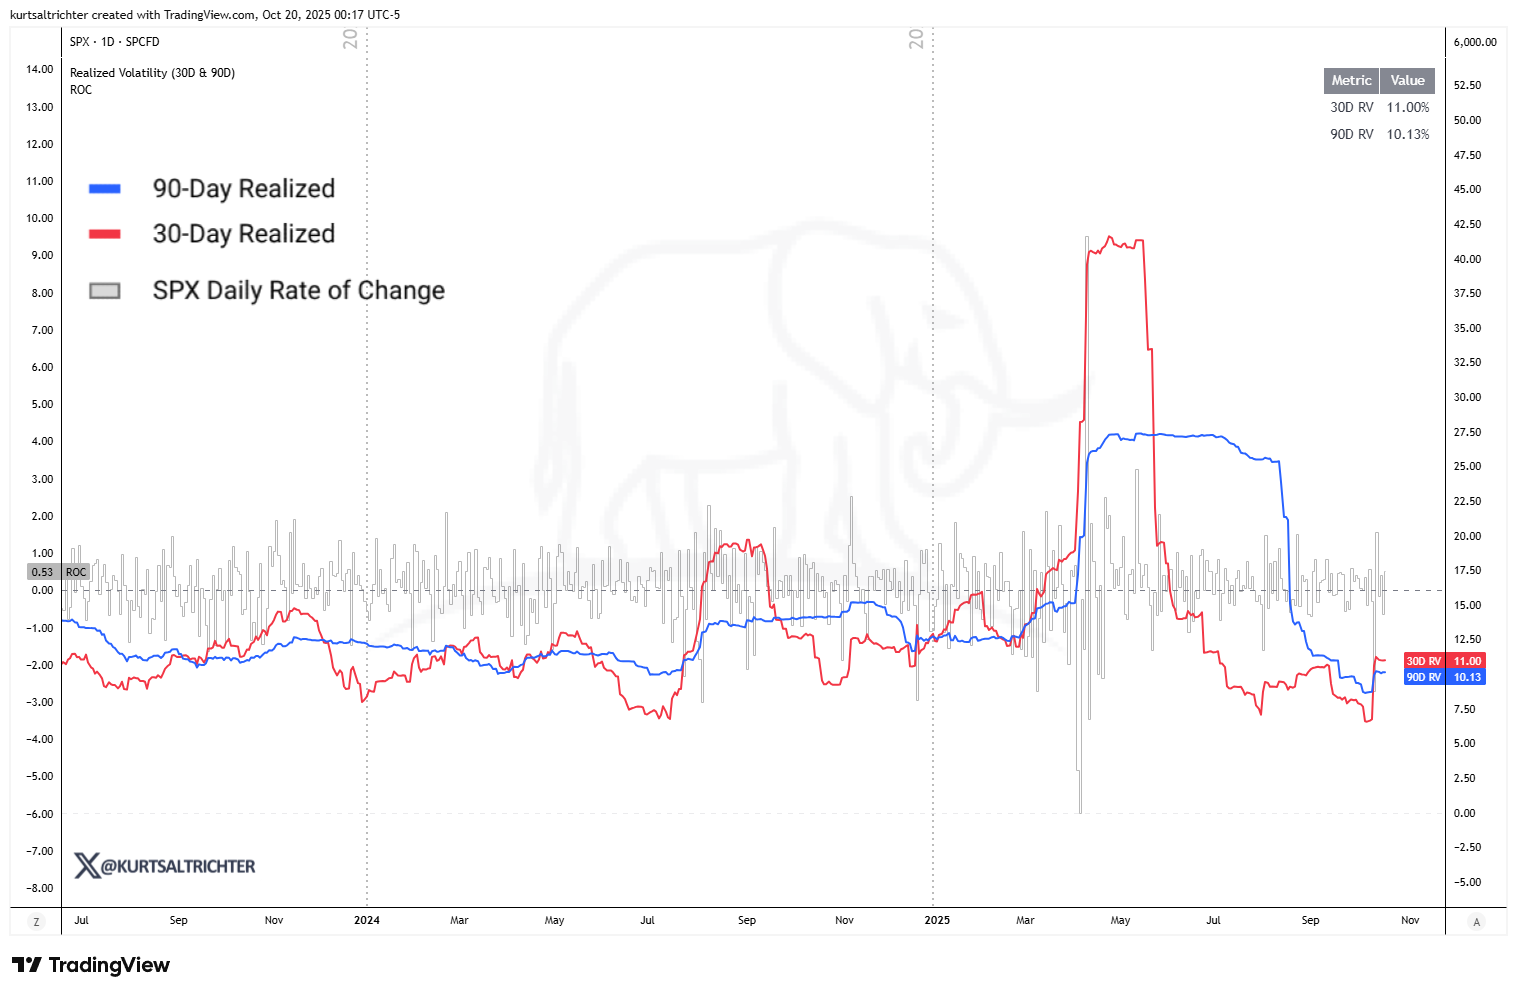
The Lines
The red line represents the 30-day realized volatility, which reacts quickly to short-term swings.
The blue line represents the 90-day realized volatility, which moves more slowly and reflects long-term stability.
The gray bars show the daily rate of change in the S&P 500, illustrating how volatility develops.
How to Read Crossovers
When the 30-day line rises above the 90-day line, short-term volatility is increasing faster than long-term volatility. This signals stress and instability in the market.
When the 30-day line falls below the 90-day line, volatility is easing and markets are stabilizing.
What It Means for Market Behavior
Falling volatility means systematic strategies like CTA and Vol Control funds are adding exposure, which supports the market.
Rising volatility means those same strategies are reducing exposure, removing liquidity, and often increasing downside pressure.
Why It Matters
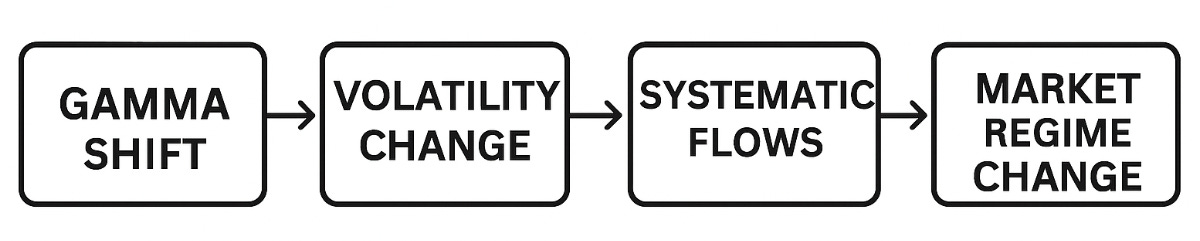
Realized volatility connects gamma and flows. When gamma turns negative, volatility rises. When volatility rises, systematic funds reduce exposure. This feedback loop drives much of the market’s short-term movement.
Investor Takeaway
Volatility is the heartbeat of market structure. When realized volatility is falling, markets can absorb risk and reward disciplined buying. When it is rising, liquidity becomes fragile and price swings grow larger.
How Gamma Connects to the Composite Regime
Gamma is the foundation of the Composite Regime Model because it defines how stable or unstable the market is in the short term.
1. Gamma Drives Short-Term Conditions
Gamma is the first signal to react when market structure changes. It can flip in a single day while volatility and breadth evolve more slowly.
When gamma turns positive, it signals improving liquidity and a more supportive environment for risk-taking.
When gamma turns negative, it warns that volatility may expand, and hedging flows could push prices around.
2. How Gamma Interacts with Volatility and Flows
Positive gamma keeps volatility contained. Negative gamma increases it.
As volatility rises, systematic funds cut exposure, which can pressure markets.
Chain of Events:
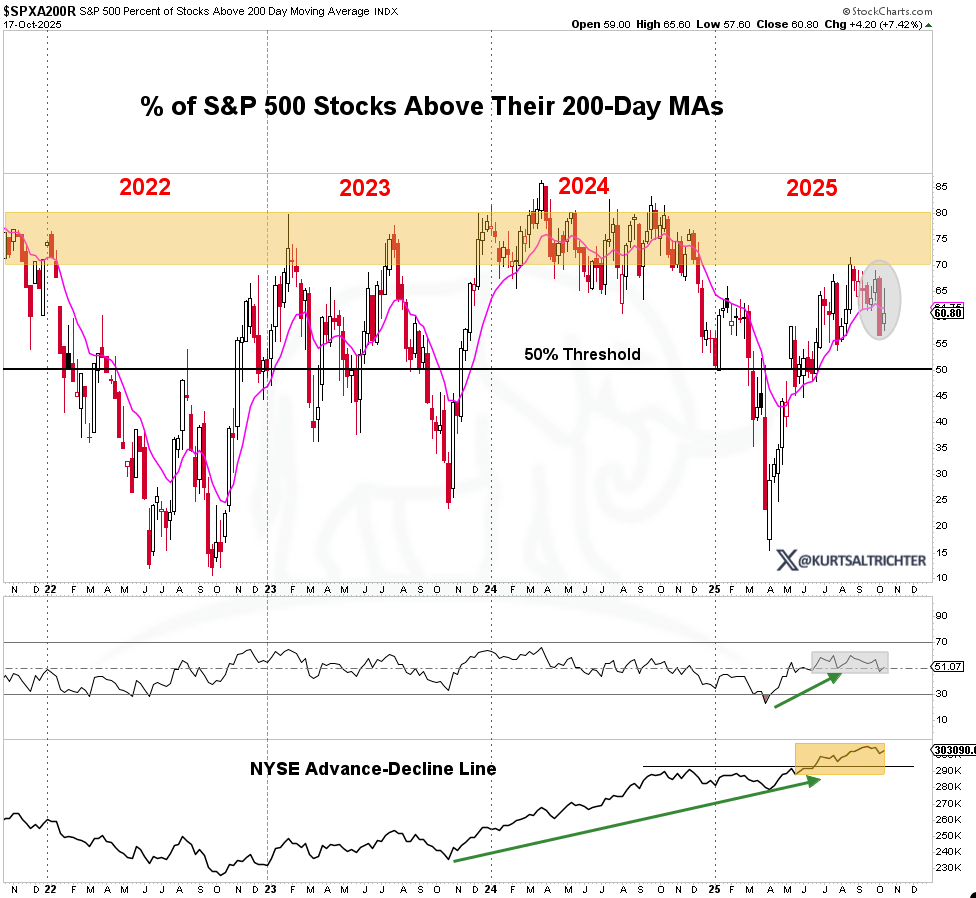
3. Breadth Confirms the Move
Gamma and volatility drive short-term direction, but breadth confirms whether that move is healthy or fragile.
If gamma turns positive but fewer than 55 percent of S&P 500 stocks are above their 200-day average, the model stays Neutral. If breadth expands at the same time gamma improves, the model shifts toward Risk On.
6. How to Use the Tactical Allocations
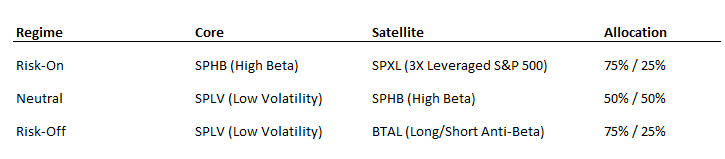
The tactical allocation framework turns the Composite Regime signal into a simple, rules-based portfolio approach. Each regime, Risk On, Neutral, or Risk Off, determines two components of the portfolio: a core position and a satellite position.
The Core Position
The core represents the main engine of the model. It is designed to match the dominant regime and reflect the market’s structural tone.
In a Risk On regime, the core tilts toward high-beta exposure, such as SPHB (S&P 500 High Beta ETF), which benefits most when volatility is low and liquidity is strong.
In a Neutral regime, the core shifts to a balance between SPLV (Low Volatility) and SPHB (high-beta) to stay flexible as conditions stabilize or transition.
In a Risk Off regime, the core moves toward SPLV, a defensive position that holds companies with historically lower volatility and steadier earnings.
The core is the anchor of the portfolio. It represents roughly 75 percent of exposure in most regimes and defines how the model behaves day to day.
The Satellite Position
The satellite is the tactical lever of the model. It adjusts positioning based on how strong or weak the regime signal is.
In a Risk On phase, the satellite adds leverage through SPXL, a 3x leveraged S&P 500 ETF that amplifies exposure to broad market strength.
In a Neutral phase, the satellite complements the core with SPHB to keep participation while maintaining some defensive balance.
In a Risk Off phase, the satellite holds BTAL, a long-short ETF that profits when low-volatility stocks outperform high-volatility stocks, helping offset downside risk.
The satellite typically represents 25 percent of the total allocation. It provides flexibility and responsiveness without changing the overall structure of the portfolio.
How the Two Work Together
The combination of core and satellite positions allows the model to adapt without overtrading. The core maintains consistent exposure to the dominant regime, while the satellite fine-tunes risk and opportunity.
This structure mirrors how professional multi-factor portfolios are built: a stable base with a tactical overlay. It gives the model the ability to lean into strength when the environment is supportive and pull back when liquidity tightens.
How It Works
The model will always have exposure to equities, either SPLV or SPHB
The daily model adjusts frequently as volatility shifts.
The weekly model locks in Friday’s reading for the following week to limit turnover.
Midweek changes only occur when volatility or gamma flips decisively.
Here is the risk/reward profile for each tactical allocation regime shift.
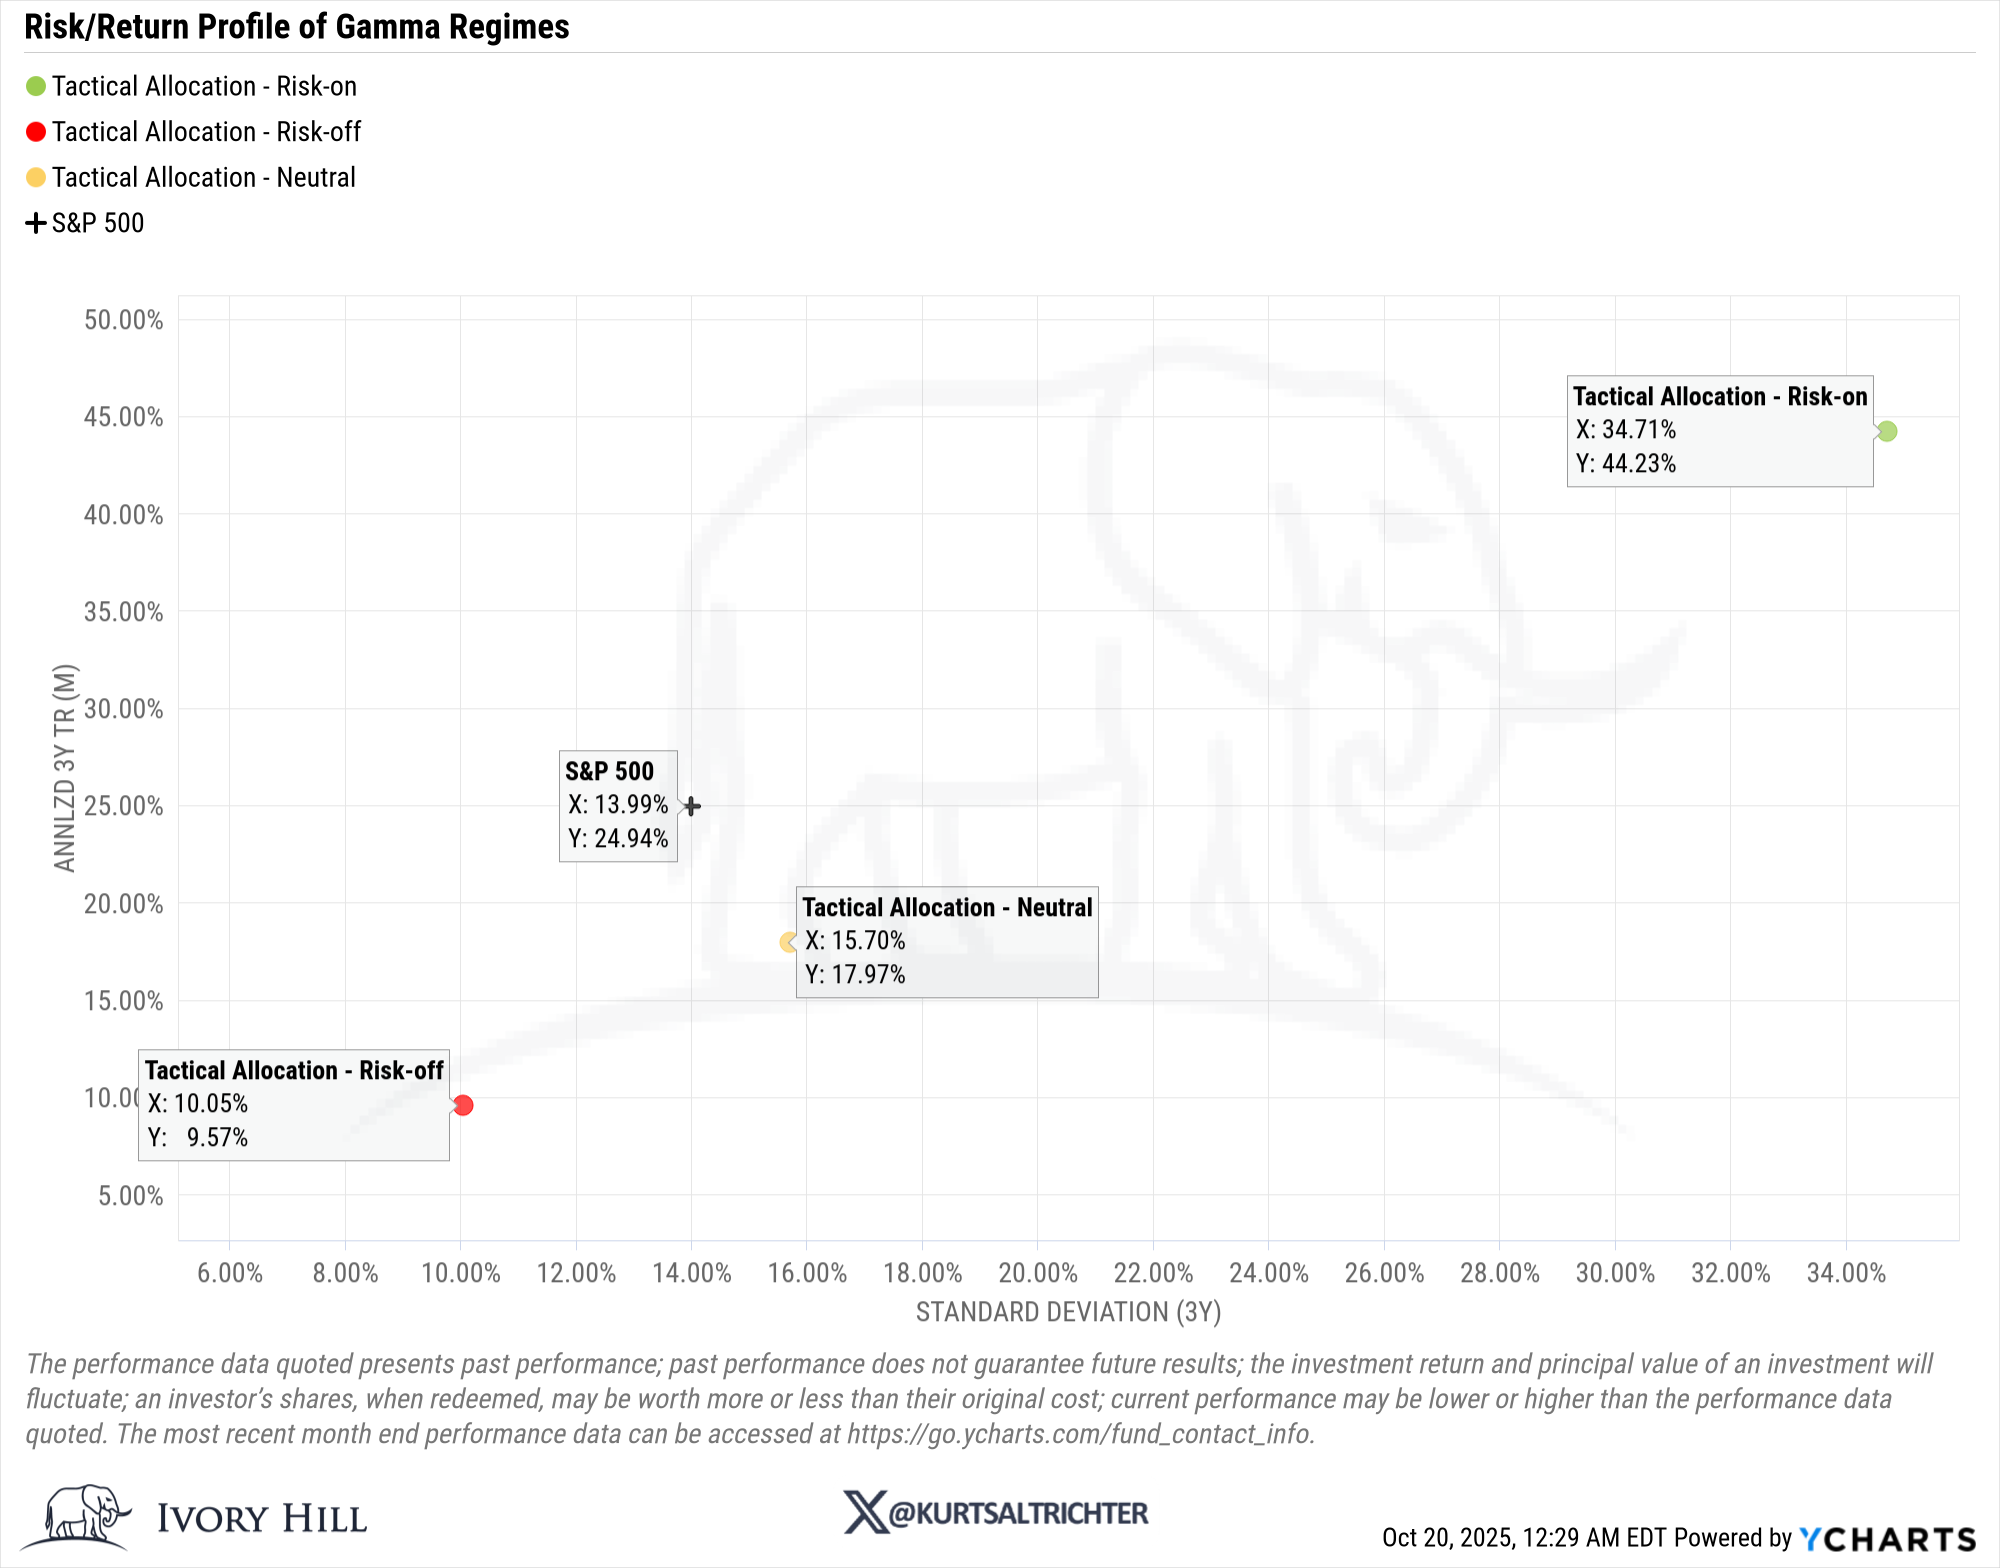
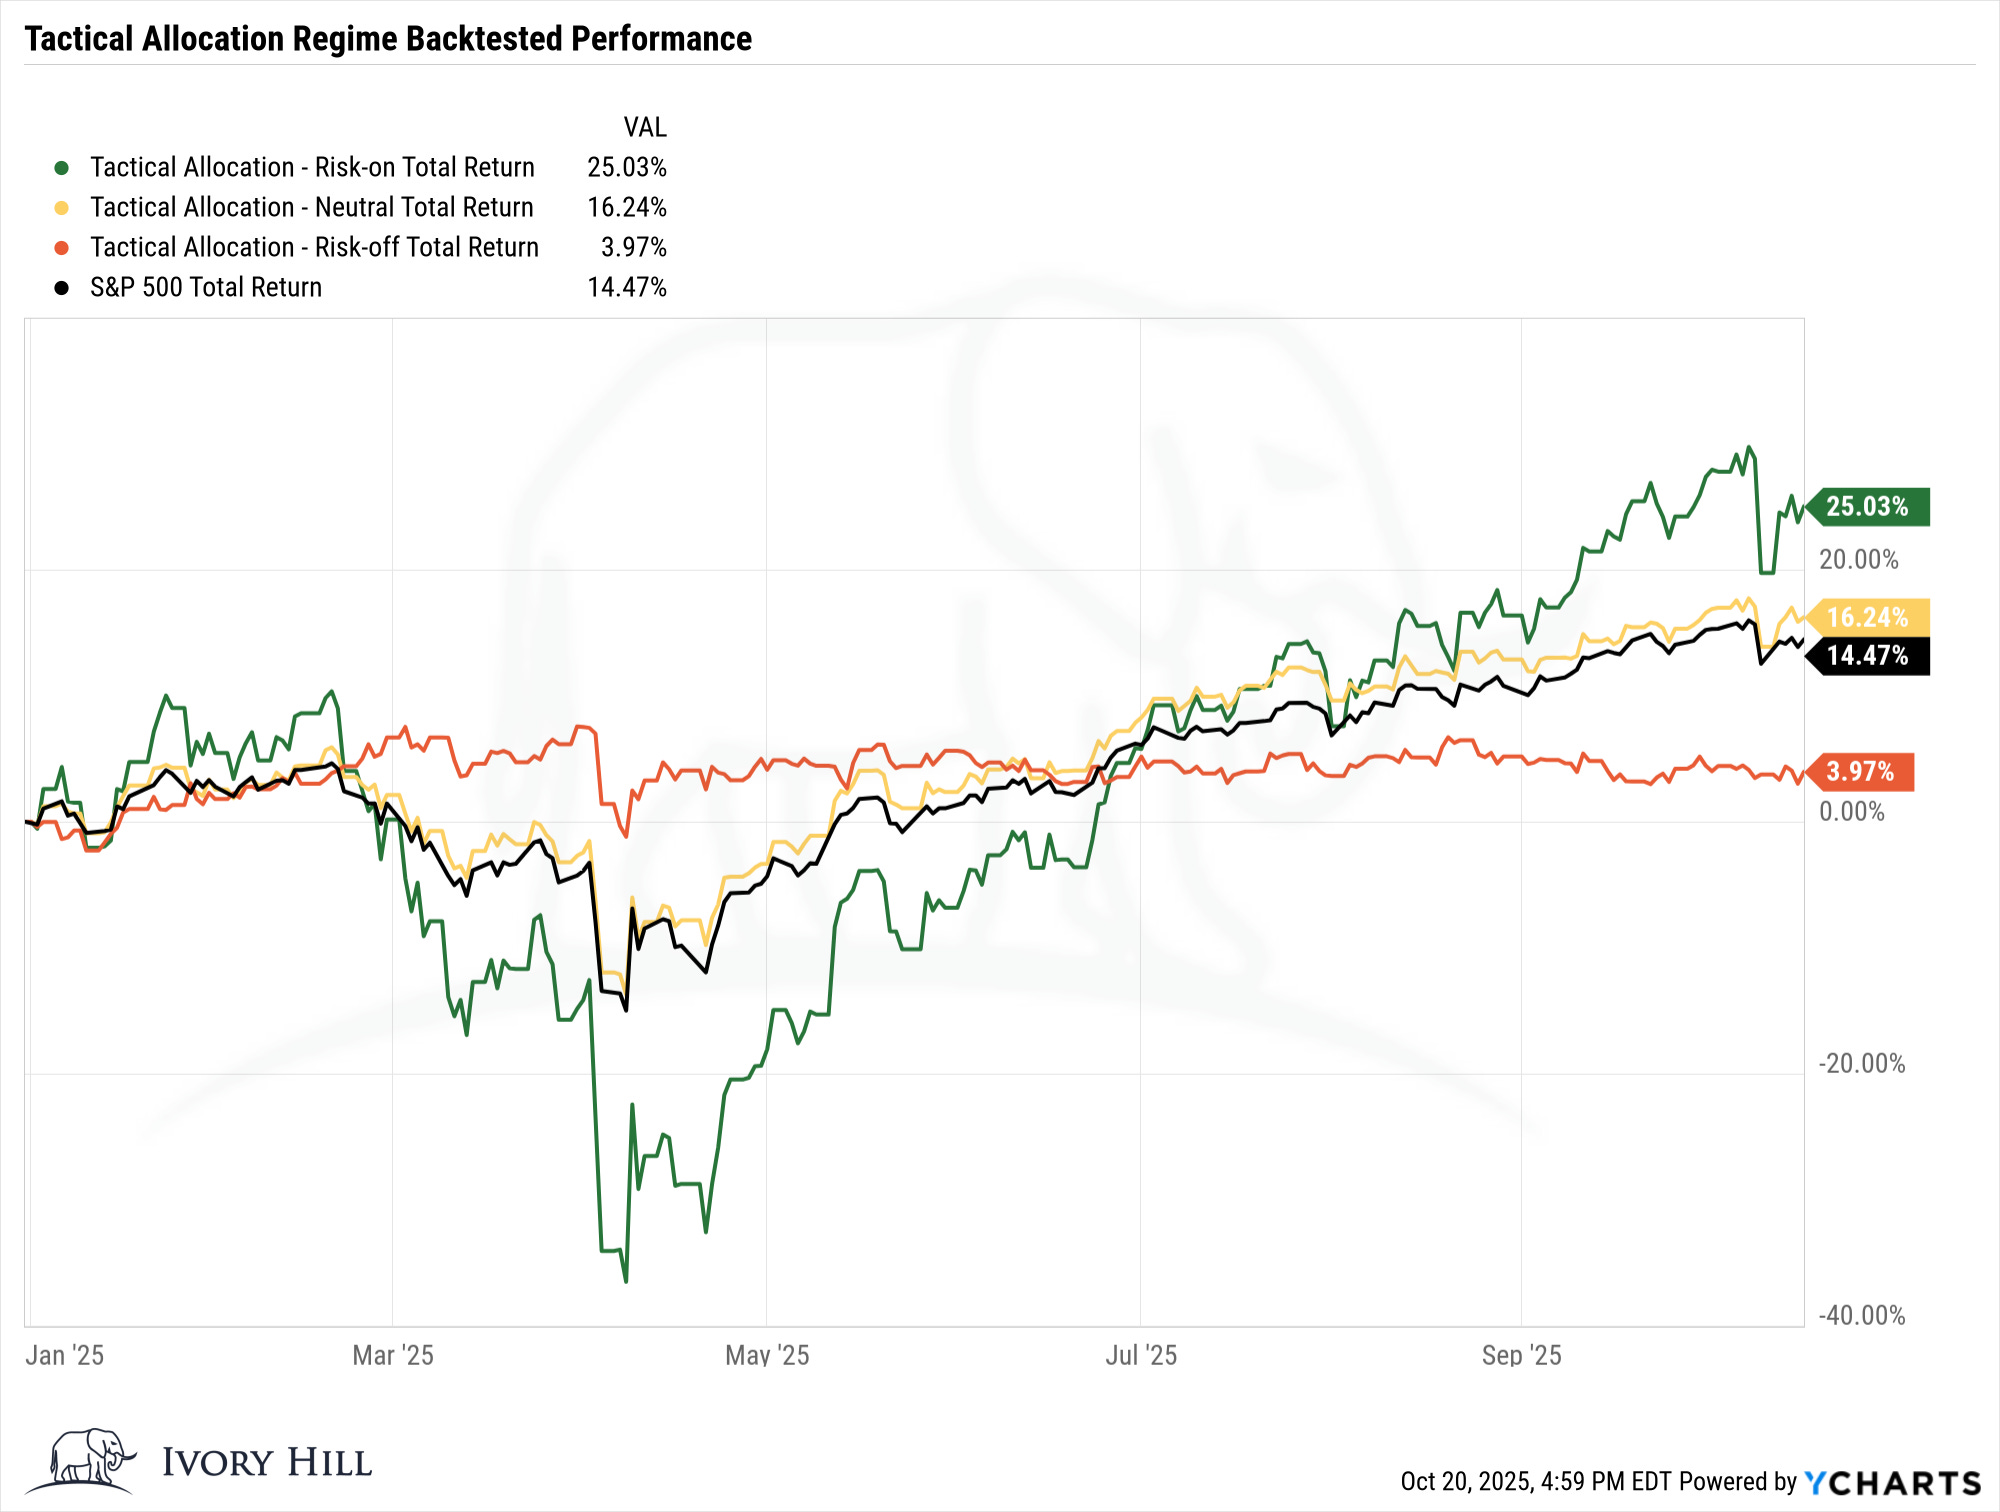
Here is the backtested performance for each tactical allocation regime.
Investor Takeaway
The tactical allocation gives investors a disciplined way to lean into opportunity when conditions improve and protect capital when risk rises. The goal is not to predict every move but to stay aligned with how the market is behaving structurally.
7. How to Use the Weekly Expected Move
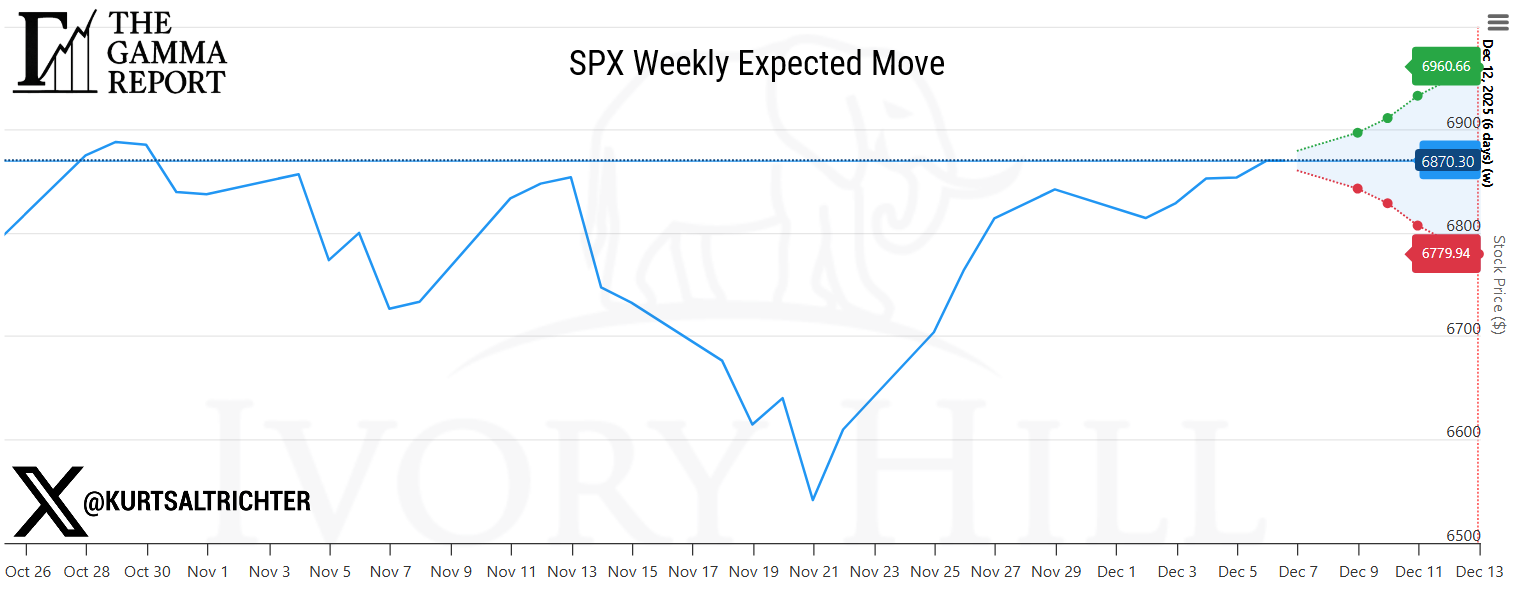
Most investors treat expected moves as trivia. This is a mistake. Expected moves define the playing field. They tell you where the price can travel without breaking the volatility regime.
For the upcoming week, the expected move spans roughly:
Upper band: near 6960
Lower band: near 6780
That 6780 level is essential. It is nearly identical to the gamma flip line. When a key level from dealer positioning lines up with the lower boundary of the expected move, you have a structural floor. If price trades down into that area, you expect dealer hedging to stabilize the tape and push realized vol lower. That is precisely what a positive gamma regime does.
The upper band around 6960 defines what the market can do on the upside without breaking the volatility expectations. If price pushes through the upper band with expanding realized vol, that would signal a shift toward overshoot dynamics. If price approaches the upper band with declining vol, it tells you the move is being absorbed rather than stressed.
Expected moves are not predictions. It is a volatility fence. The closer price gets to either boundary, the more you should expect hedging flows to matter. Inside those boundaries, the tape behaves normally. Outside those boundaries, the structure changes, and you need to respect that.
The Daily Candle Chart and the Weekly Expected Move Chart together give you a graphical roadmap. SPX is trading toward the center of the range, above the flip line, with positive gamma reinforcing stability. That is why both models are Risk On. That is why the structure supports staying invested. And that is why we will monitor the expected move lines every week. They tell you where the game is being played.
Final Thoughts
The Gamma Report is built to help investors and advisors see the market for what it is: a system driven by liquidity and positioning rather than news headlines.
Each signal in the model works together to tell a story about the market’s internal health. Gamma sets the tone, volatility confirms it, systematic flows reinforce it, and breadth validates it.