Are We Headed For A 2007 Summer Repeat?
85% Correlation to 2007
The Ivory Hill RiskSIGNAL™ has remained green since December 5th. Our short-term indicator is red, while our intermediate-term volatility signal is green.
Positioning Update:
Last week, I shared that we sold our high-beta and tech-heavy Nasdaq ETFs. This move resulted in having about 20% cash on the sidelines, which helped us avoid additional losses as tech experienced a significant sell-off this week.
This week, we increased our cash levels further by cutting all high-beta positions tied to the S&P 500, bubble-cap tech stocks, small caps, and biotech. We still maintain our QQQ and MGK exposure since our long-term signal remains green.
Additionally, this week, we initiated a small position in iShares 20+ Year Treasury Bond ETF (TLT) and increased our exposure to utility stocks via XLU. Consequently, our net cash position is approximately 30%, depending on the strategy.
Are We Headed For A 2007 Summer Repeat?
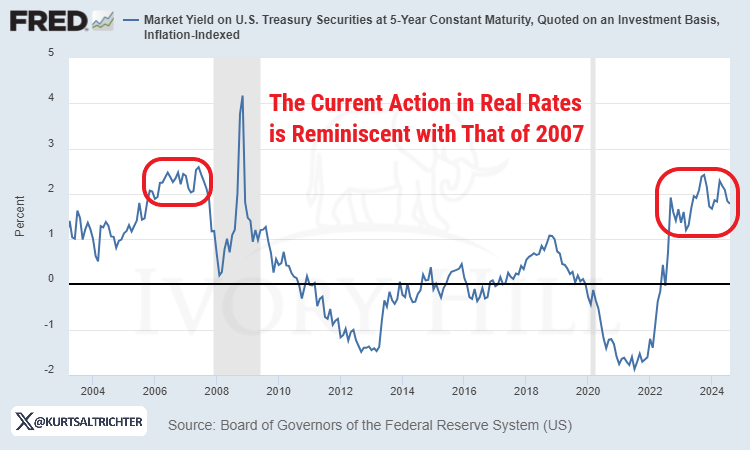
Since 2020, I have been studying the hindsight lessons from 2007, and I have drawn significant parallels between the current market conditions and the economic environment preceding the Great Recession. I have observed notable similarities across asset classes, including equities, derivatives, Treasuries, and corporate bonds.
I have analyzed each of the four key market parallels in both 2007 and today, detailing the developments leading up to the equity market peak before the Global Financial Crisis (GFC). Crucially, I have been outlining specific indicators for subscribers and clients to monitor in the coming months and quarters that could signal an impending market peak and a subsequent recessionary bear market.
These indicators are:
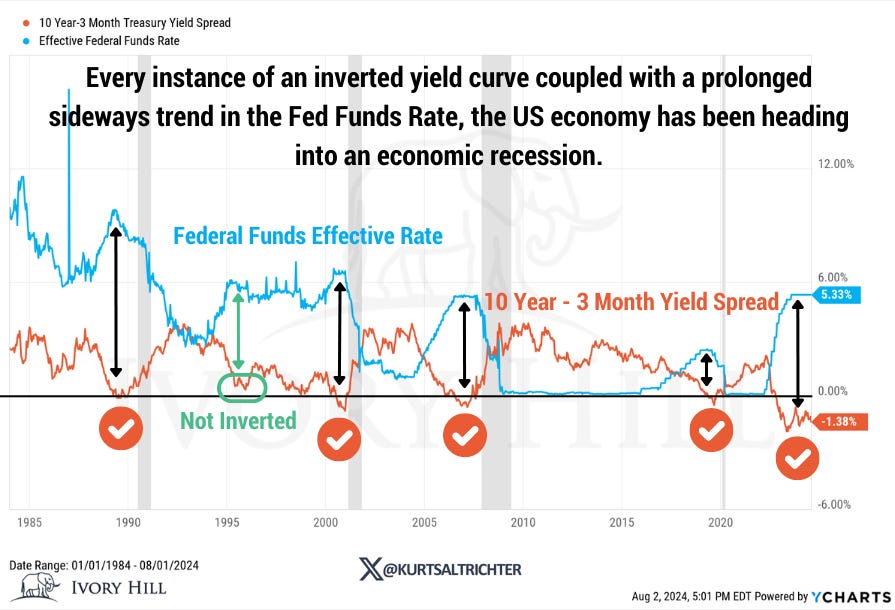
Bull-steepening in the 10s-2s and 10Y-3M Treasury yield curve spreads.
10Y-2Y spread Bull Steepened to a two-year high into the middle of last week.
Credit spreads reaching 52-week highs. Not there yet.
We are currently witnessing a similar dynamic to the summer of 2007, where we saw tightening spreads within an otherwise sideways range. This pattern preceded a widening of credit spreads to 52-week highs, which subsequently triggered one of the four bear market signals.
The VIX hitting 52-week highs. Triggered.
The formation of a bearish price pattern, such as a “Head & Shoulders,” in the S&P 500. We are not there yet.
All these warning signs appeared in the summer of 2007, approximately three months before the S&P 500's peak in October 2007.
Currently, these "rhyming" dynamics between the present market environment and that of 2007 remain intact, indicating that the risks associated with a mature economic cycle are as elevated as they were leading up to the GFC. These risks prompted a closer examination of the S&P 500's daily price action over the past year compared to the year leading up to July 2007. The observed 85% correlation underscores the recurring nature of market history at the end of economic cycles.
Although predicting an October peak based solely on historical precedent would be imprudent, my cross-asset analysis suggests that an equity market peak in the coming months is both possible and more likely than not, especially with the Presidential election adding uncertainty as a potential major catalyst.
Attempting to pinpoint the exact timing of a lasting market peak would be unproductive, which is why I advocate for vigilant monitoring of the Four Bear Market Signals to Watch (listed above).
Meanwhile, the equity market is experiencing a complex rotation: traders are taking profits from the crowded bubble-cap tech-focused long trade (think Mag-7), covering short positions in lagging market segments like the Russell 2000, or chasing gains in other market areas like defensive stocks.
This rotation has been intensified by disruptions in the Global Carry Trade, primarily driven by a short-yen, long-tech position. A potential wild card to watch in the coming weeks is the further strengthening of the Japanese yen, which could sustain the mid-July "Great Rotation" away from mega-cap tech and into other equity market areas, potentially dragging down the S&P 500 and Nasdaq. However, we are not there yet, and this current dip is likely a buying opportunity, albeit with heightened caution due to late-cycle market risks.
Once I start seeing trending lower volatility on the Nasdaq and S&P 500, I plan on increasing our concentration risk. Remember, when volatility is rising, you want exposure to broader and lower-beta stocks. Conversely, when volatility is trending downward, you should aim for more concentrated and higher volatility exposure. It’s all about taking the right risk at the right time.
And remember - The one fact pertaining to all conditions is that they will change.
Feel free to use me as a sounding board.
Best regards,
-Kurt
Schedule a call with me by clicking HERE
Kurt S. Altrichter, CRPS®
Fiduciary Advisor | President
Email: kurt@ivoryhill.com | ivoryhill.com


