
Compression Before The Break
SPY & QQQ have entered a volatility choke point, with dealer positioning turning negative again and liquidity thinning. The next move out of this range will determine whether equities stabilize into

The Ivory Hill RiskSIGNAL™ remains green, which means the broader trend is still intact, and any pullback should be viewed as a buying opportunity within that framework. However, our short- and mid-term volatility signals have been red since late September, telling us to reduce exposure this week. With the market now operating in a negative gamma regime, we shifted out of high-beta names and into lower-beta, defensive equities to manage downside risk. The S&P 500 declined just under 3% on Friday after Trump announced a 100% tariff on Chinese imports, a move that blindsided the market and hit cyclical and China-sensitive sectors hardest, particularly semiconductors and industrials.
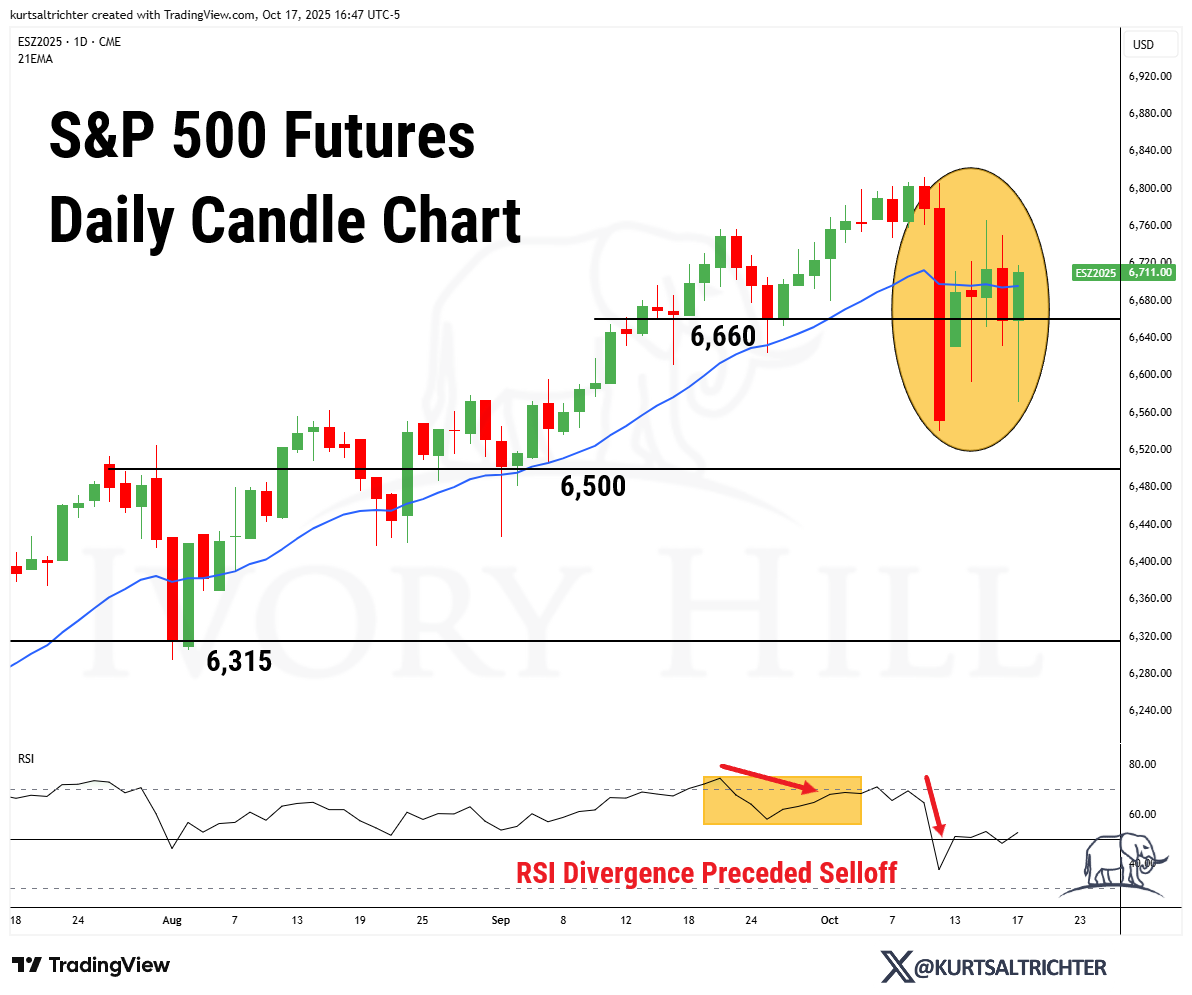
The S&P 500 held above 6,540, the lower boundary of its September consolidation range, maintaining structural support despite heightened volatility. The recent selloff was preceded by clear RSI divergence, indicating weakening momentum before the selloff. While breadth deteriorated, selling pressure never turned into broad liquidation. RSI briefly dipped below 30 before rebounding, which signals exhaustion rather than a full trend reversal. For now, 6,500 remains a key line of defense, while 6,700 marks the short-term resistance level that bulls need to reclaim to confirm stabilization.
While the market thinks this was because of Trump's post on China, under the surface, it has been telling a very different story.
The Gold Signal You Can’t Ignore
Gold is behaving like a meme stock, not a safe-haven. We have to be nearing a short-term top because I have received more than a few client calls over the last week, specifically asking me why we do not have more allocated to gold; one of those calls was from my own mother. This happens every time we enter a mania. When Bitcoin is ripping, the younger generation complains about not having enough allocated to crypto, and the older generation complains about not having enough allocated to gold.
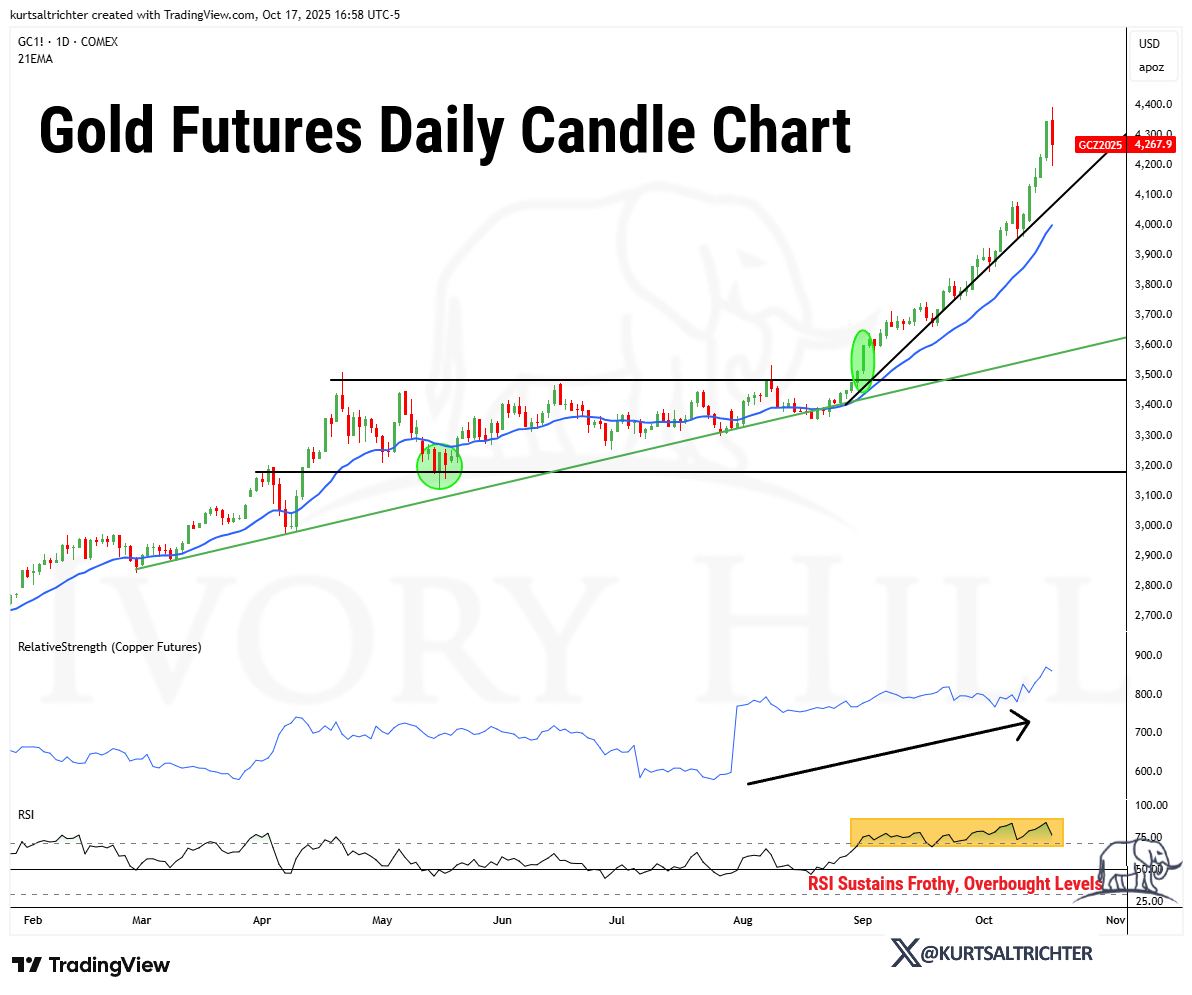
Gold is up over 60% year-to-date, breaking every macro correlation that normally anchors it to real yields or the dollar. The move is now driven by a combination of central bank accumulation, tariff and trade uncertainty, and lately, retail investors have been front-running what they see as a credibility problem in both monetary and fiscal policy.
This isn’t a typical inflation hedge. It’s a global statement against fiat instability and policy volatility. When gold rallies this aggressively, it reflects a market losing faith in the long-term stability of currency regimes, not chasing short-term CPI noise.
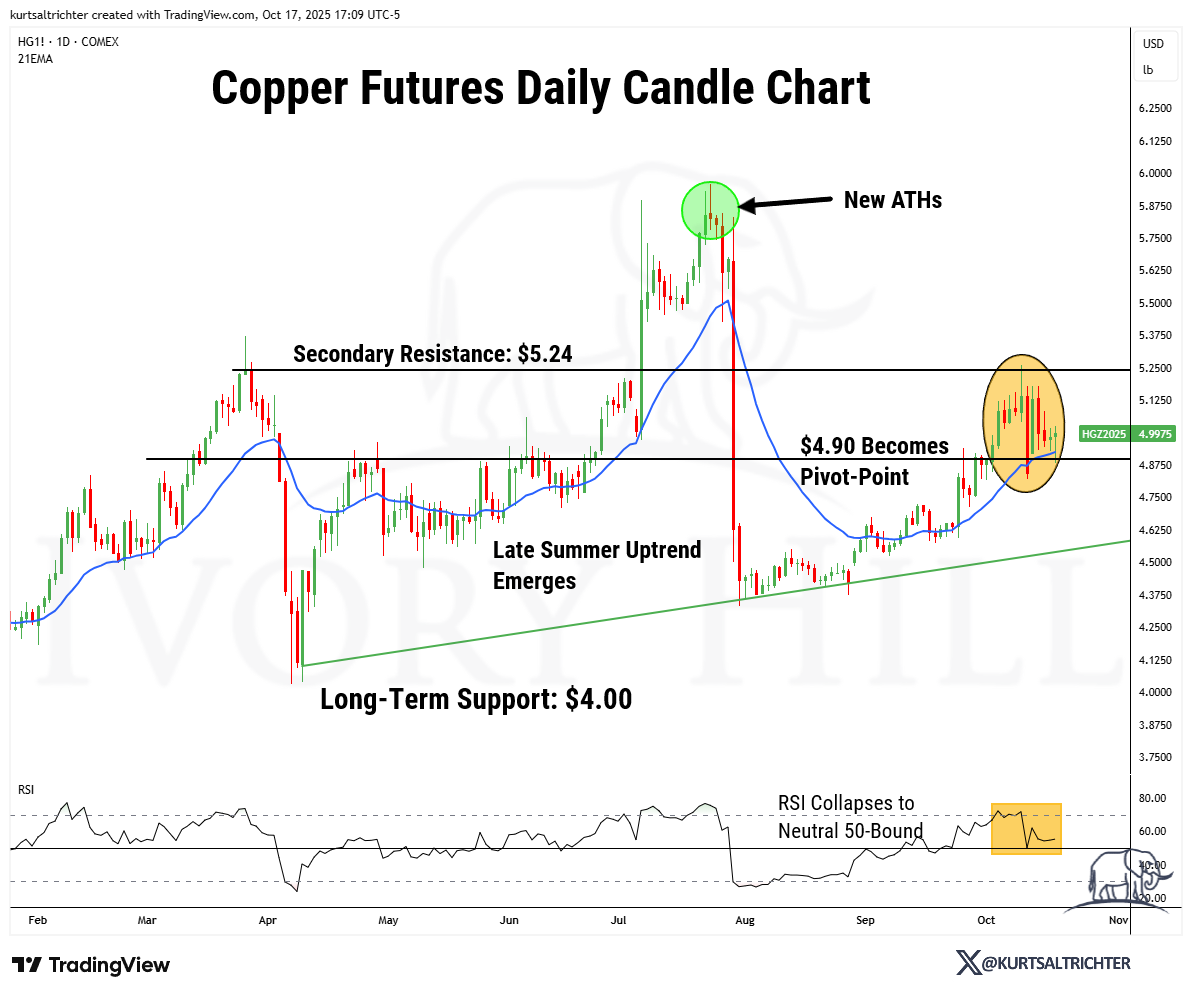
If you’re looking to buy gold right now, it may be wiser to consider copper instead. Gold has already made its move, gaining more than 60% this year, and is now trading well above trend with both momentum and sentiment stretched. While gold could stay elevated for a lot longer, a pullback looks increasingly likely, and new buyers face poor risk-reward at current levels. Copper, in contrast, has quietly reset. It recently retested its $4.90 pivot, is holding firm above long-term support, and its RSI has returned to neutral, suggesting it’s building a healthier base for the next leg higher.
From a long-term macro view, copper is the more compelling long-term asset. It’s the backbone of electrification, grid expansion, and re-industrialization, and global supply remains structurally tight after a decade of underinvestment. As the world builds more renewable power, EVs, and data infrastructure, copper demand will grow faster than new production. So while gold reflects policy fear, copper represents real economic transformation, and right now, the setup favors being early to copper rather than late to gold.
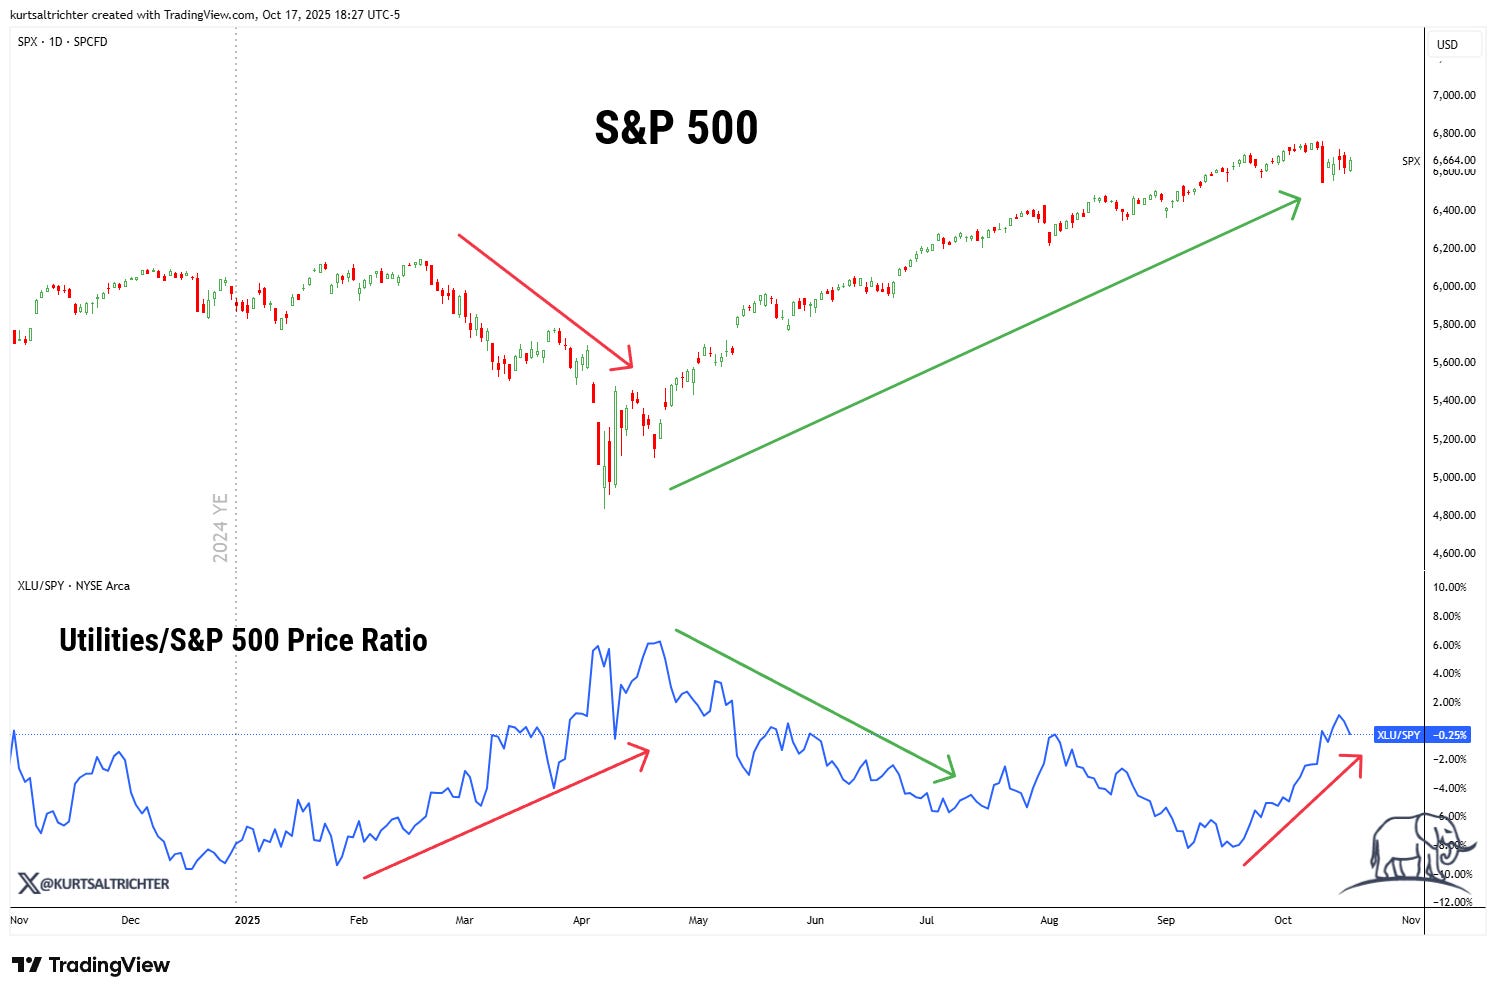
Utilities: Quiet Winners in a Noisy Market
Gold outperforming is a warning sign on its own, but while most investors stay focused on tech, utilities have quietly taken the lead. That rotation matters because utilities are the most bond-like sector in the equity market. When investors grow cautious, they rotate toward predictable cash flows and essential services like electricity and water, areas that remain stable regardless of the business cycle. This behavior reflects a classic risk-off move. Since stock prices often lead the economy, utilities outperforming the broader market suggests traders are positioning for slower growth and tightening financial conditions ahead.
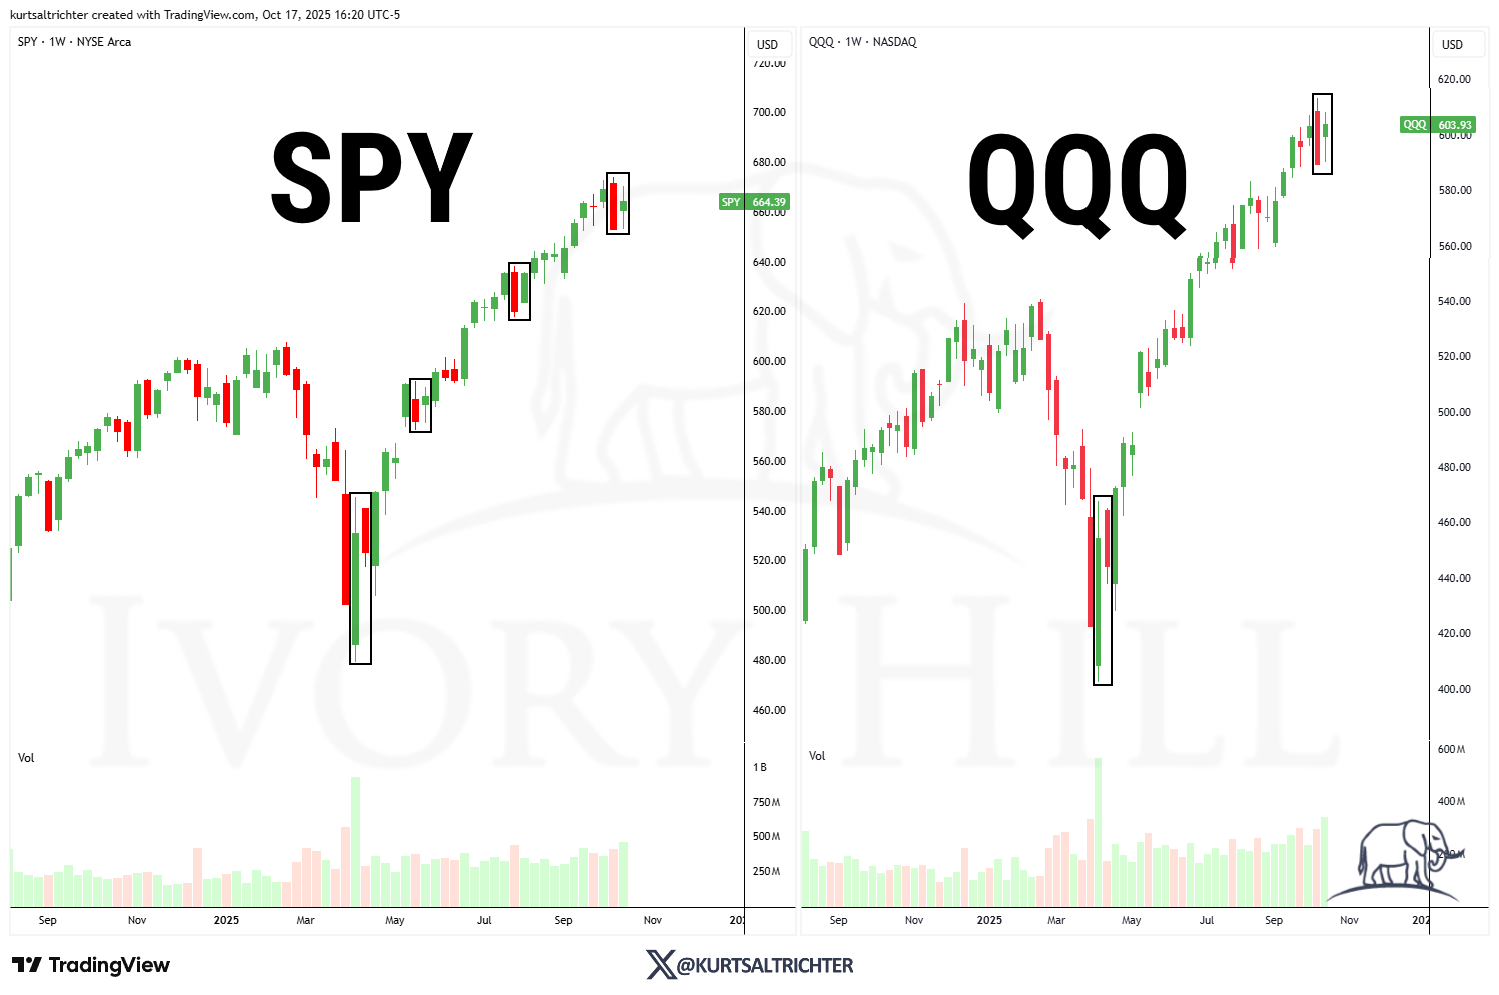
Both SPY and QQQ printed inside weeks, signaling a temporary pause in momentum after a volatile stretch. Inside weeks form when price trades entirely within the previous week’s range, often preceding sharp directional moves as volatility compresses. This reflects hesitation from both buyers and sellers following the CPI and tariff shocks, with markets now waiting for confirmation. A breakout above last week’s highs would suggest renewed risk appetite and likely bring systematic buyers back into the market. A break below the lows would confirm that the recent bounce was corrective, not durable, and could trigger another round of selling, especially in crowded tech positions. In short, the next decisive move out of this compression will likely define how equities trade into November.
The current inside-week pattern is occurring just as dealer positioning has flipped back toward negative gamma, as shown in the SPX Net Gamma History chart. This shift means dealers are once again forced to sell into weakness and buy into strength, amplifying intraday volatility and reducing market stability. When gamma turns negative, price action becomes more reactive to options flows rather than fundamental drivers, which helps explain the recent choppy, indecisive tape.
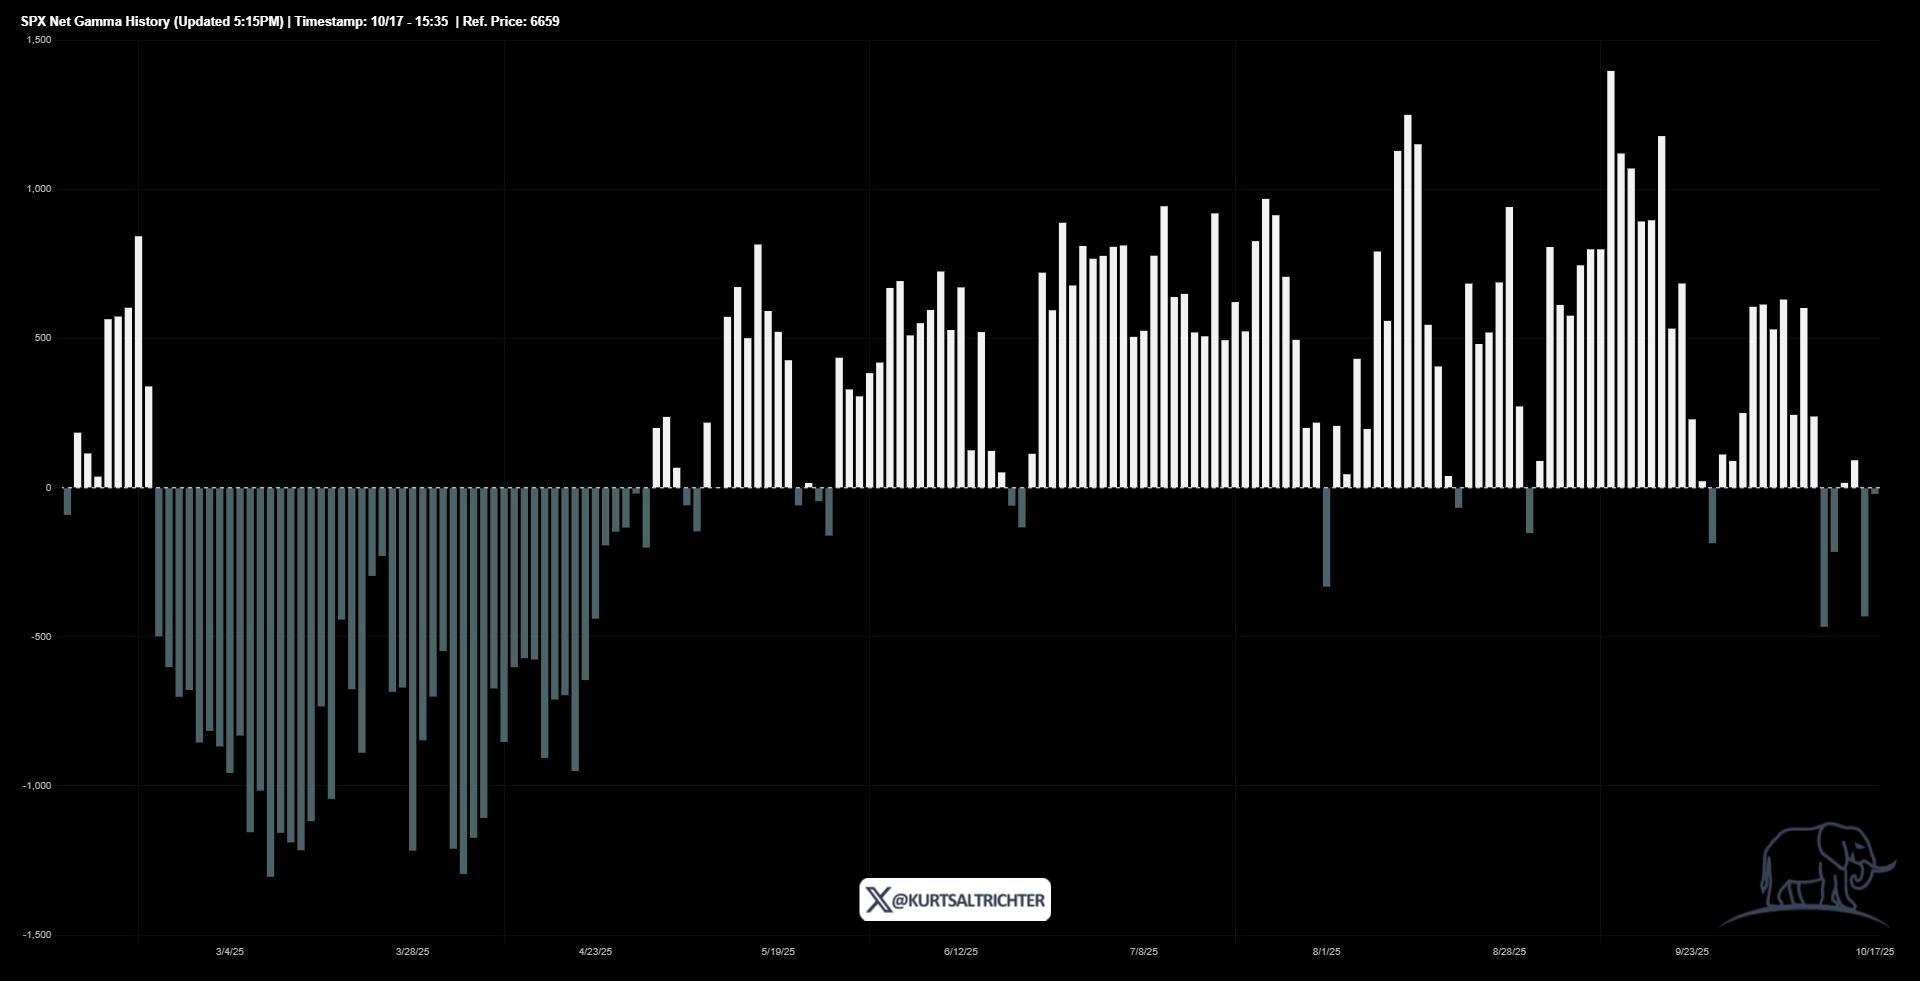
Historically, periods of sustained negative gamma have preceded both sharp downside accelerations and short-lived relief rallies, depending on the direction of the next breakout. With the market compressed inside last week’s range, this setup effectively loads the spring. A break above 6,700 would trigger a wave of dealer buying and suppress volatility, while a move below 6,520 would likely unleash another round of volatility expansion as hedging flows turn pro-cyclical to the downside.
Follow me on X for more updates.
And remember - The one fact pertaining to all conditions is that they will change.
Best regards,
-Kurt
Schedule a call with me by clicking HERE
Kurt S. Altrichter, CRPS®
Fiduciary Advisor | President
Disclosure
The RiskSIGNAL report is published by Ivory Hil, LLC. All opinions and views expressed in this report reflect our analysis as of the date of publication and are subject to change without notice. The information contained herein is for informational and educational purposes only and should not be considered specific investment advice or a recommendation to buy or sell any security.
The data, models, and tactical allocations discussed in this report are designed to illustrate market structure and positioning trends and may differ from portfolio decisions made by Ivory Hil, LLC or its affiliates. Investing involves risk, including the possible loss of principal. Past performance is not indicative of future results.
Ivory Hil, LLC, and its members, officers, directors, and employees expressly disclaim any and all liability for actions taken based on the information contained in this report.