

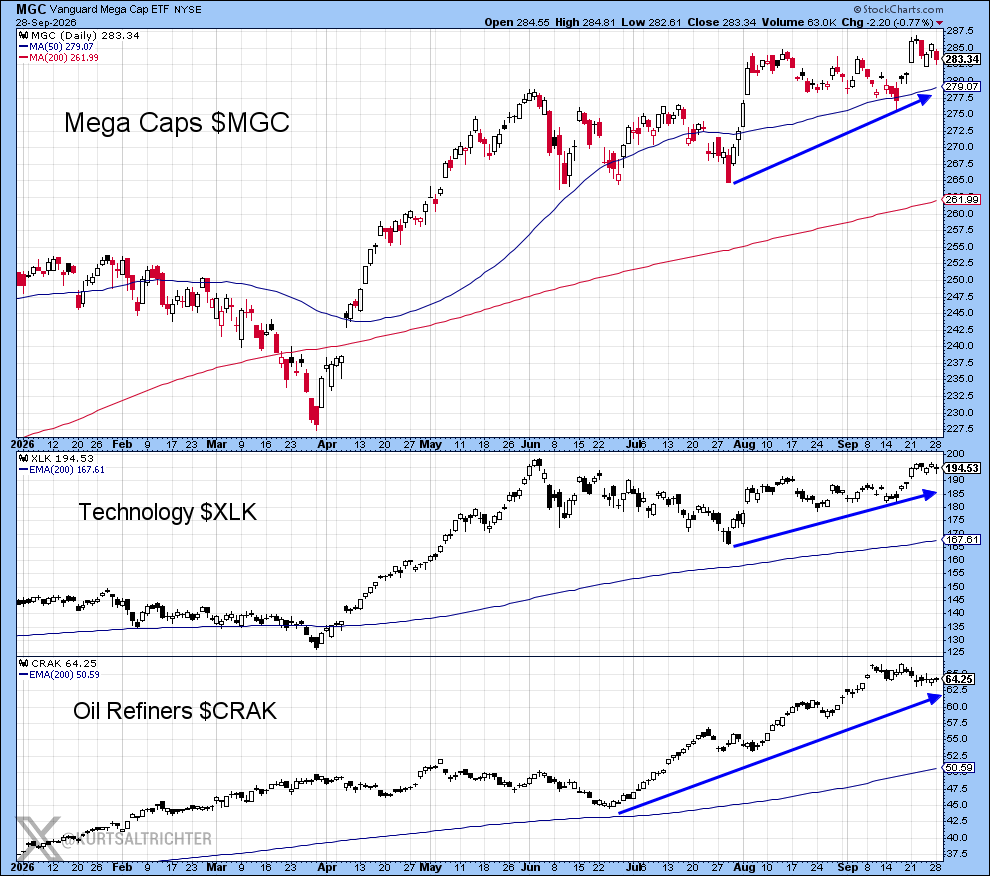
The S&P 500 closed yesterday at 7,683.69, sitting on 7,600 support. Remember, the S&P 500 index is a number built from 500 stocks, and it can look fine on the surface even when a lot of those stocks do not. That's what's happening right now. Utilities, industrials, and consumer staples are falling. Mega caps, technology, and oil refiners are rising. Both things are true at the same time, and rising interest rates are the reason.
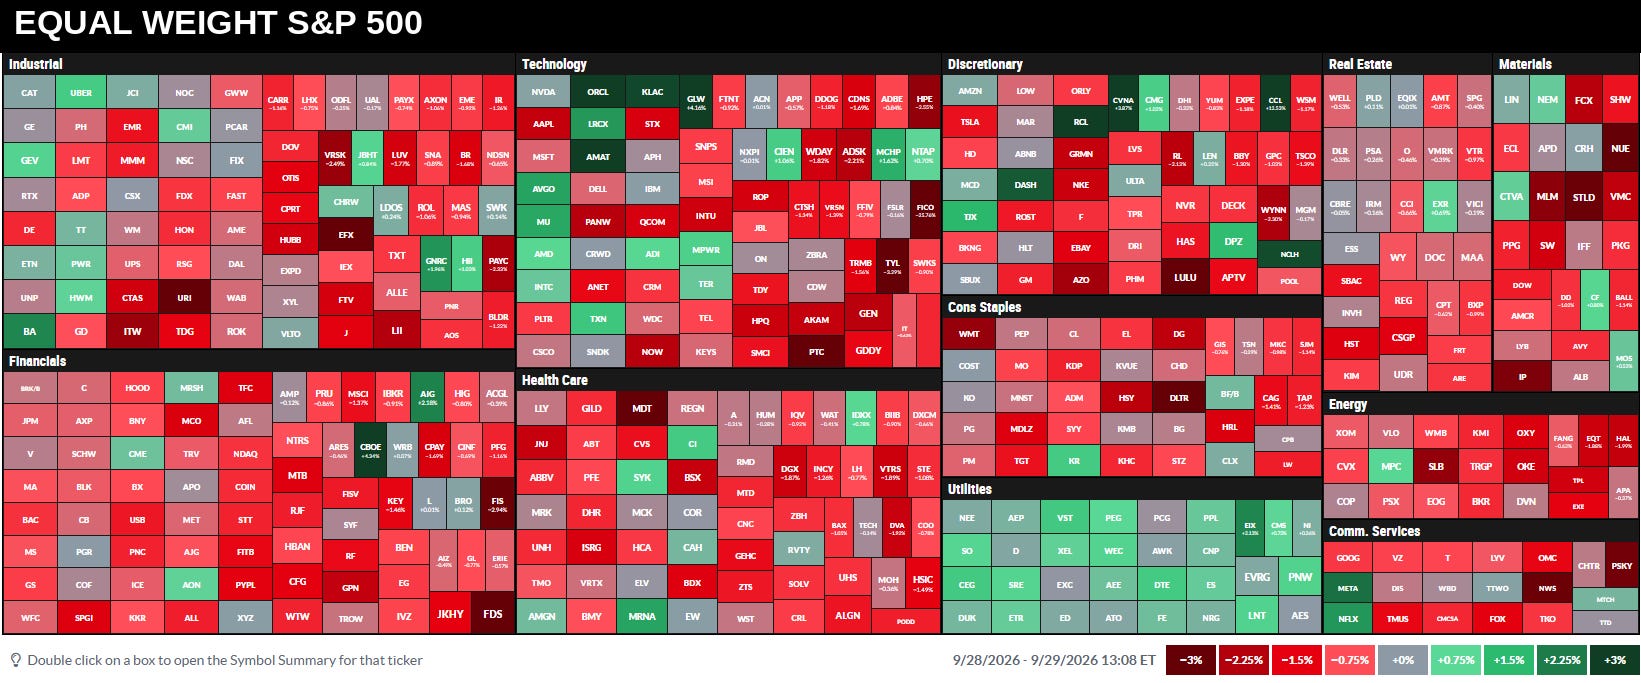
Here's what the big chart below is showing. RSP is the equal-weight version of the S&P 500, meaning all 500 stocks count the same; a small company moves the index by the same amount as a giant one.
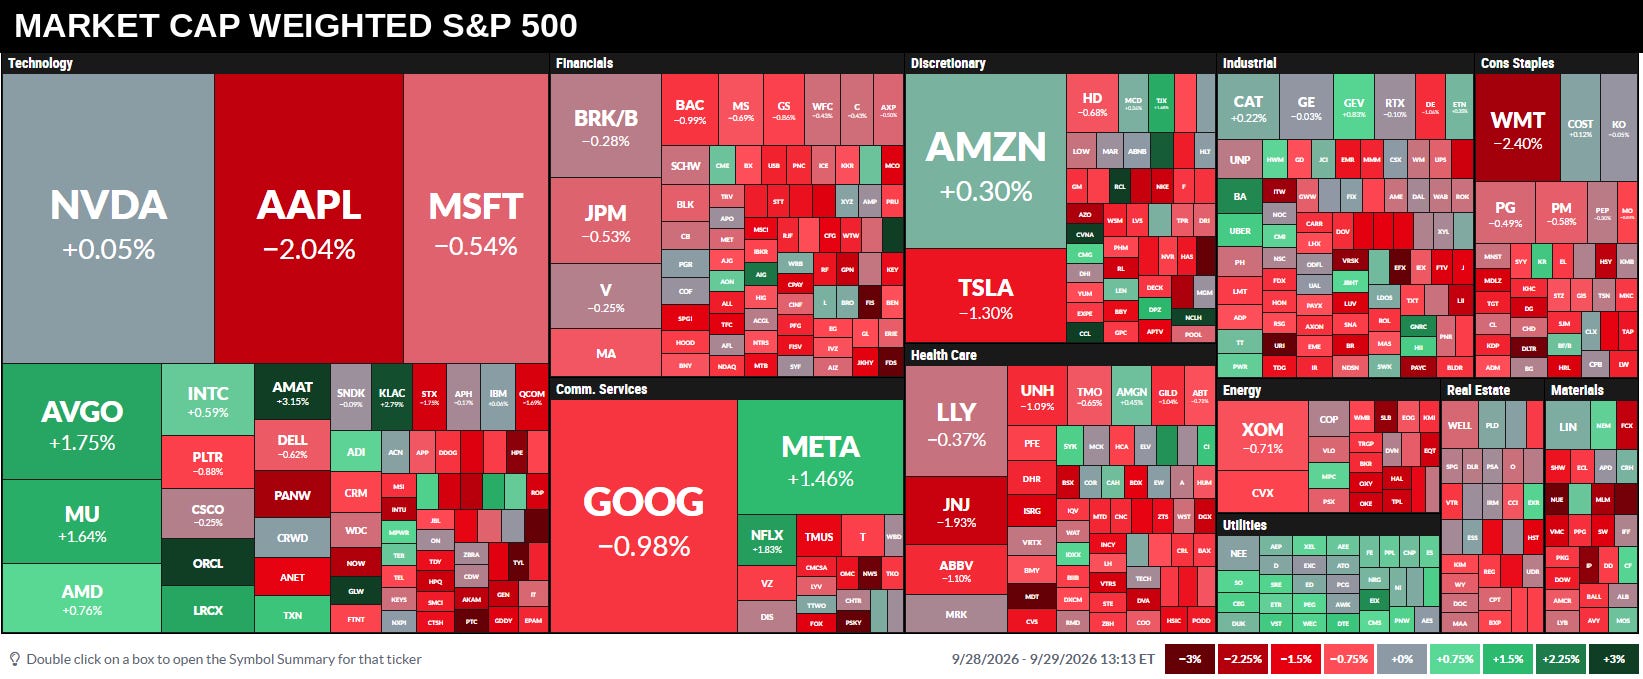
The regular S&P 500 index doesn't work that way. It's weighted by market cap, so the biggest companies, the same mega caps carrying this rally, count far more than everyone else.
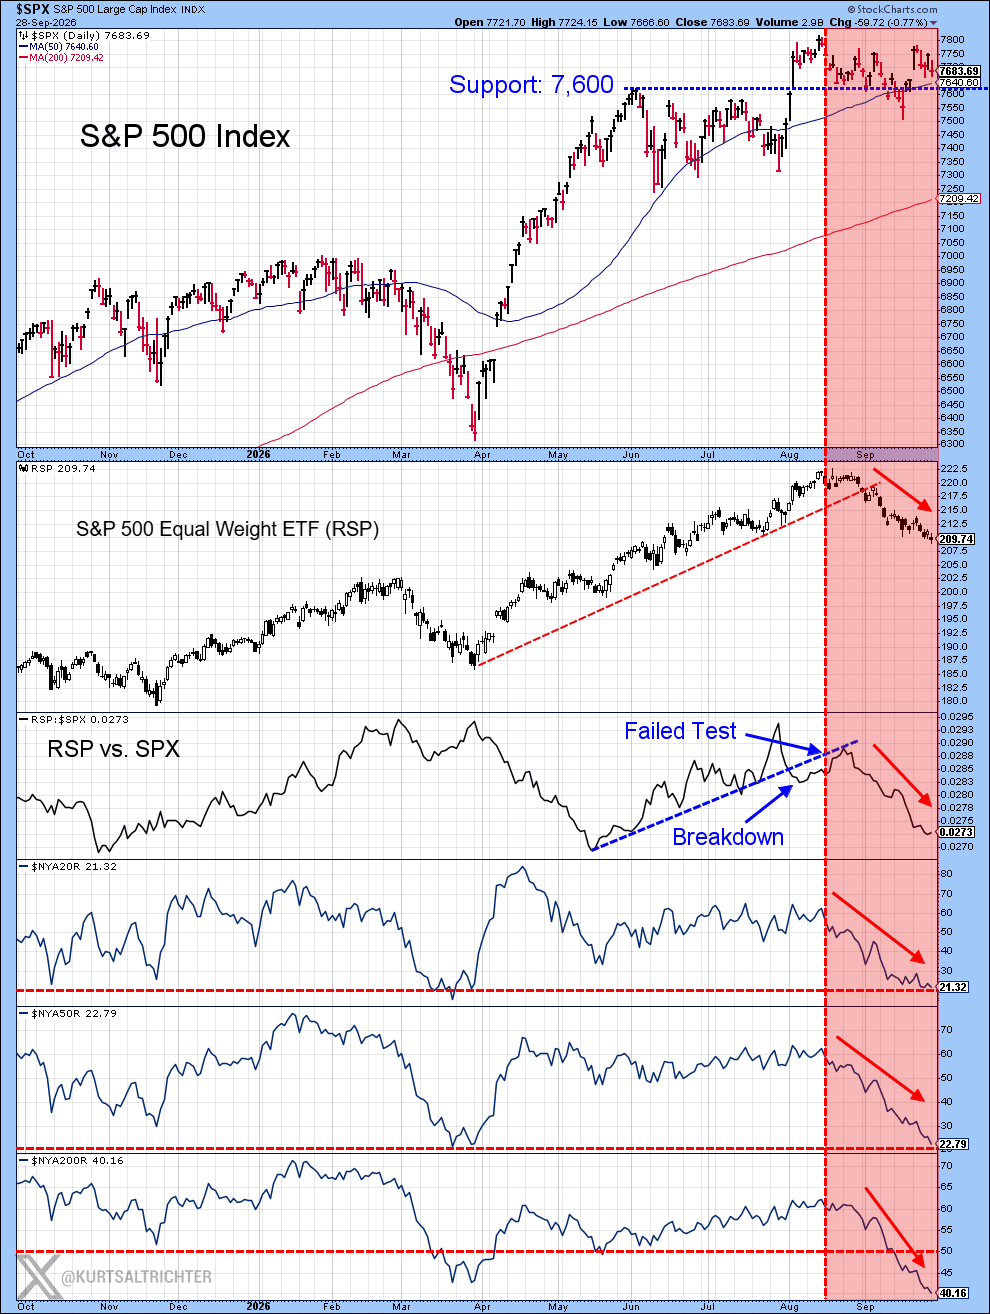
That's why the two are disagreeing. RSP peaked in mid-August, right on its own trendline, then failed to hold that level and broke down. It's down 6% since. The panel below it is a price ratio of RSP divided by the S&P 500, and that ratio made a lower high in September before breaking its own trendline too, a failed test followed by a breakdown, the same pattern showing up twice in two different ways. The bottom panels confirm it isn't just RSP: the percentage of NYSE stocks above their 20-day and 50-day averages has been falling since the same point in time; both are near oversold. The S&P 500 keeps climbing because a handful of giant stocks are heavy enough to pull the average up by themselves. The other 500-minus-a-handful are doing what RSP is doing. So right now, you are being punished for essentially holding less risk and not concentrating in the bigger names.
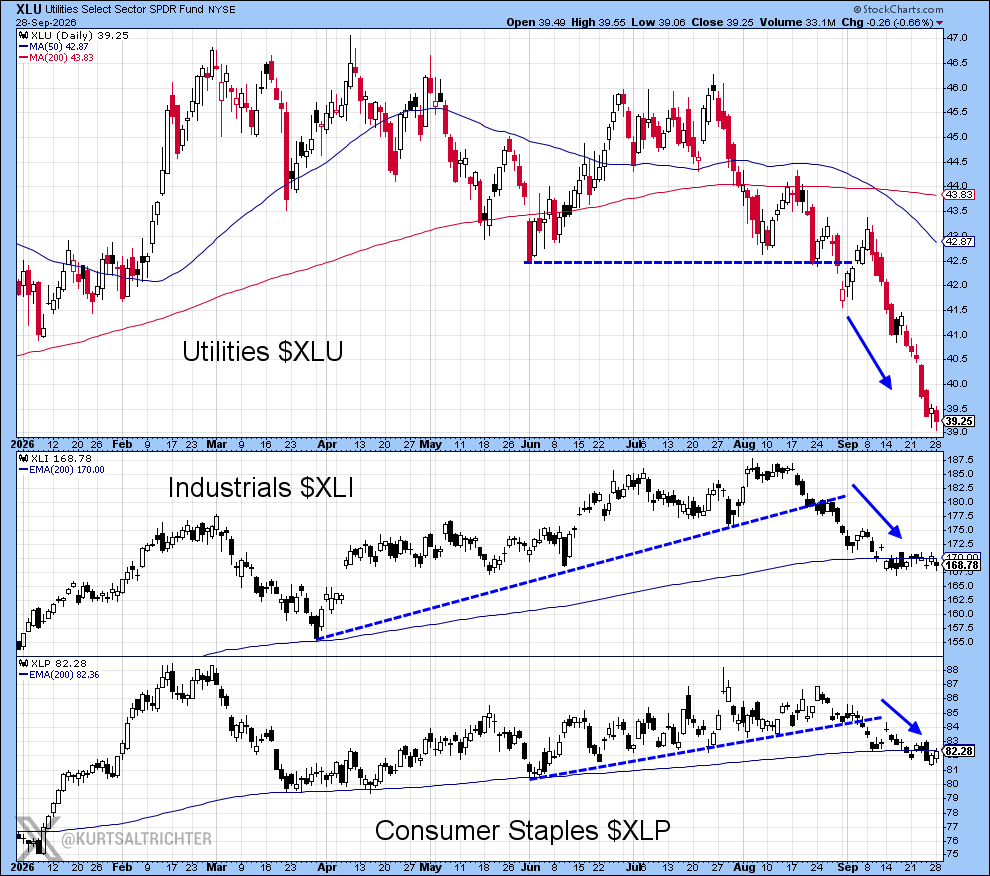
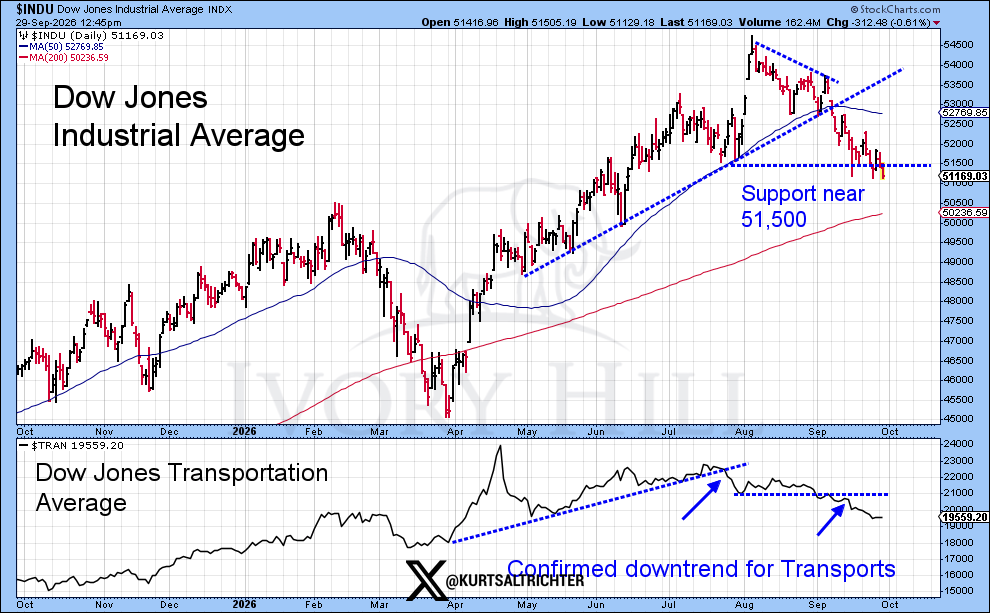
Utilities are down 8% in three weeks. Industrials broke a five-month uptrend line. Consumer staples broke the same line a week later. All three are now in decisive downtrends.
Mega caps are in the opposite direction. Same uptrend channel since April, still above both moving averages, higher lows on every dip. Oil refiners are up over 60% since June and haven’t even come close to tagging the 50-day.
Investors generally buy utilities and staples stocks for the dividend, not for earnings growth, so their stock price behaves like a bond price: it moves opposite to interest rates. These are stocks like Xcel Energy and PepsiCo. XLU currently yields about 2.99%. XLP yields about 2.67%. The 10-year Treasury is at roughly 5.2%, the highest level since 2007. Even a 3-month T-bill pays around 4.24% right now. That means an investor can buy the safest instrument in the world and collect more income than any of these stocks will pay them, with zero price risk. When that math flips, the price you’re willing to pay for the dividend stock has to come down to compete. This is not just noise; this is math. That’s a discount-rate problem, and it’s the direct, verifiable reason utility and staples stocks get repriced lower every time long-term rates climb this fast. It happened the same way in 2022, and it’s happening again now.
Industrials are a different story, and it would be wrong to force them into the same explanation. Some of the pressure is still rate-related; capital equipment and infrastructure projects get financed with debt, so higher borrowing costs squeeze the same companies from the expense side. But industrials aren’t bought for yield the way utilities are, so the dividend-versus-Treasury math doesn’t drive this one directly. The bigger issue is margin risk. Trade and tariff exposure has repeatedly hit this sector’s input costs, and industrials also carry higher valuations after a strong run, which leaves less room for error if growth expectations soften. Watch the Dow Transports here. They’re a classic early-warning read on industrial demand, and they’ve been among the weakest parts of this market. This is a growth concern layered on top of a financing-cost concern.
Cull the dead weight or remove the weak members from your portfolio. Sell or trim utilities, industrials, and consumer staples, and put that capital into mega caps, technology, and oil refiners. Why? Because rates are not coming down anytime soon.
Size refiners smaller than the other two. Mega caps and technology are trending up because of demand and earnings that build slowly and don’t reverse in a day. Refiners are trending up because of crack spreads, which move on the price of oil, and oil can gap on a single weekend headline out of the Middle East, an OPEC+ production decision, or a surprise inventory report. That’s a fast, event-driven risk sitting on top of a solid-looking chart, not a reason to skip the trade, but a reason to keep the position smaller than conviction alone would suggest.
And the breadth confirms this is not a guess. Only 40% of NYSE stocks sit above their 200-day average. Under a quarter sit above their 50-day. Most of the market has been weak for months while a small group of stocks, the same group holding the index up, kept climbing. Rotating into them isn’t fighting the tape. It’s following where the actual demand already is.
The average stock backs this up too. RSP broke its own uptrend line in September and is down 6% since. The RSP/S&P 500 ratio made a lower high and broke down right behind it. The broad market failed. The leaders didn’t.
One thing this isn’t: a call to go to cash (yet). It’s a call to stop owning what’s broken and own what’s working. Utilities, industrials, and staples need to prove they can reclaim their trend lines before they get new money again. Until then, every dollar coming out of them belongs in megacaps, technology, or refiners.
Watch 7,600 on the index. It doesn’t change the trade. It changes how aggressively you make it.
And remember - The one fact pertaining to all conditions is that they will change.
Follow me on X for more updates.
Best regards,
-Kurt
Schedule a call with me by clicking HERE
Kurt S. Altrichter, CRPS®
Fiduciary Advisor | President
Disclosure
The RiskSignal Report is published by Ivory Hill, LLC. All opinions and views expressed in this report reflect our analysis as of the date of publication and are subject to change without notice. The information contained herein is for informational and educational purposes only and should not be considered specific investment advice or a recommendation to buy or sell any security.
The data, models, and tactical allocations discussed in this report are designed to illustrate market structure and positioning trends and may differ from portfolio decisions made by Ivory Hill, LLC or its affiliates. Investing involves risk, including the possible loss of principal. Past performance is not indicative of future results.
Ivory Hill, LLC, and its members, officers, directors, and employees expressly disclaim any and all liability for actions taken based on the information contained in this report.