
Fragile Optimism
False Comfort or Real Opportunity?

ANNOUNCEMENTS
Clients: Please schedule your quarterly review by clicking HERE
We've seen a lot of selling pressure, followed by a huge rally today. It’s days like this—when the S&P 500 rips 8% in a matter of hours—that reinforce why I don't believe in going 100% to cash. Here’s the reality: our long-term signal is reactive. We raise cash as the market sells off, meaning we’re going to experience some downside. If the market continues to deteriorate, we raise more cash. All of that typically happens during periods of heavy selling.
Except for today, last week and this week, our roughly 20% equity exposure has admittedly been a drag. But it’s necessary. We keep some exposure on precisely because if the market stabilizes and turns higher, we want to participate in that recovery. Sitting in 100% cash might feel good when markets are falling apart, but it looks foolish once conditions improve and stocks rally. You have to stay positioned to capture part of that turn, because that’s what sets the stage for meaningful portfolio recovery.
From all my analysis and backtesting, the only time it truly made sense to move fully to cash was in 2008, when the banking system was at risk. I realize there’s a lot of chatter today around the bond market and concerns about the banks, but at this point, our banking system remains very healthy. There's no systemic risk on the horizon right now.
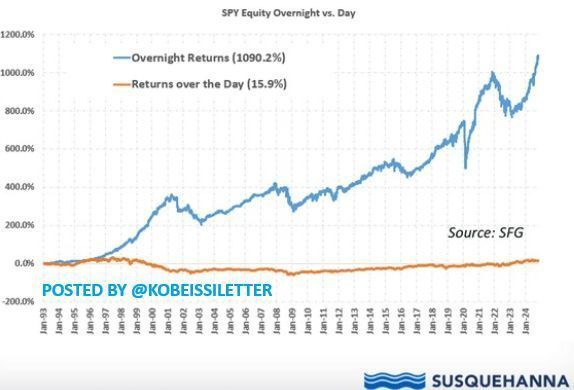
One of the strongest reasons to maintain some equity exposure is simple: over the last 30 years, the S&P 500’s gains have for the most part come from overnight trading, not during regular trading hours. Between January 1993 and January 2024, the S&P 500 ETF (SPY) delivered a 1,090.2% return overnight, compared to just 15.9% during the day—across three full decades. Staying 100% in cash means missing out on where most of the gains actually happen.
Markets have been under pressure ever since Trump’s tariff announcements. It’s important to remember that around 90% of daily trading volume today is driven by automated and computerized trading strategies. Because of that, markets tend to move in herds, and when billions of dollars are being sold at waterfall speeds, it becomes very difficult to simply wait for a bounce. Why? Because what starts as an oversold market can quickly spiral into a full-blown crash—and you don’t always get the luxury of selling into strength.
You can always get back into the market. What’s much harder is recovering after riding a full-blown crash. When selling intensifies, circuit breakers can halt trading and custodians can restrict access. If you're waiting for "the right moment," you might not get one. Risk management has to come before emotions and your cost basis.
Right now, depending on the strategy, we’re holding 70%–80% cash. That won’t feel perfect—nothing does in this kind of market. When prices fall, you’ll wish you had more cash. When they rally, you’ll wish you had more exposure. That’s normal. Staying flexible is what matters.
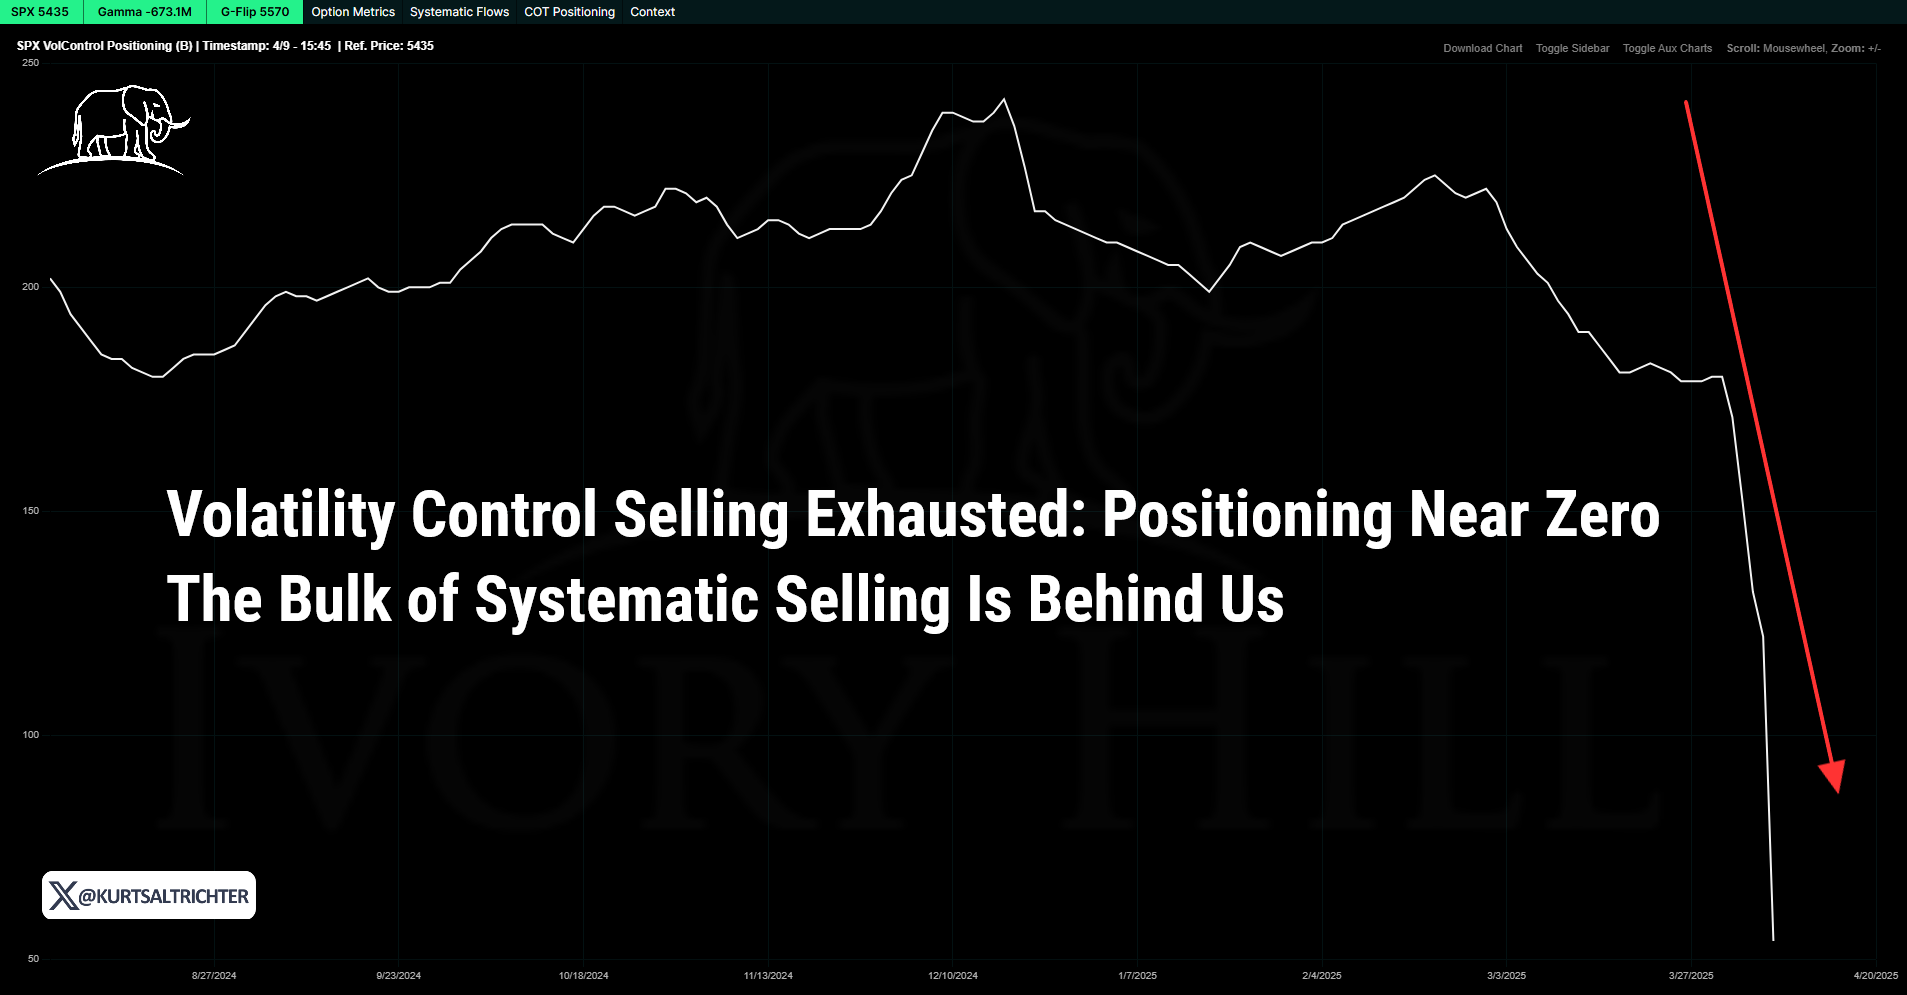
This market will repair itself faster than most expect. When the algos flip, and they will, we could see a 10% to 20% rally in days. We just saw a 9% move in a matter of hours. The turn always comes quickly. Be ready. Today’s rally looked like a textbook short-covering rally, but since it was triggered by positive news, it is tough to say for certain.

Do you want to sell everything? No, you don’t. You should want to buy. We might be getting closer to taking advantage of some great deals in the market. Today could have been the start of a new rally, but we do not know that for sure yet. This market is still in a correction, we will likely see this rally extend for a week or two before rolling over and crashing to new lows. If you bought stocks today, would you be mad at yourself five years from now? Probably not. That said, we are going to stay disciplined and wait for our signals to tell us when it is time to step back in.
Outside of our client base, I’ve spoken with more than 50 affluent investors over the past six months who have been sitting in cash since 2022. Same reasons as always—"the market is overvalued," "I don’t want to buy at all-time highs," and a dozen others. They’ve had every opportunity to start putting money to work. I doubt they have. If we see another 15% to 20% decline from here, it will create a great buying opportunity. Based on how we’re currently positioned, I would welcome that with open arms. And if your time horizon is longer than a year or two, you should be hoping for a further decline as well.
Stay optimistic. Stay focused. Stop watching the CNBC FOMO factory. Wealth is built when others are afraid of opportunity. The Trump wild card may shake the headlines, but it does not change the long-term opportunity. The investors who win are the ones who trust the future when others are afraid of it.
Turns out Fundamentals Do Matter.
Fundamentals never stop mattering — people just stop caring in bull markets. When the market’s down 20% and their stocks are down 50-60%, they remember. Fundamentals aren't for when things are easy; they’re for when reality sets in.

Several important changes have taken place in market influences since March, driven by the tariff situation. With reciprocal tariffs now paused following the President’s announcement, the market remains partially overvalued. Current valuations are built on the expectation that tariffs will continue to ease and that negotiations will hold. I believe that expectation will ultimately prove correct.
However, if that assumption fails—just as it has many times this year—the S&P 500 could still fall into the mid-to-high 4,000s before reaching fair value.

Although the market has already pulled back meaningfully, it is still not fully reflecting the underlying risks. Optimism remains embedded in stock prices, largely tied to the belief that tariffs are a short-term negotiating tactic. If that belief proves wrong, the market has much further to fall. Personally, I believe tariffs will ultimately be negotiated down, but I am not confident that the broader market understands this. Misinformation about tariffs remains widespread, and much of what is published today is inaccurate or politically charged. If you are relying on the news cycle, you are likely not getting a clear picture.

In the latest Market Expectations Table (MET), the primary influence has moved from "Tariff Threats" to "Tariff Policy," confirming that tariffs are now official. "Inflation" has also overtaken "Expected Fed Policy" as the dominant driver, given that the Fed cannot cut rates while inflation remains high—or even appears high. Inflation reports are now critical, and any upside surprise could strengthen stagflation concerns and weigh on stocks.
However, my analysis is based on what the market is signaling, not personal views. From my standpoint, inflation is unlikely to be a major headwind over the next two months. Inflation has already cooled significantly, and I expect this morning’s CPI report to come in between 2.40% and 2.61%, with a most likely reading of 2.47%.

Earnings expectations have also been adjusted lower in this month’s MET. Previously, the consensus projected S&P 500 earnings of $270 per share for 2024, but that now must be viewed as an overly optimistic scenario. A decline towards $260 per share is more realistic, considering the various headwinds U.S. corporations are facing but uncertainty is the real issue. Of course, depending on how tariffs ultimately unfold, the actual outcome could be worse or better, but those adjustments can be made in the next update if necessary.
As you might expect, the appropriate multiple for the market has also declined. In the current environment, marked by tariff uncertainty and heightened fears of recession and stagflation, a 20x–21x multiple looks almost laughable. A more reasonable range would be 18x–20x, reflecting the reality that U.S. economic growth remains resilient for now and that there is still a possibility of tariff reductions. If either of those assumptions breaks down, the market multiple would likely fall even further.
The April update to the MET makes it clear: the outlook for stocks has deteriorated meaningfully, as tariffs now pose a direct threat to both earnings expectations and the broader macroeconomic backdrop. Even after the recent declines, the S&P 500 is still not close to fair value unless tariffs are truly just a negotiating tactic—which I believe they are or will stay primarily at 10% as reported. If higher tariffs stay in place longer-term, seeing the S&P 500 drop into the mid-to-low 4,000s would not just be reasonable, it would be likely. Again, this is not just my view; it reflects how the market is currently processing the situation.

Outlook:
Conditions Improve If:
Tariffs are reduced through negotiation.
Economic growth remains resilient.
Inflation remains stable despite tariffs.
Stocks would likely experience a moderate rebound.
Conditions Get Worse:
Tariffs stay in place or escalate.
Economic slowdown accelerates.
Inflation and long-term inflation expectations rise.
S&P 500 would likely fall into the low-to-mid 4,000s.
Bottom Line:
The April MET update shows that the outlook for stocks has worsened significantly. Despite declines, the S&P 500 remains overvalued unless tariffs prove to be temporary. Without resolution, a deeper market decline is probable.
Lessons From Past Recessions - Four Technical Indicators to Watch
As I've been pointing out for some time now, this market has an 85% correlation with the summer of 2007. After analyzing the strongest correlations, I've narrowed it down to four key technical indicators that are critical to watch closely.
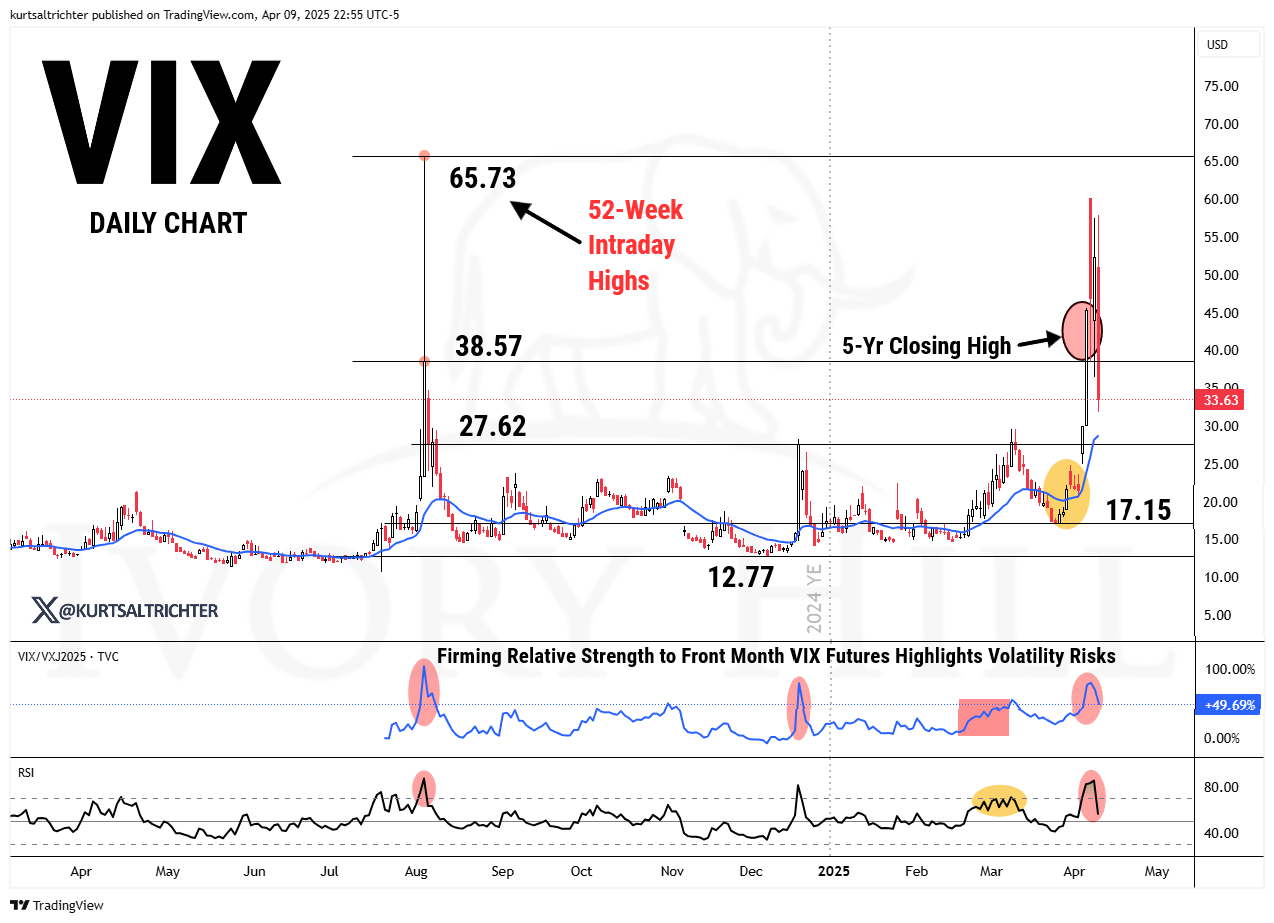
The VIX
During late-cycle phases, the VIX typically stays low, forming a pattern of lower highs as investor complacency sets in, with a growing number of short-volatility trades in response to resilient equity markets. Notably, each recent recessionary bear market has been preceded by the VIX reaching a 52-week high.
Recession Signal Triggered: August 2nd, 2024
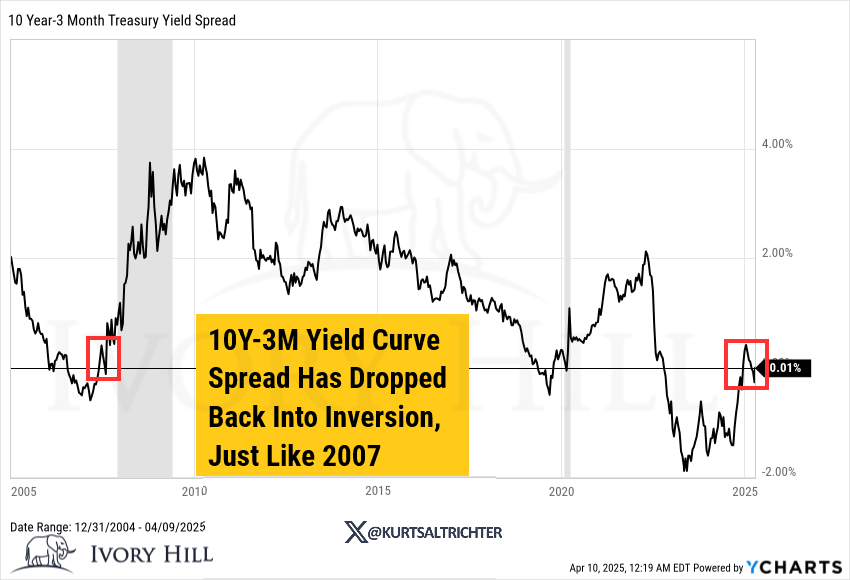
The Yield Curve
An inverted yield curve during an equity bull market should not be overlooked, but it’s also not an immediate reason to sell, as significant cyclical bull market gains often happen during these inversions. The key recession signal to focus on is rapid bull steepening in the 10Y-3M spread.
No recession signal triggered.
Credit Spreads
Historically, credit spreads have been a valuable indicator for equity investors, as tightening often reflects strong risk-on flows into stocks and high-yield corporate bonds. However, a sharp widening to 52-week highs in credit spreads serves as a key warning sign of a potential recession.
Recession Signal Triggered: April 2nd, 2025

S&P 500 Price Pattern
The S&P 500’s price movements can provide valuable insights into whether the market is approaching a cycle peak. As the last "domino to fall," a pullback in the index, followed by an unsuccessful attempt to reclaim recently set record highs, often signals a recessionary pattern seen at market tops.
Recession Signal Triggered: March 26, 2025

Bottom line: three of the four recession signals are triggered.
And remember - The one fact pertaining to all conditions is that they will change.
Feel free to use me as a sounding board.
Best regards,
-Kurt
Schedule a call with me by clicking HERE
Kurt S. Altrichter, CRPS®
Fiduciary Advisor | President
Email: kurt@ivoryhill.com | ivoryhill.com