

The model went Risk-On two weeks ago, held Risk-On last week, and holds Risk-On again this week. That is the first time the model has held Risk-On for two straight weeks since January.
Momentum is strong, but the systematic bid could change direction on any major downside. The market structure is cleanish. The question now is whether it stays that way.
What the Market Is Pricing This Week
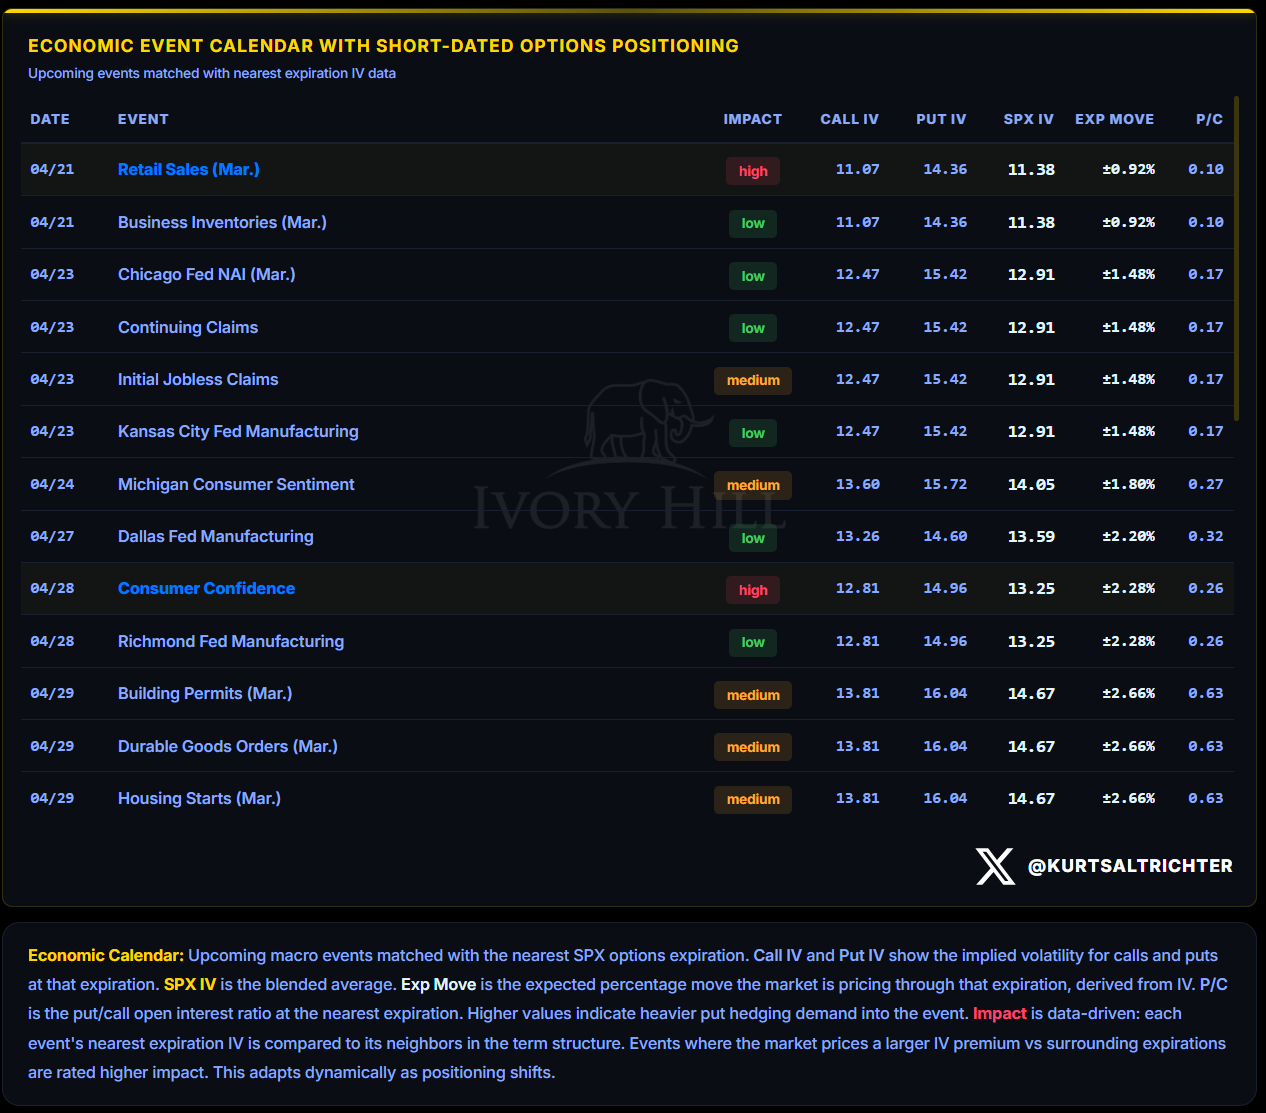
Retail Sales Tuesday is the high-impact print. The options market is pricing a ±0.92% expected move.
The rest of the week fills in around it. Jobless claims Thursday at ±1.48%. Michigan sentiment Friday at ±1.80%. Individually, none of them moves the structure. Stacked together, they create multiple windows in which a surprise print could reintroduce volatility that the options market is clearly not pricing in. Right now, I think the market is much more focused on Iran.
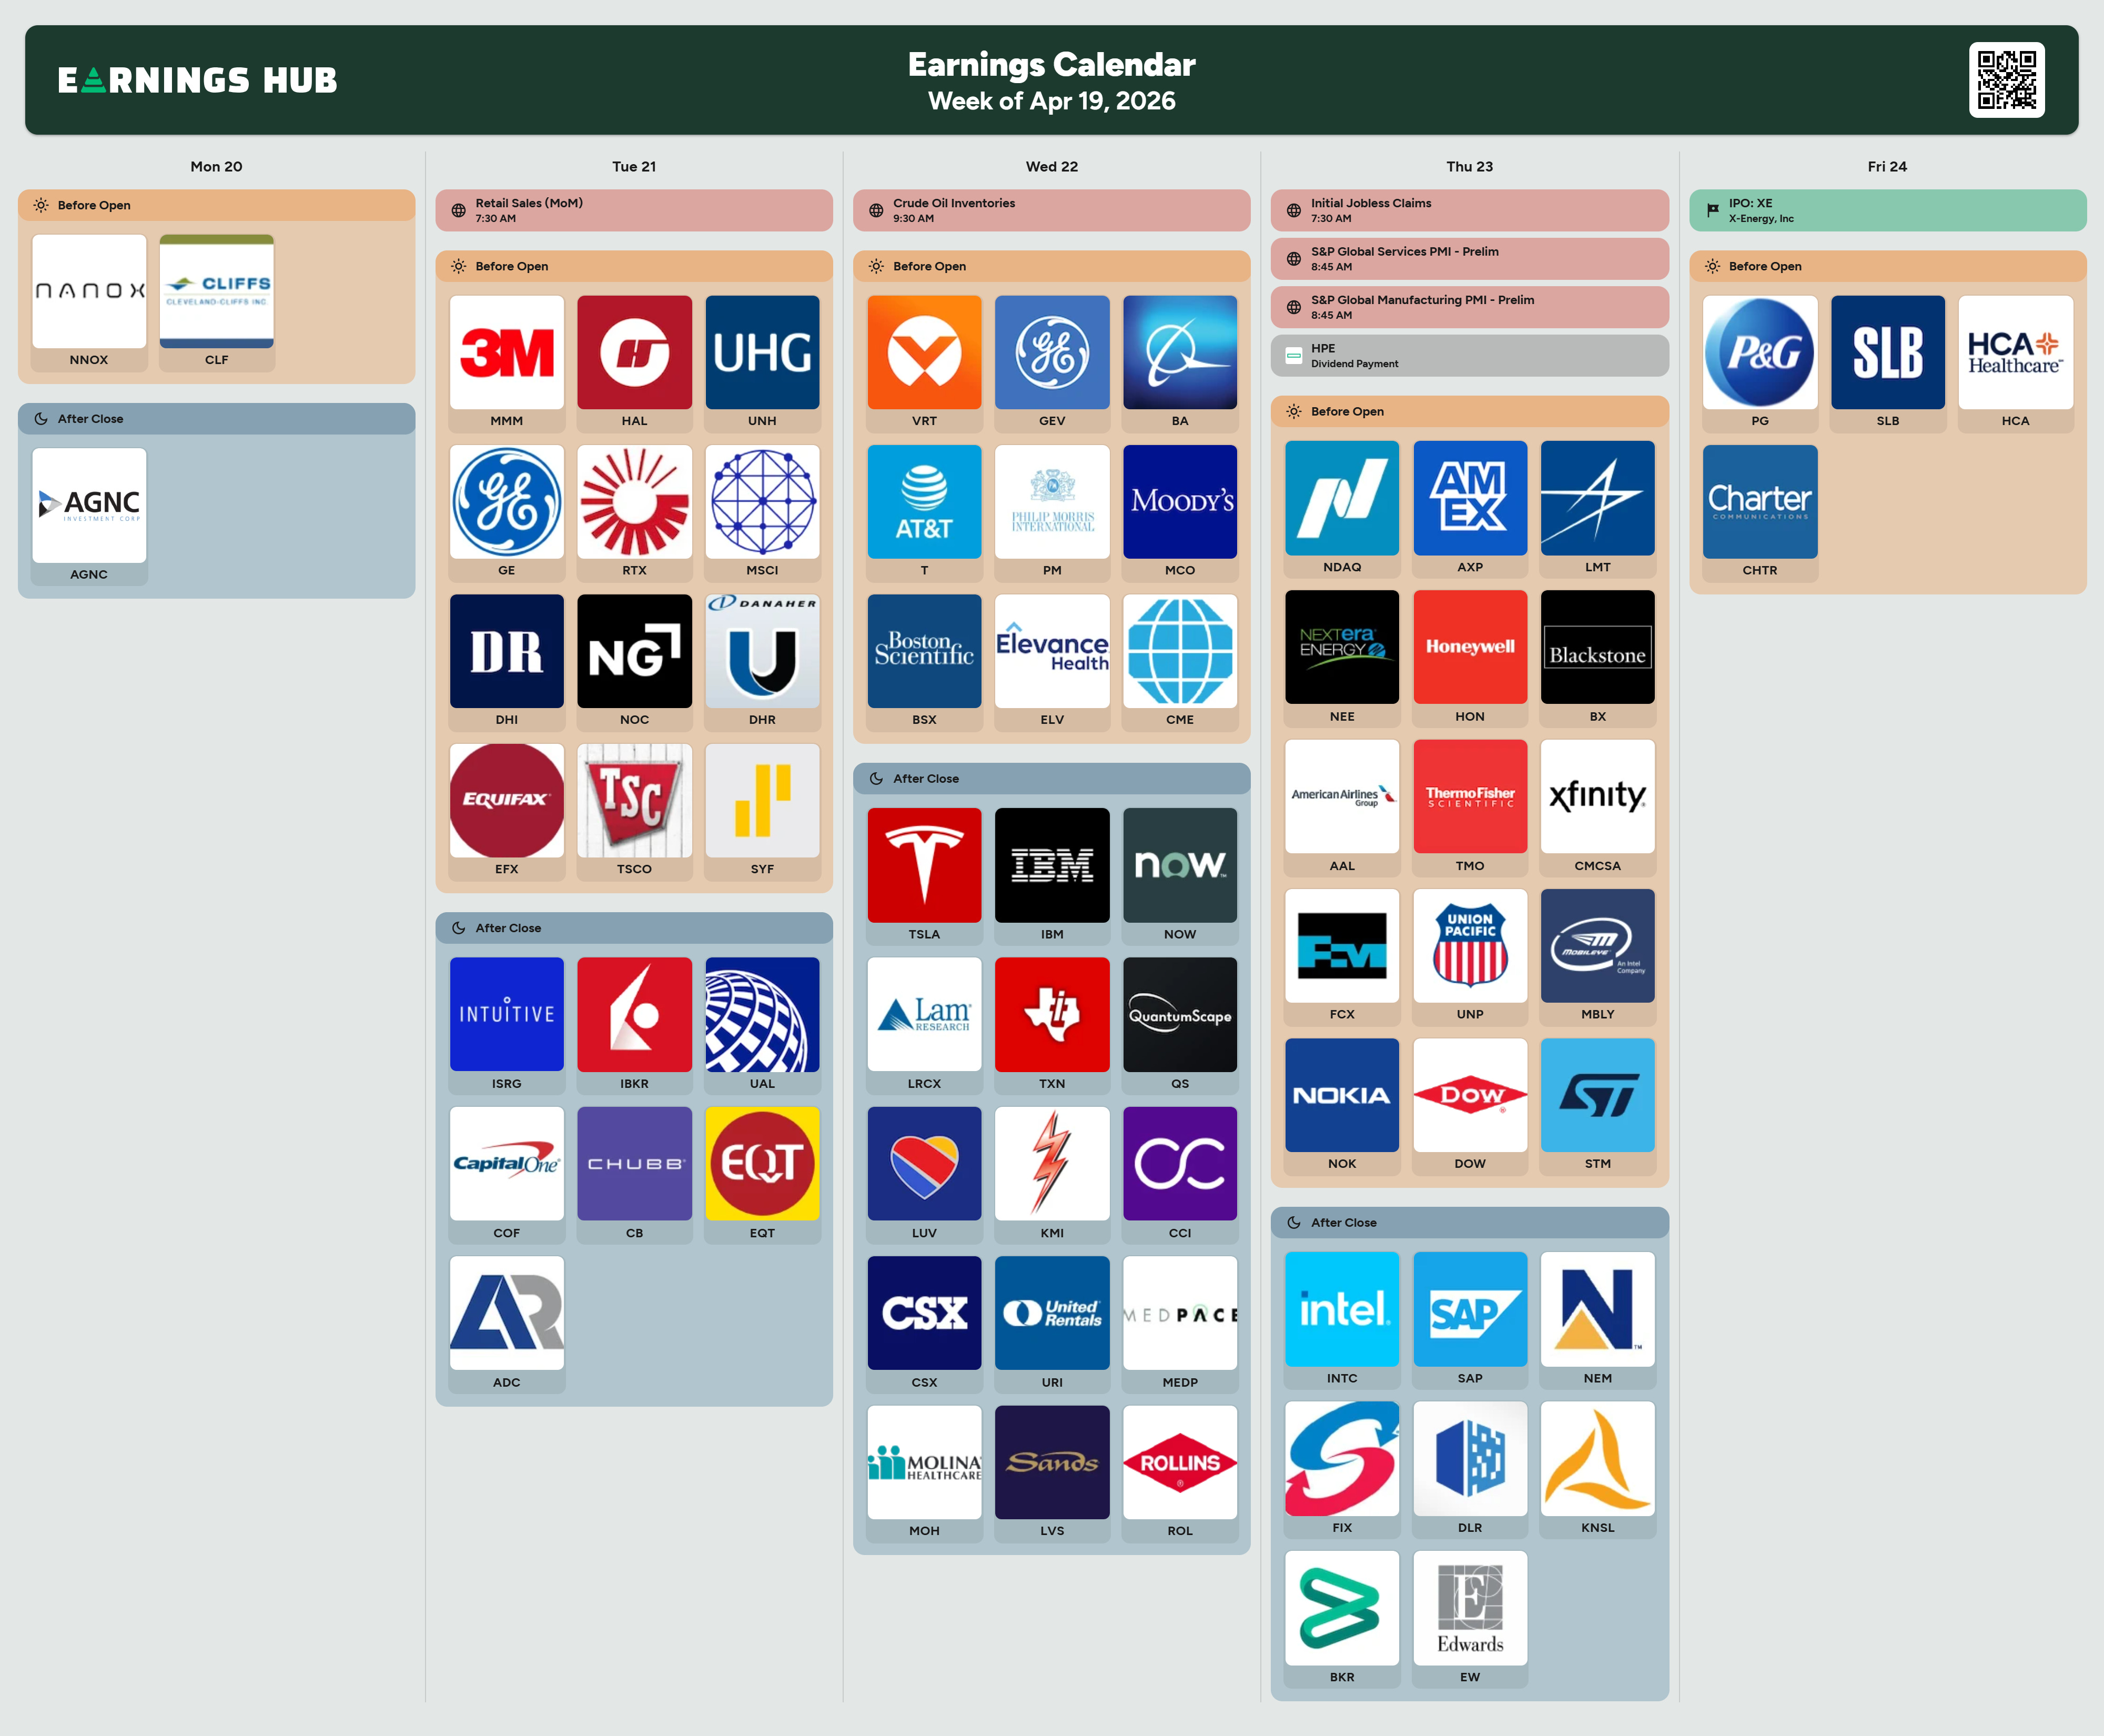
This is a heavy week. Roughly a quarter of the S&P 500 by market cap reports between Tuesday and Thursday.
The names that can move the tape:
TSLA 0.00%↑ Wednesday after close
INTC 0.00%↑ Thursday after close
Industrials on Tuesday: GE 0.00%↑ RTX 0.00%↑ HON 0.00%↑
Healthcare on Tuesday: UNH 0.00%↑
Financials throughout the week: AXP 0.00%↑ BX 0.00%↑ COF 0.00%↑
Single prints rarely change regime. A sector-wide miss across industrials or healthcare could shift breadth readings quickly, and breadth is the signal currently doing the most work.
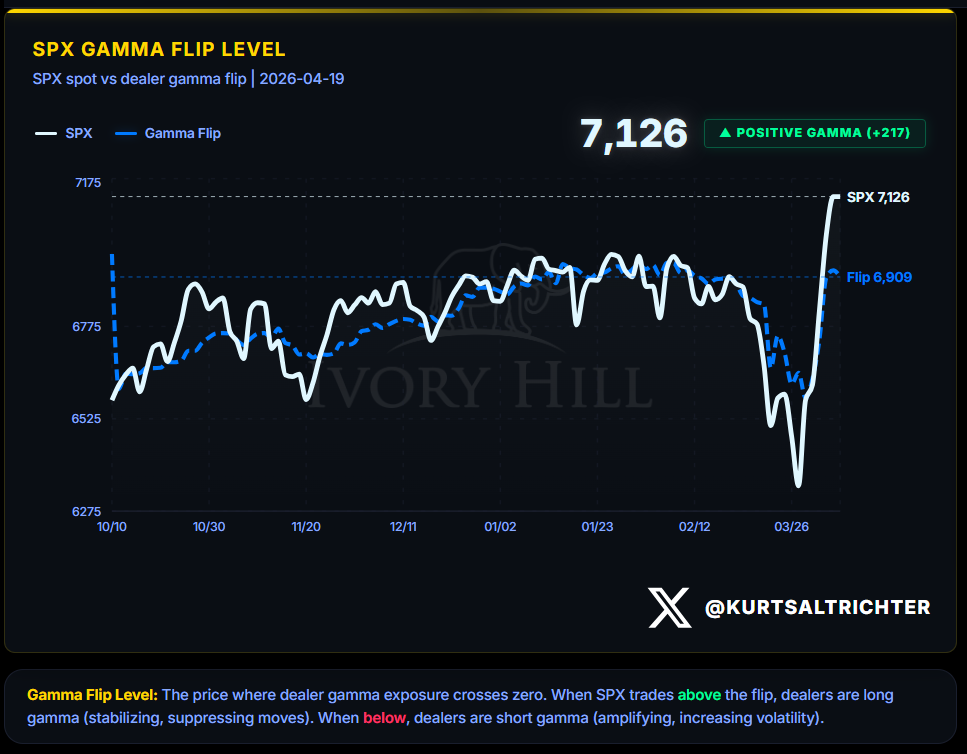
Dealer Gamma and Market Structure
The S&P 500 is sitting comfortably above the gamma flip line. The cushion is the widest it has been since late January.
Above the flip, dealers sell strength and buy weakness.
The flip line itself is rising. A rising flip with price holding above it means dealer positioning is stabilizing at progressively higher ground. That is how a durable regime gets built.
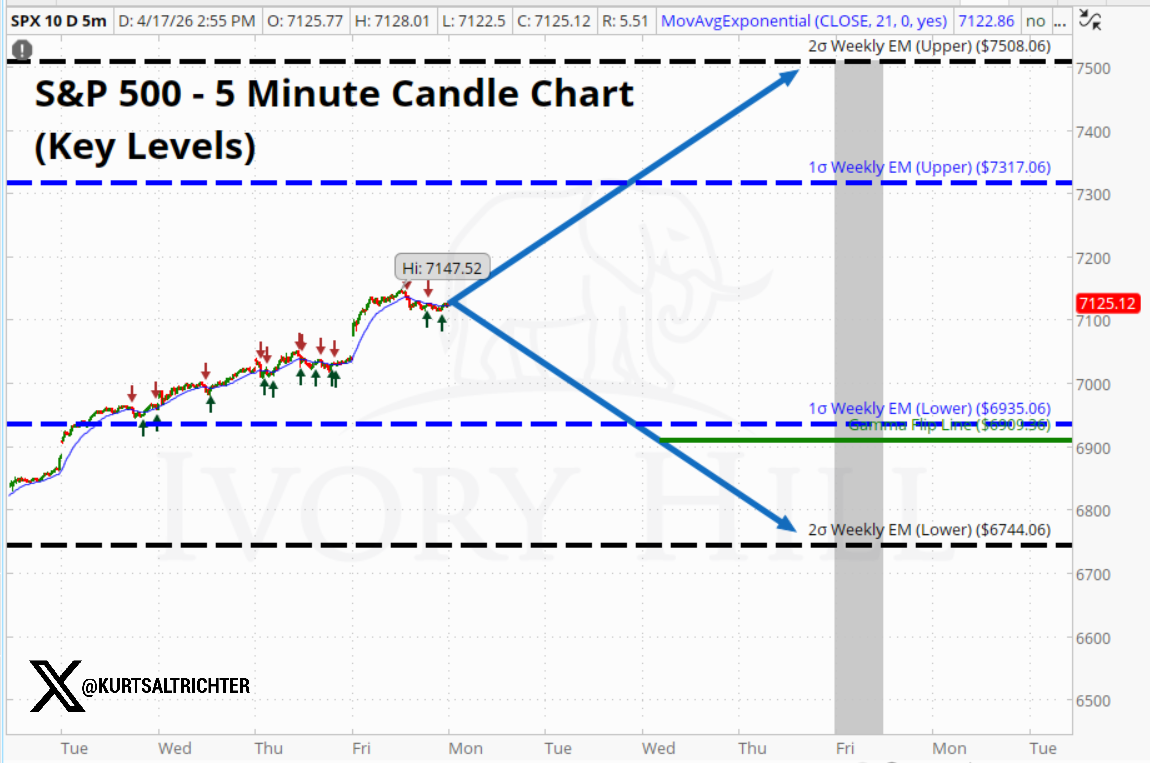
The expected moves for the week are on the above chart.
The 1-sigma (68% probability) band runs from 6,935 on the downside to 7,317 on the upside. That is roughly 2.7% in either direction. A move inside that band, up or down, is not a surprise.
The 2-sigma (95% probability) band runs from 6,744 to 7,508. That is roughly 5.4% in either direction. A move to those levels is rare, but we are in rare times, and this is what the market considers a statistically plausible week.
The line that actually matters is 6,935. That is the 1-sigma lower band, and it sits right on top of the gamma flip at 6,909. If SPX loses 6,935 this week, we are mechanically back in negative gamma territory, and the regime flips.
Realized Volatility and Vol Control
The realized volatility signal is Neutral. Short-term vol is still running above long-term vol. That spread has been narrowing, but it has not inverted yet.
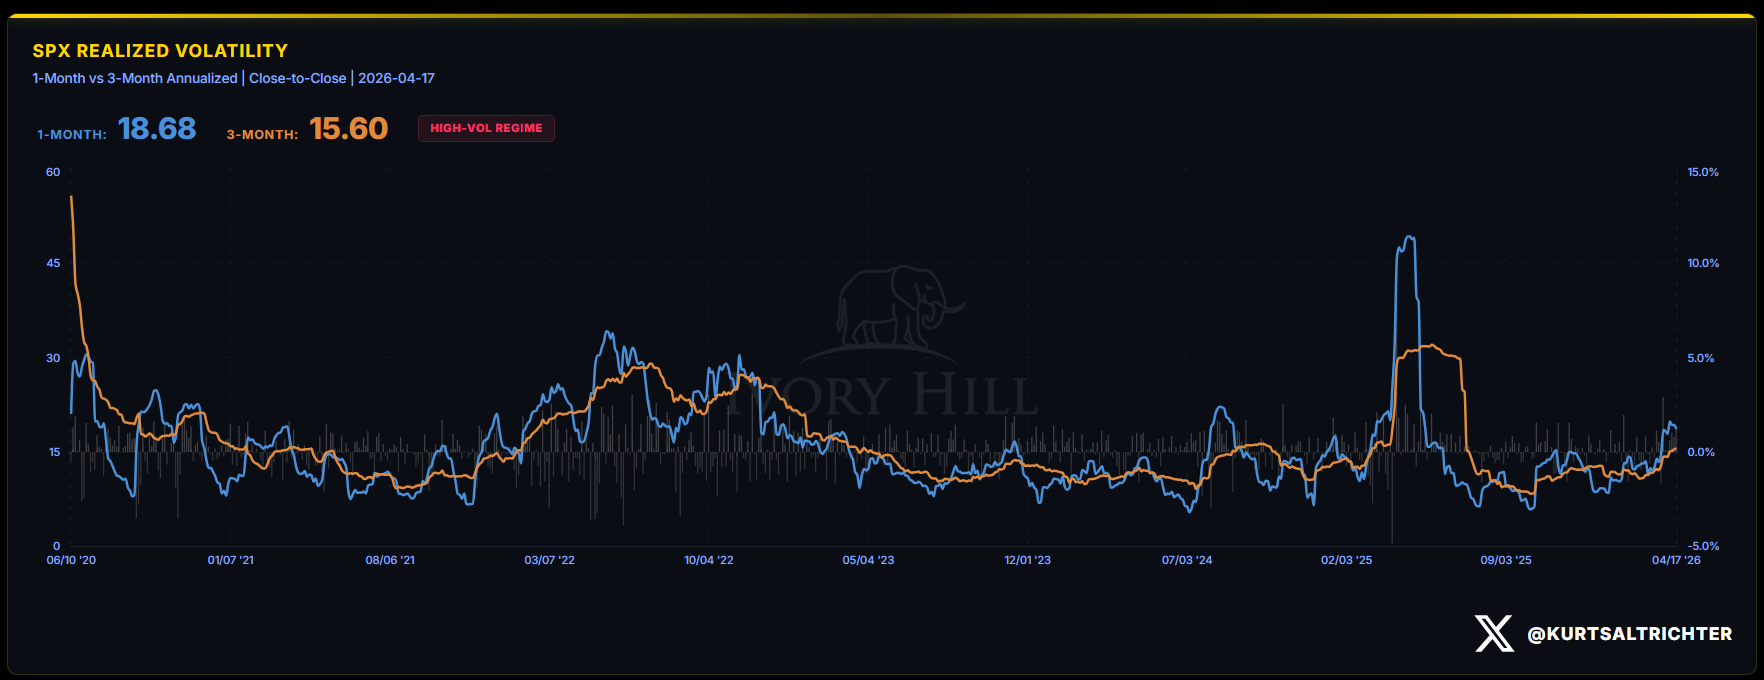
That inversion is what unlocks vol control funds. When 30-day realized vol falls below 90-day realized vol, Vol Control funds start buying. Until that line crosses, they sit on their hands.
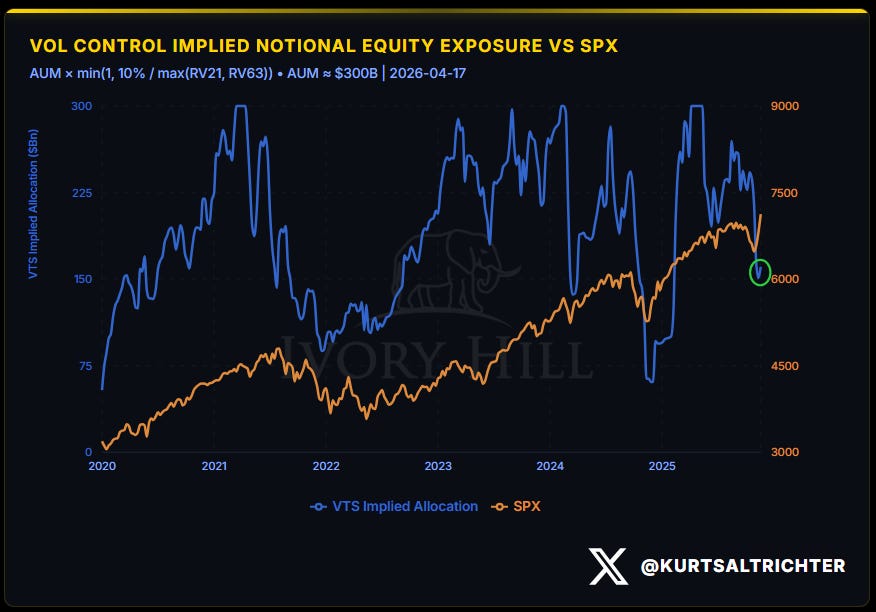
Look at the blue line on this chart. That is the implied equity allocation of vol-control funds. It is sitting near $150 billion. In late 2024 and through most of 2025, that same line was running between $225 and $300 billion. SPX is back near the highs. Vol-control exposure is not.
There is roughly $75 to $150 billion of dry powder sitting on the sidelines waiting for the 30-day to roll under the 90-day. When it does, that money does not trickle in. It comes back mechanically and all at once.
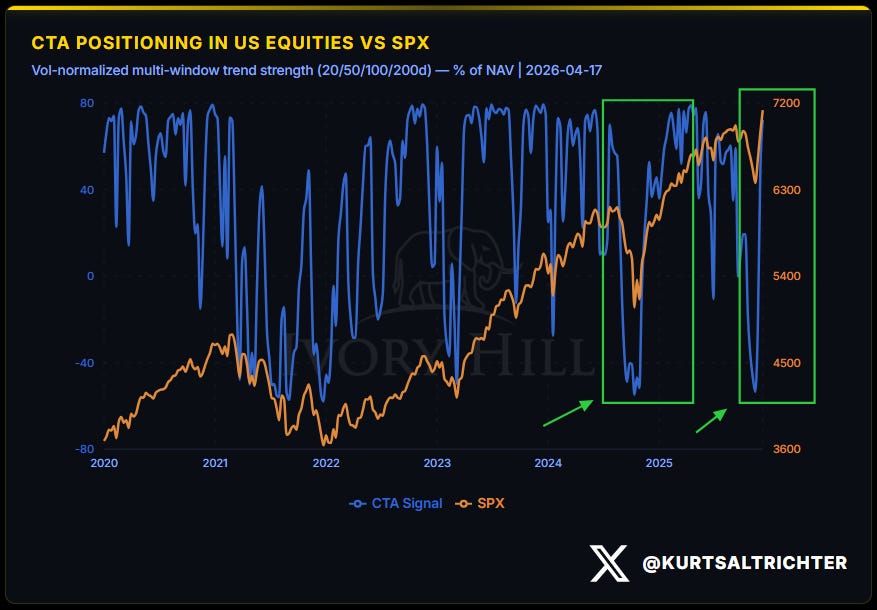
CTAs flipping from sellers to buyers is what we are watching now. The real tailwind shows up when vol-control turns into a buyer. That has not happened yet.
The setup is there. The trigger is not.
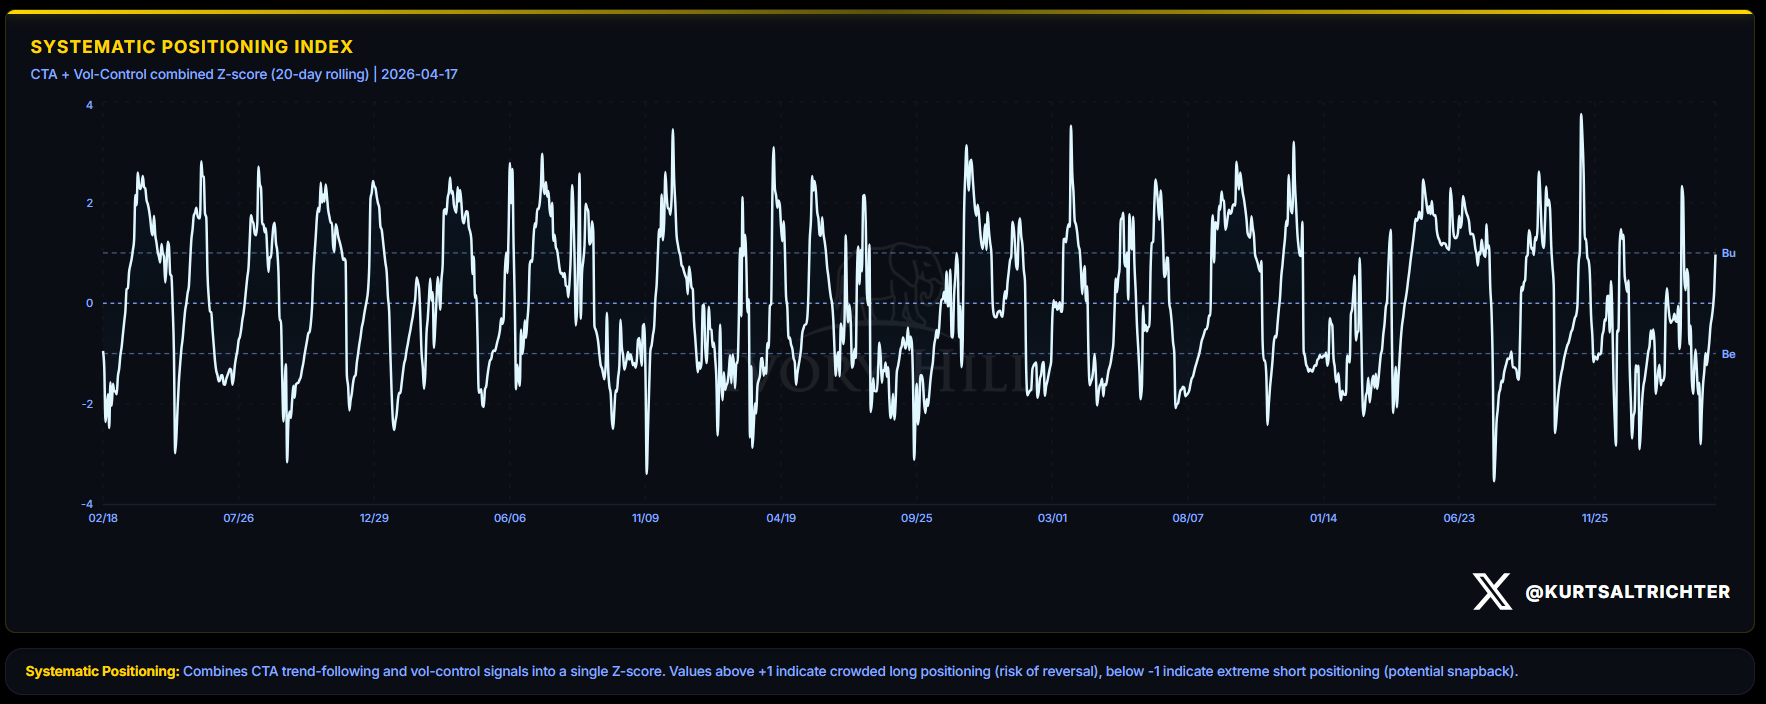
Systematic Fund Flows
The flow signal downgraded from Bullish to Neutral. The positioning data tells a different story.
The Systematic Positioning Index made a two-standard-deviation swing in a single week. A week ago it sat at -1, in bearish territory. Today it is near +1, at the threshold of crowded long.
Any rally from here still has systematic support underneath it. What is missing is fresh fuel.
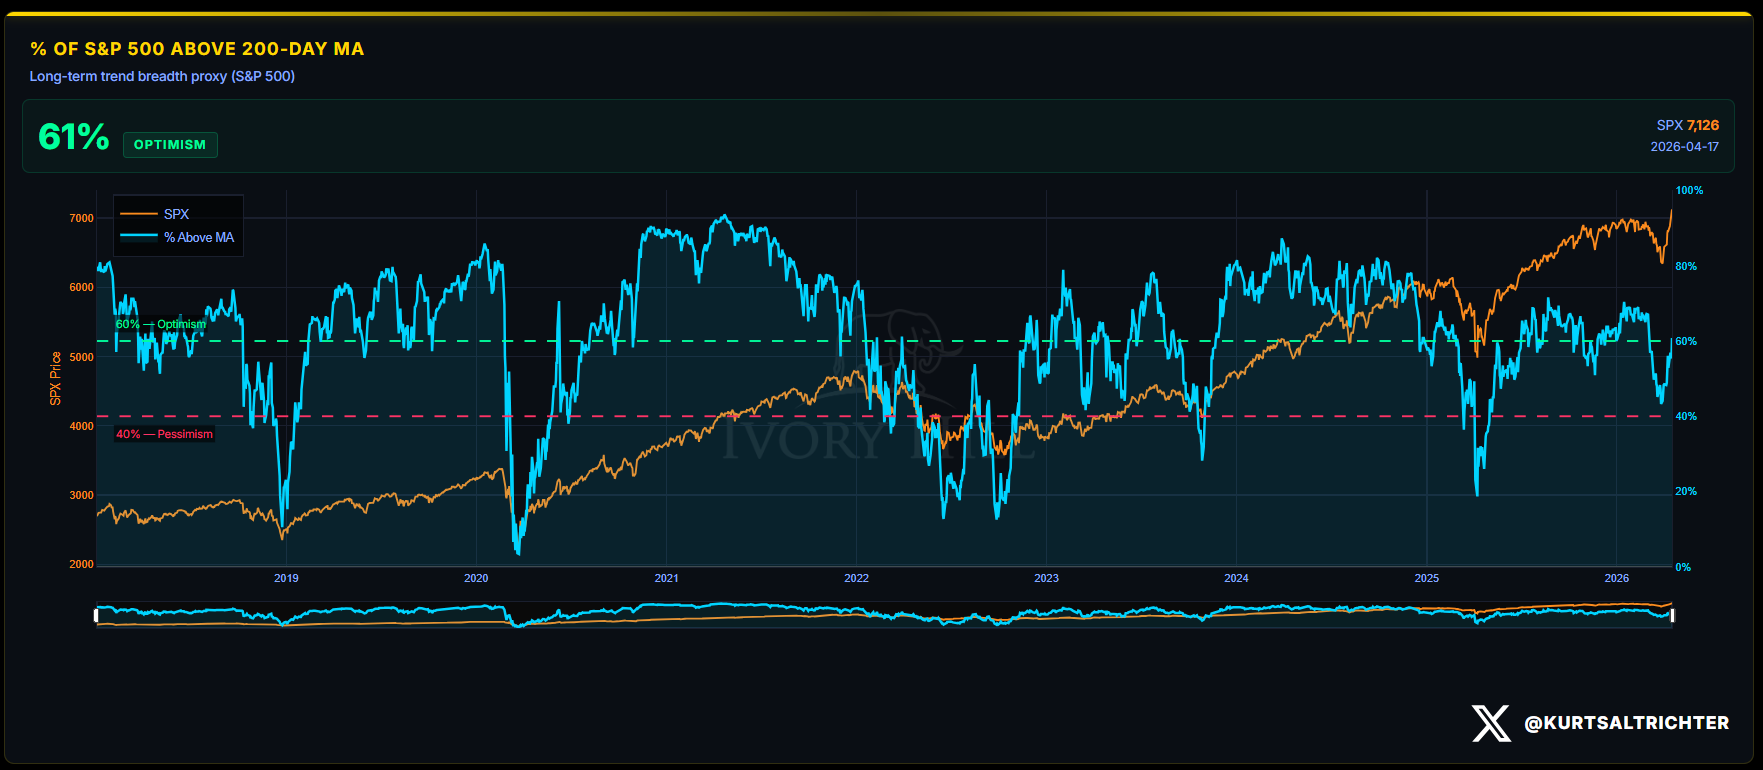
Breadth and Participation
Breadth upgraded to Bullish.
A few weeks ago, fewer than half of the S&P 500 components were trading above their long-term trend. Today, the majority is. Participation has cleared the optimism threshold.
Narrow rallies fail. Broad rallies compound. This one is starting to broaden. But the speed at which this move has been made has me skeptical.
Composite Signal and Regime
The composite regime stays Risk-On for the second consecutive week. The allocation holds at 75% SPHB / 25% SPXL.
That is the trade-off the model accepts when gamma is positive, breadth is broad, and systematic positioning is no longer defensive.
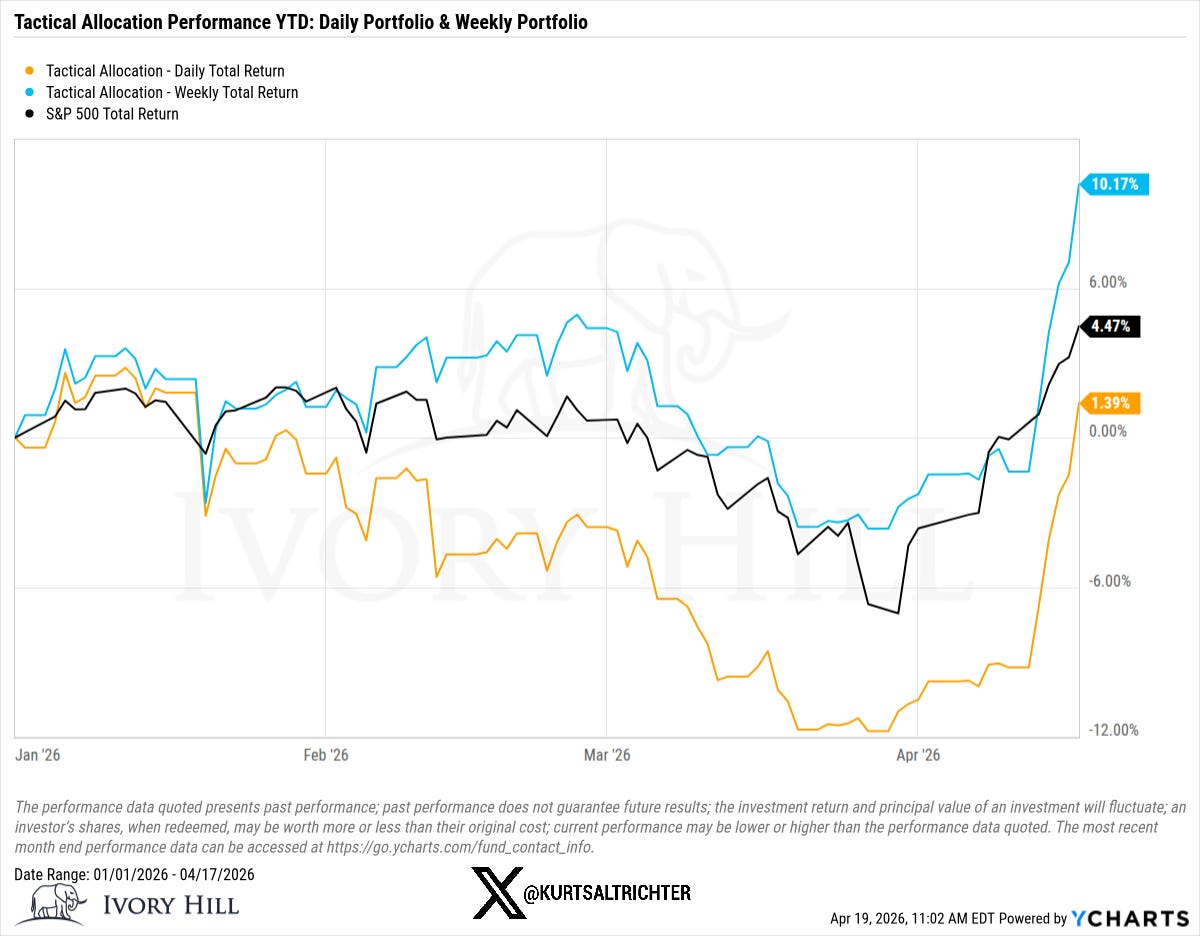
The weekly-rebalanced allocation is running ahead of the S&P 500 year to date. The daily version lagged through the March drawdown and is now recovering.
Both models are fully invested at all times. It is a regime-aware allocation that holds defensive exposure when the structure says to, and cyclical exposure when it says to.
Bottom Line
Gamma is positive and rising. Breadth is broad. Systematic positioning has swung from defensive to neutral-plus. The structure is the cleanest it has been since January.
What can still break this: a close back below the flip line, a re-expansion in realized volatility, or a macro surprise the options market is not pricing.
Tuesday’s Retail Sales print could be a minor test. Wednesday’s TSLA call is something to keep an eye on as well.
For now, the allocation reflects where the structure actually sits. Not where the headlines say it should be.
And remember - The one fact pertaining to all conditions is that they will change.
Feel free to use me as a sounding board.
Follow me on X for more updates.
Best regards,
Schedule a call with me by clicking HERE
Kurt S. Altrichter, CRPS®
Wealth Advisor | President
Disclosure
The Gamma Report is published by Ivory Hill, LLC. All opinions and views expressed in this report reflect our analysis as of the date of publication and are subject to change without notice. The information contained herein is for informational and educational purposes only and should not be considered specific investment advice or a recommendation to buy or sell any security.
The data, models, and tactical allocations discussed in this report are designed to illustrate market structure and positioning trends and may differ from portfolio decisions made by Ivory Hill, LLC or its affiliates. Investing involves risk, including the possible loss of principal. Past performance is not indicative of future results.
Ivory Hill, LLC, and its members, officers, directors, and employees expressly disclaim any and all liability for actions taken based on the information contained in this report.