

Tactical Playbook for the Week Ahead
The model holds Risk-On for the third consecutive week. The structure is clean. Momentum is still strong. Vol-control funds remain on the sidelines with $75-150 billion in dry powder. Your job this week is to stay disciplined while the market tests new highs.
THIS WEEK’S GAME PLAN
The Battlefield: Economic Events & Short-Term Vol Structure
Master this concept: The Economic Event Calendar with Short-Dated Vol Term Structure is your early warning system. When implied volatility around specific events is low relative to realized moves, surprises hurt more. When it’s high, the market has already priced in potential shocks.
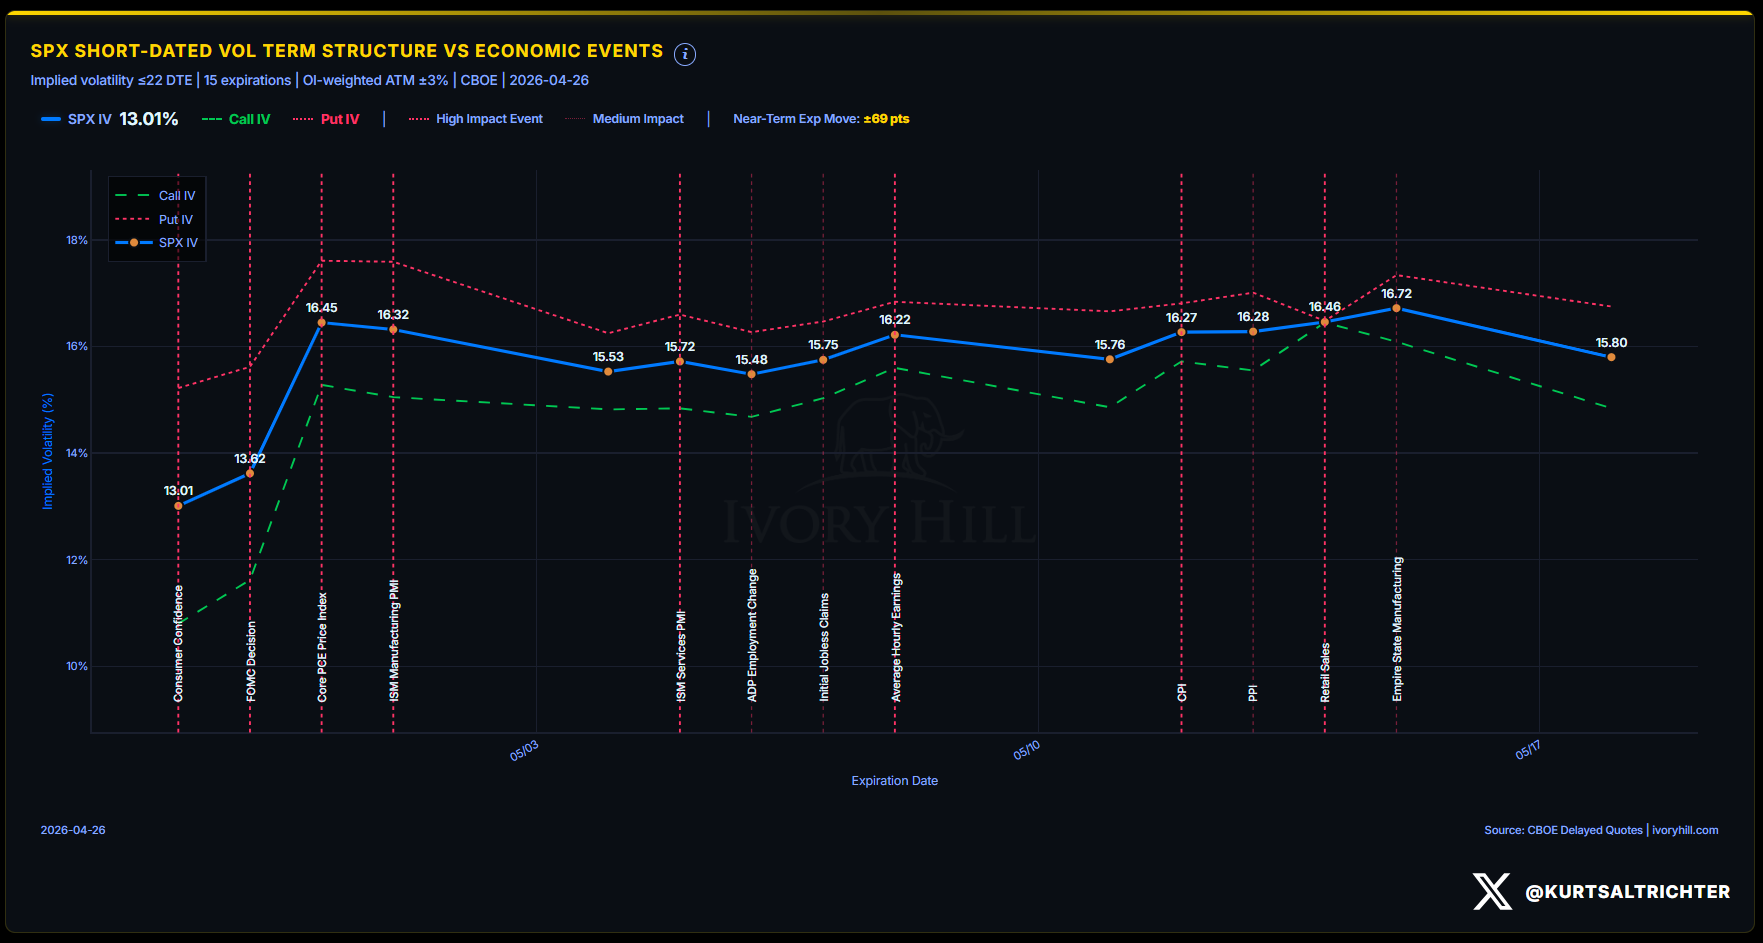
This is a chart of the SPX short-dated vol term structure, which is just a fancy way of saying how much traders expect the market to move on each upcoming date. Each dot on the blue line represents a different future expiration, with today on the far left and about three weeks out on the right. A low dot means traders think the market will be calm on that date. A high dot means they expect bigger swings. The red dotted lines mark big economic events like FOMC, CPI, and Core PCE. Look at the shape today. The first dot sits at 11.97, then it rockets up to 13.62 by FOMC, jumps to 16.45 by Core PCE, and stays around 15 to 16 for the rest of the month. That tells you traders feel calm right now but are paying up for protection on every date after. They are buying insurance for a storm they think is coming, and they think FOMC and Core PCE are where it hits. Now here is the part that trips people up. When traders are already loaded up on insurance, the storm usually does not show up. The people who were going to panic already did their panicking quietly, by hedging. There is nobody left to surprise the market with a sudden rush for the exits. That is why a short-dated vol term structure shaped like this one, sloping up and to the right, is a green light for stocks, not a warning. The chart you actually want to fear is the opposite. If today’s dot was the highest on the chart and every future dot was lower, that would mean traders are scrambling for protection right now because they got caught off guard. That is when we see downside air pockets. So when you pull up the short-dated vol term structure, look at the slope. Up and to the right, like today, means the crowd is already nervous, and you can stay long. Flat or sloping down from left to right means the panic is happening in real time, and it is time to get defensive.
This week’s key battles:
Monday 04/27: Consumer Confidence (high impact) - Market pricing ±1.18% expected move
Tuesday 04/28: Building Permits, Durable Goods, Housing Starts (medium impact cluster)
Wednesday 04/29: FOMC Decision (high impact) - Market pricing ±1.93% expected move
Thursday 04/30: Core PCE, Employment Cost Index, GDP (high impact triple threat)
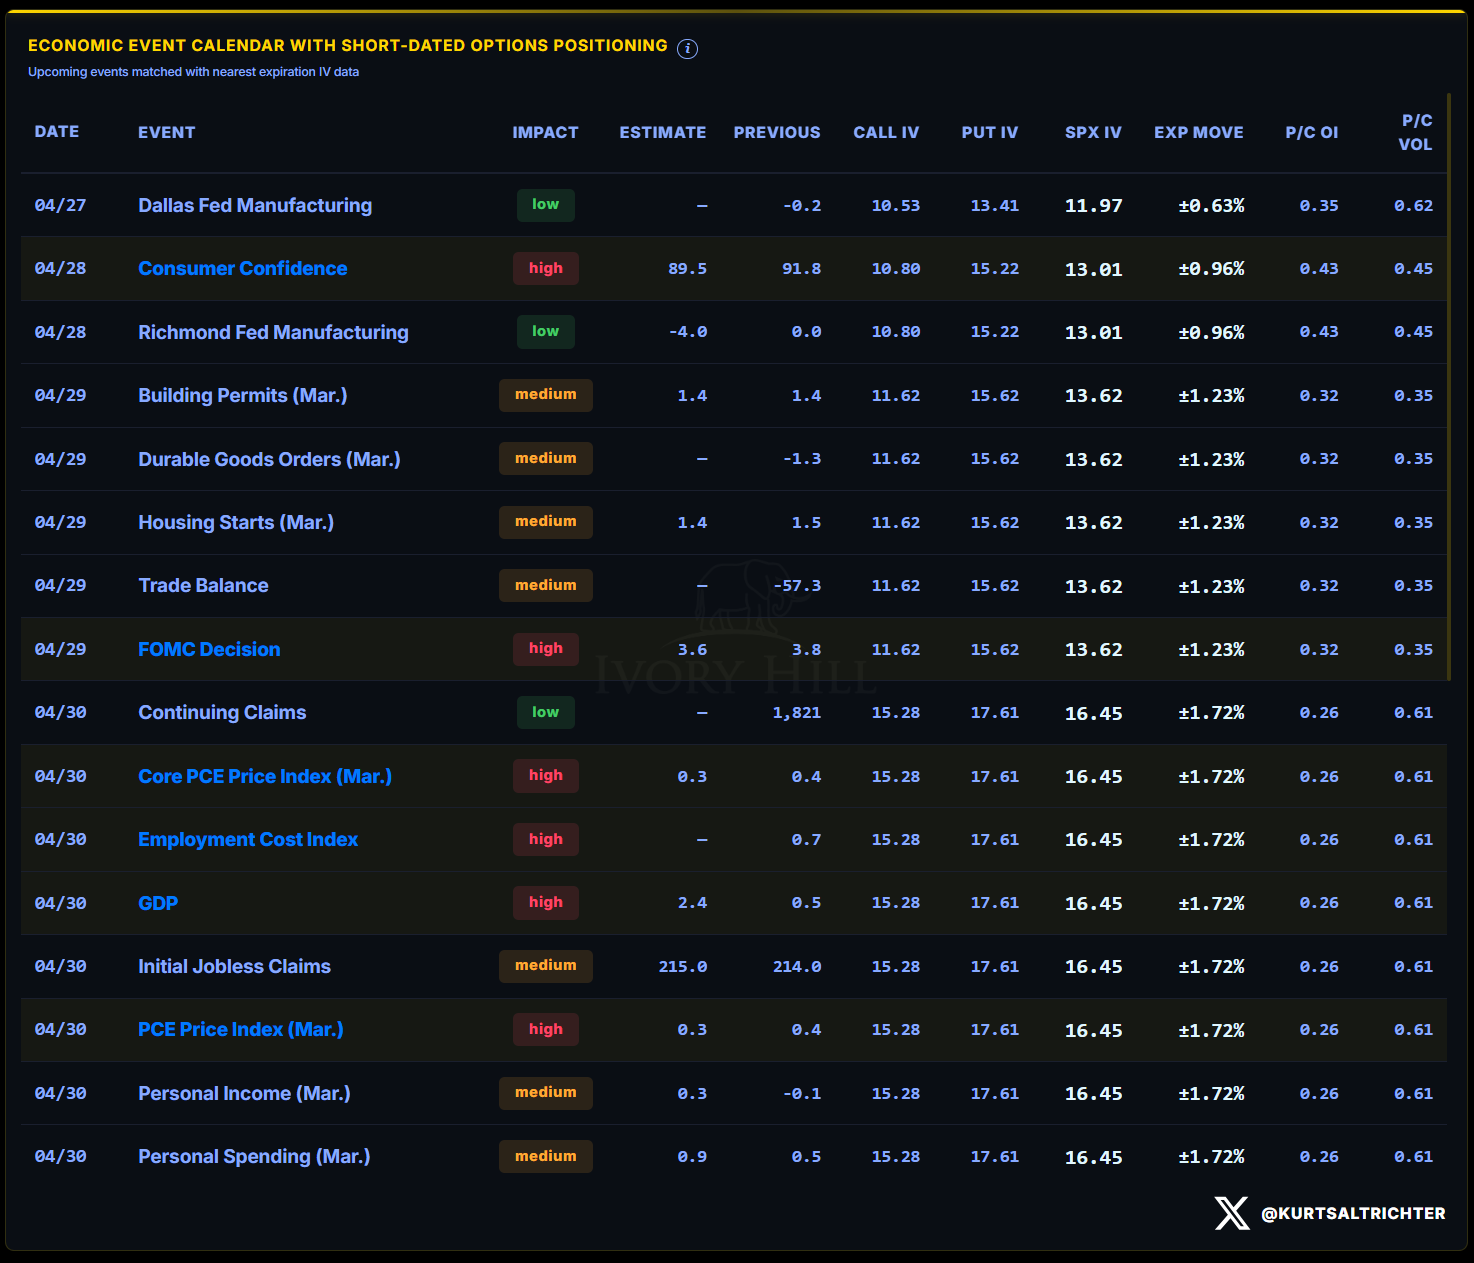
Your tactical edge: The options market is pricing low volatility around everything except the FOMC decision. Consumer Confidence on Monday could catch the market off guard if it misses significantly. Thursday's data dump has three high-impact prints in one session - any coordinated miss could spark the volatility expansion that vol-control funds are waiting for.
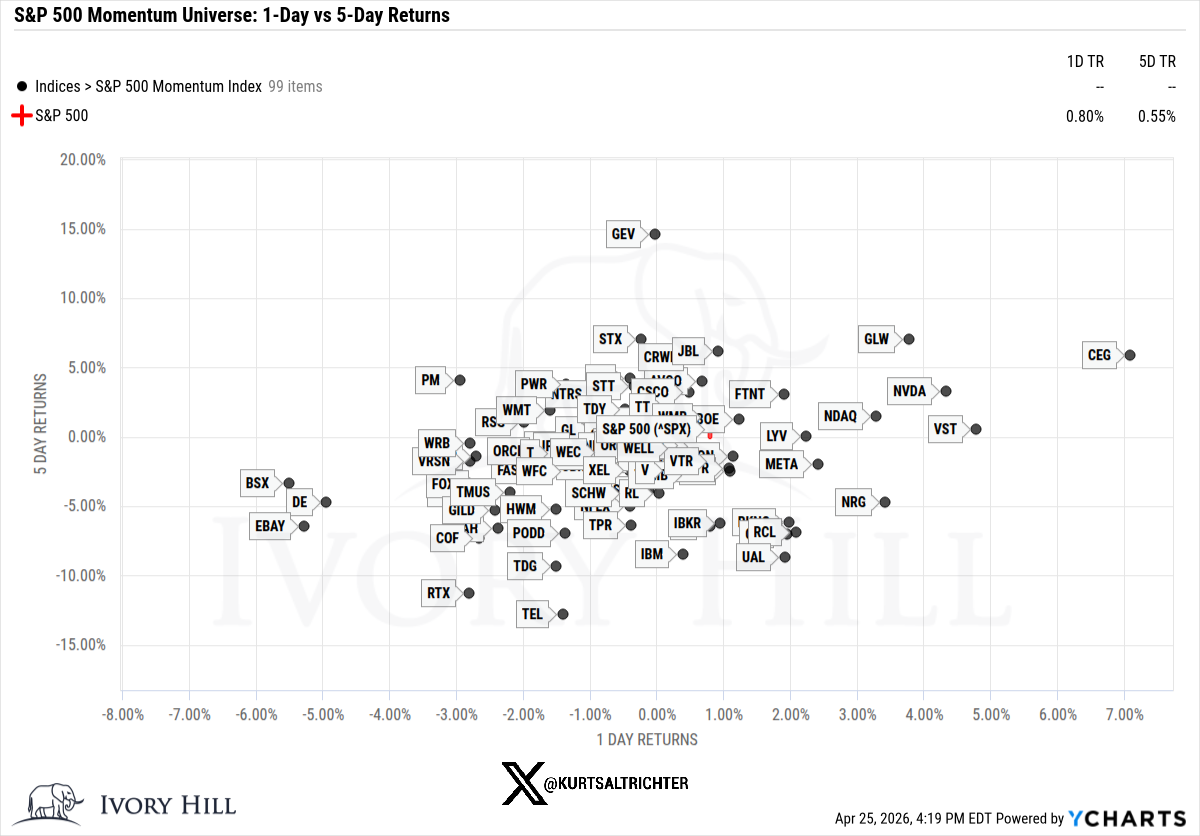
Momentum Pulse Check
The momentum picture remains constructive. GEV 0.00%↑ continues to lead the pack with a 15% move over the past five days. The broader momentum universe shows dispersion - the hallmark of a healthy rotation rather than blind momentum chasing.
Key momentum names to watch:
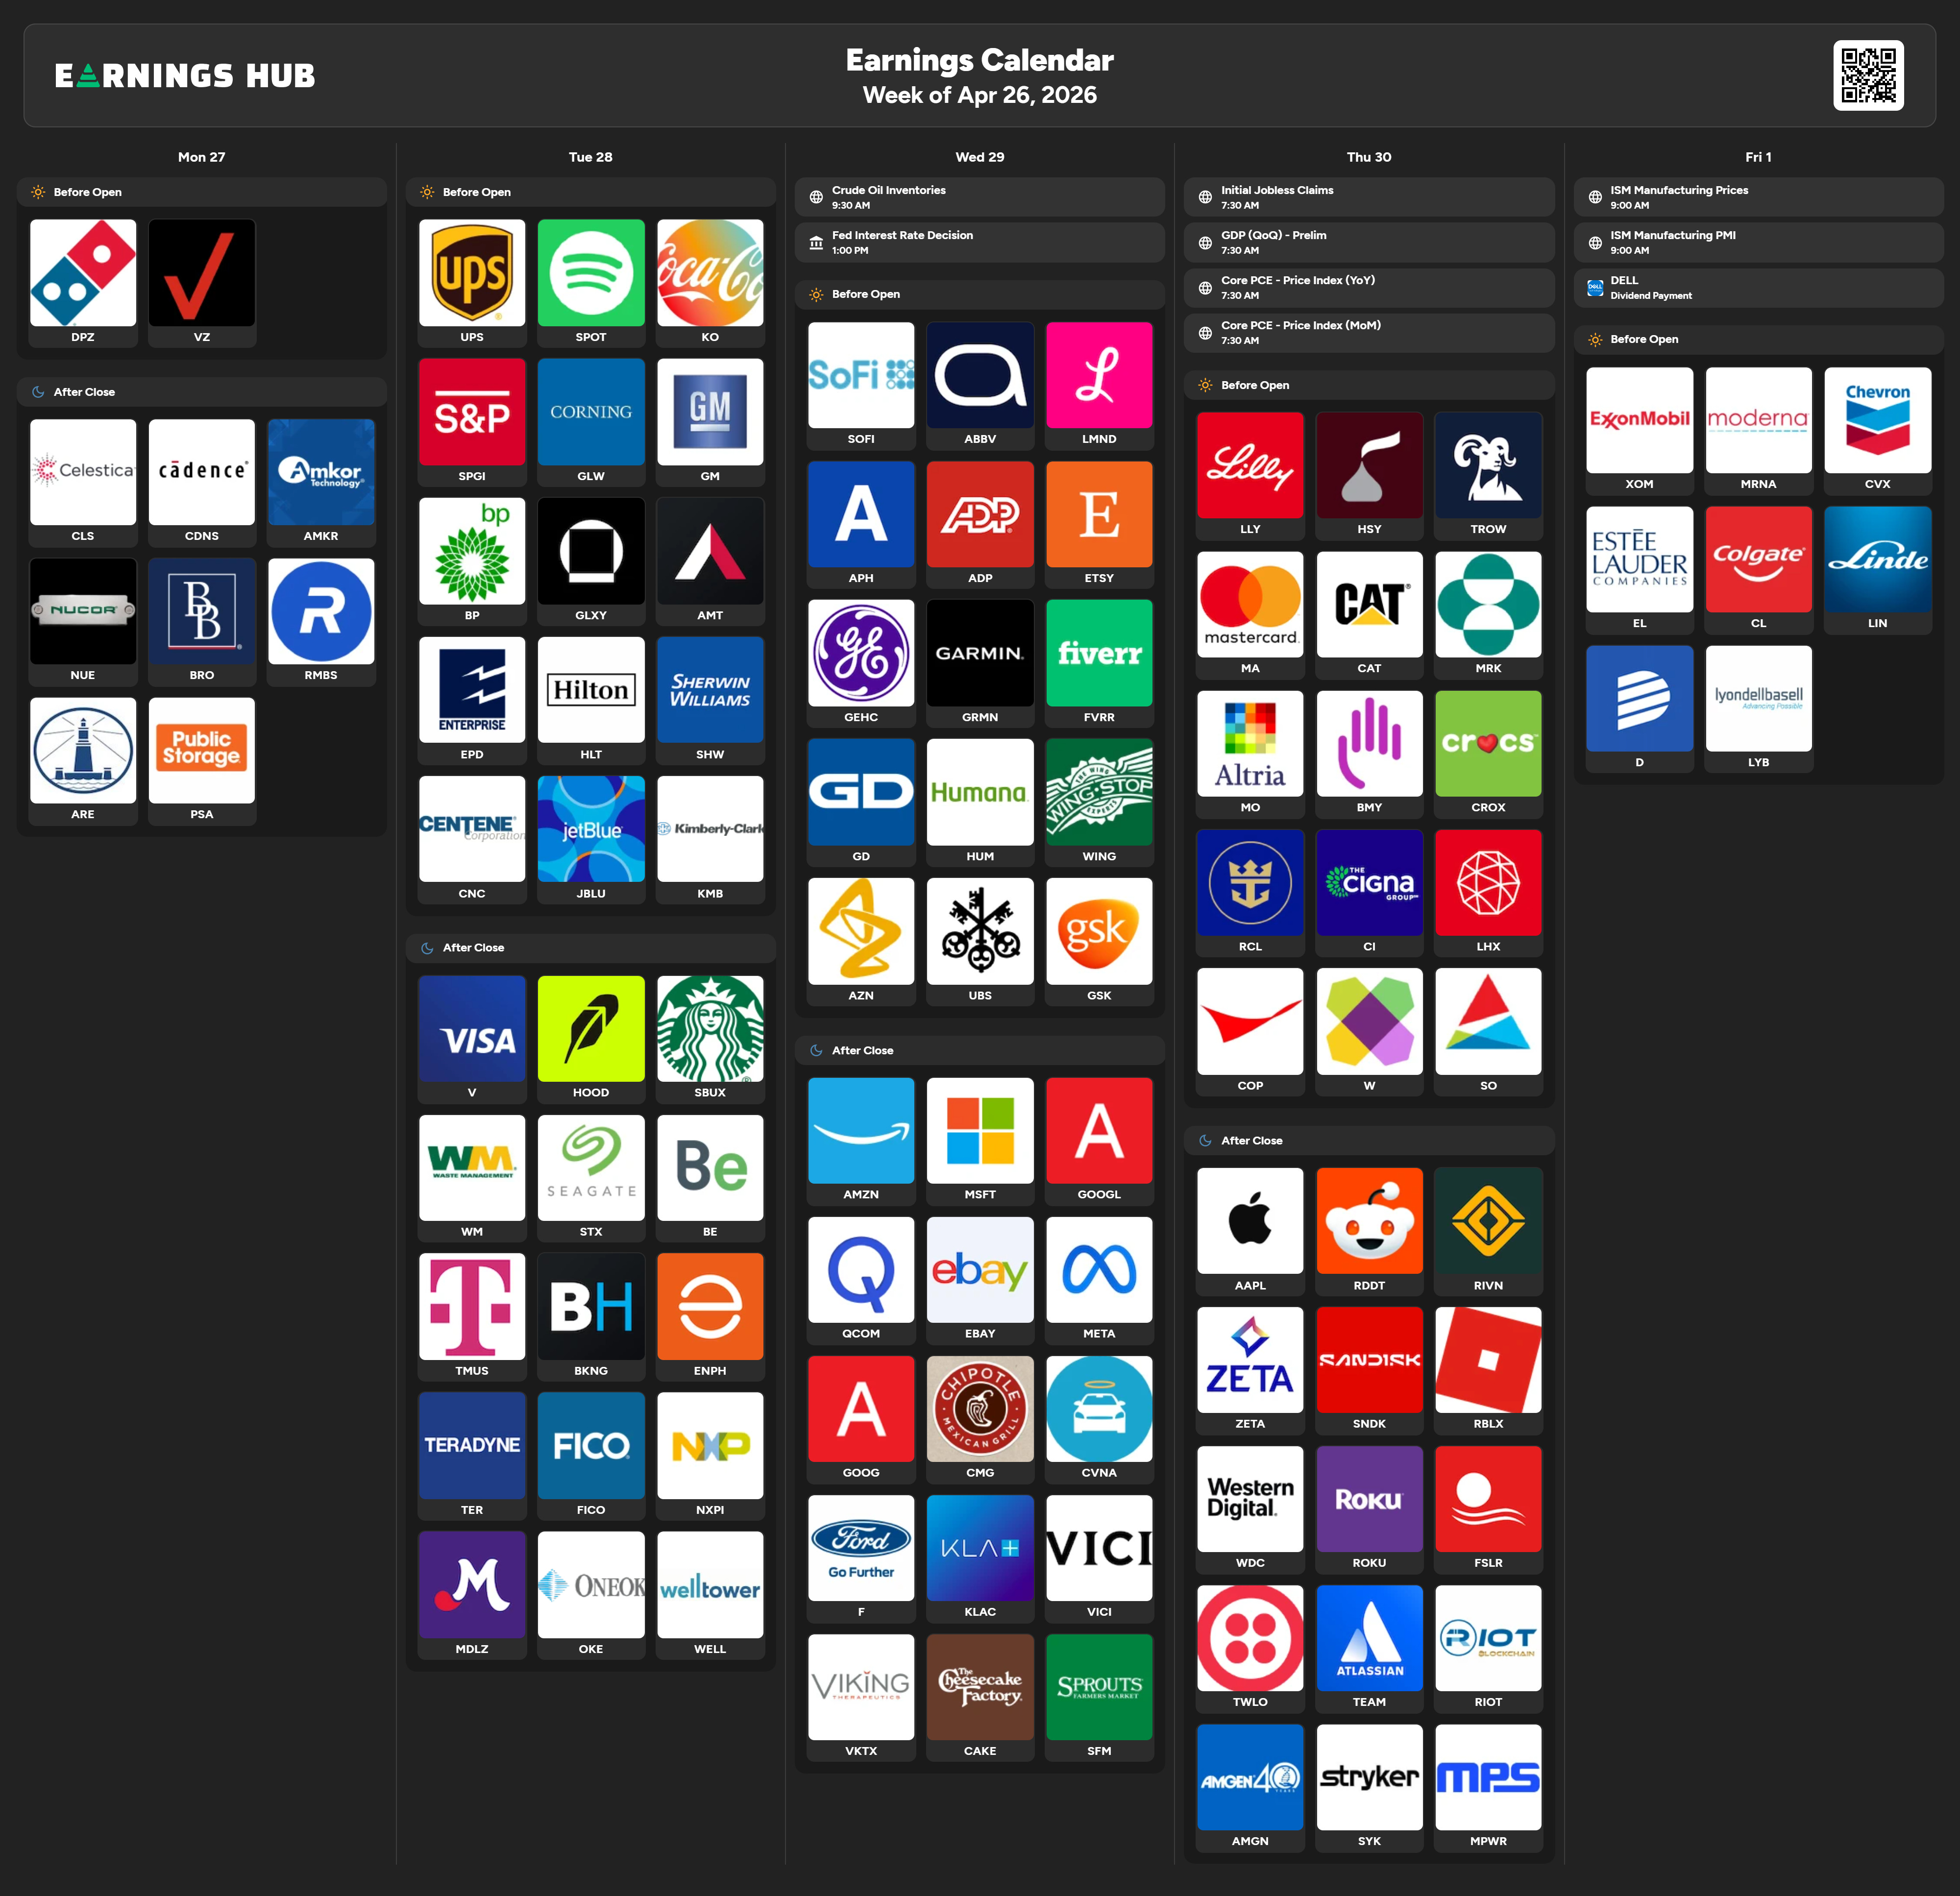
Thursday: LLY 0.00%↑ MA 0.00%↑ CAT 0.00%↑ - These carry real index weight
Friday: XOM 0.00%↑ CVX 0.00%↑ - Energy sector representation
Earnings: The Weekly Stress Test
LLY, MA, CAT, and the energy names on Friday carry the most index impact. Single-print changes rarely trigger regime shifts, but dispersion means sector rotation could accelerate depending on which groups outperform.
MARKET STRUCTURE: YOUR FOUNDATION
Gamma Positioning - The Anchor Point
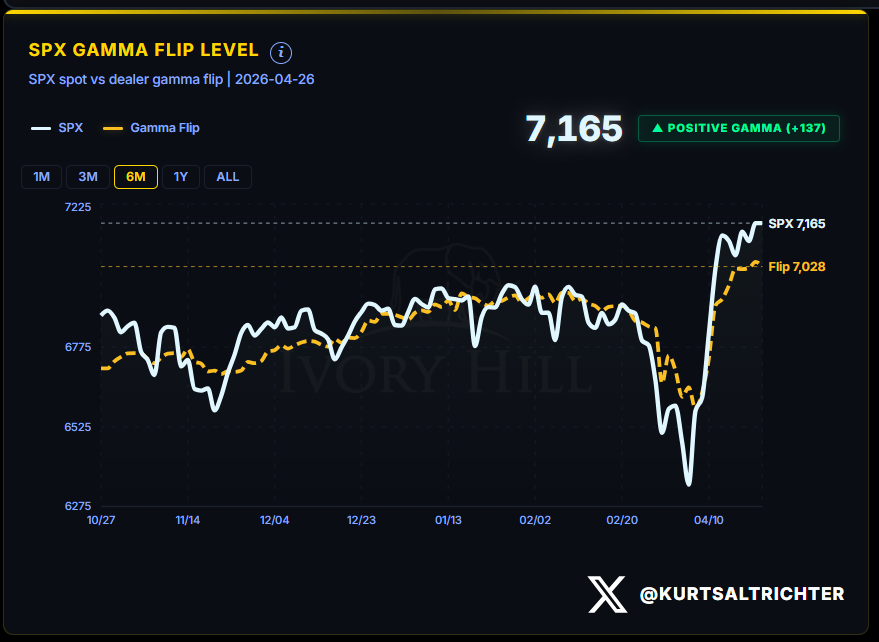
The S&P 500 sits at 7,165 against a gamma flip line of 7,040. That 124-point cushion is the widest since late January. Above the flip, dealers sell strength and buy weakness. The flip line itself is rising - dealer positioning is stabilizing at progressively higher ground.
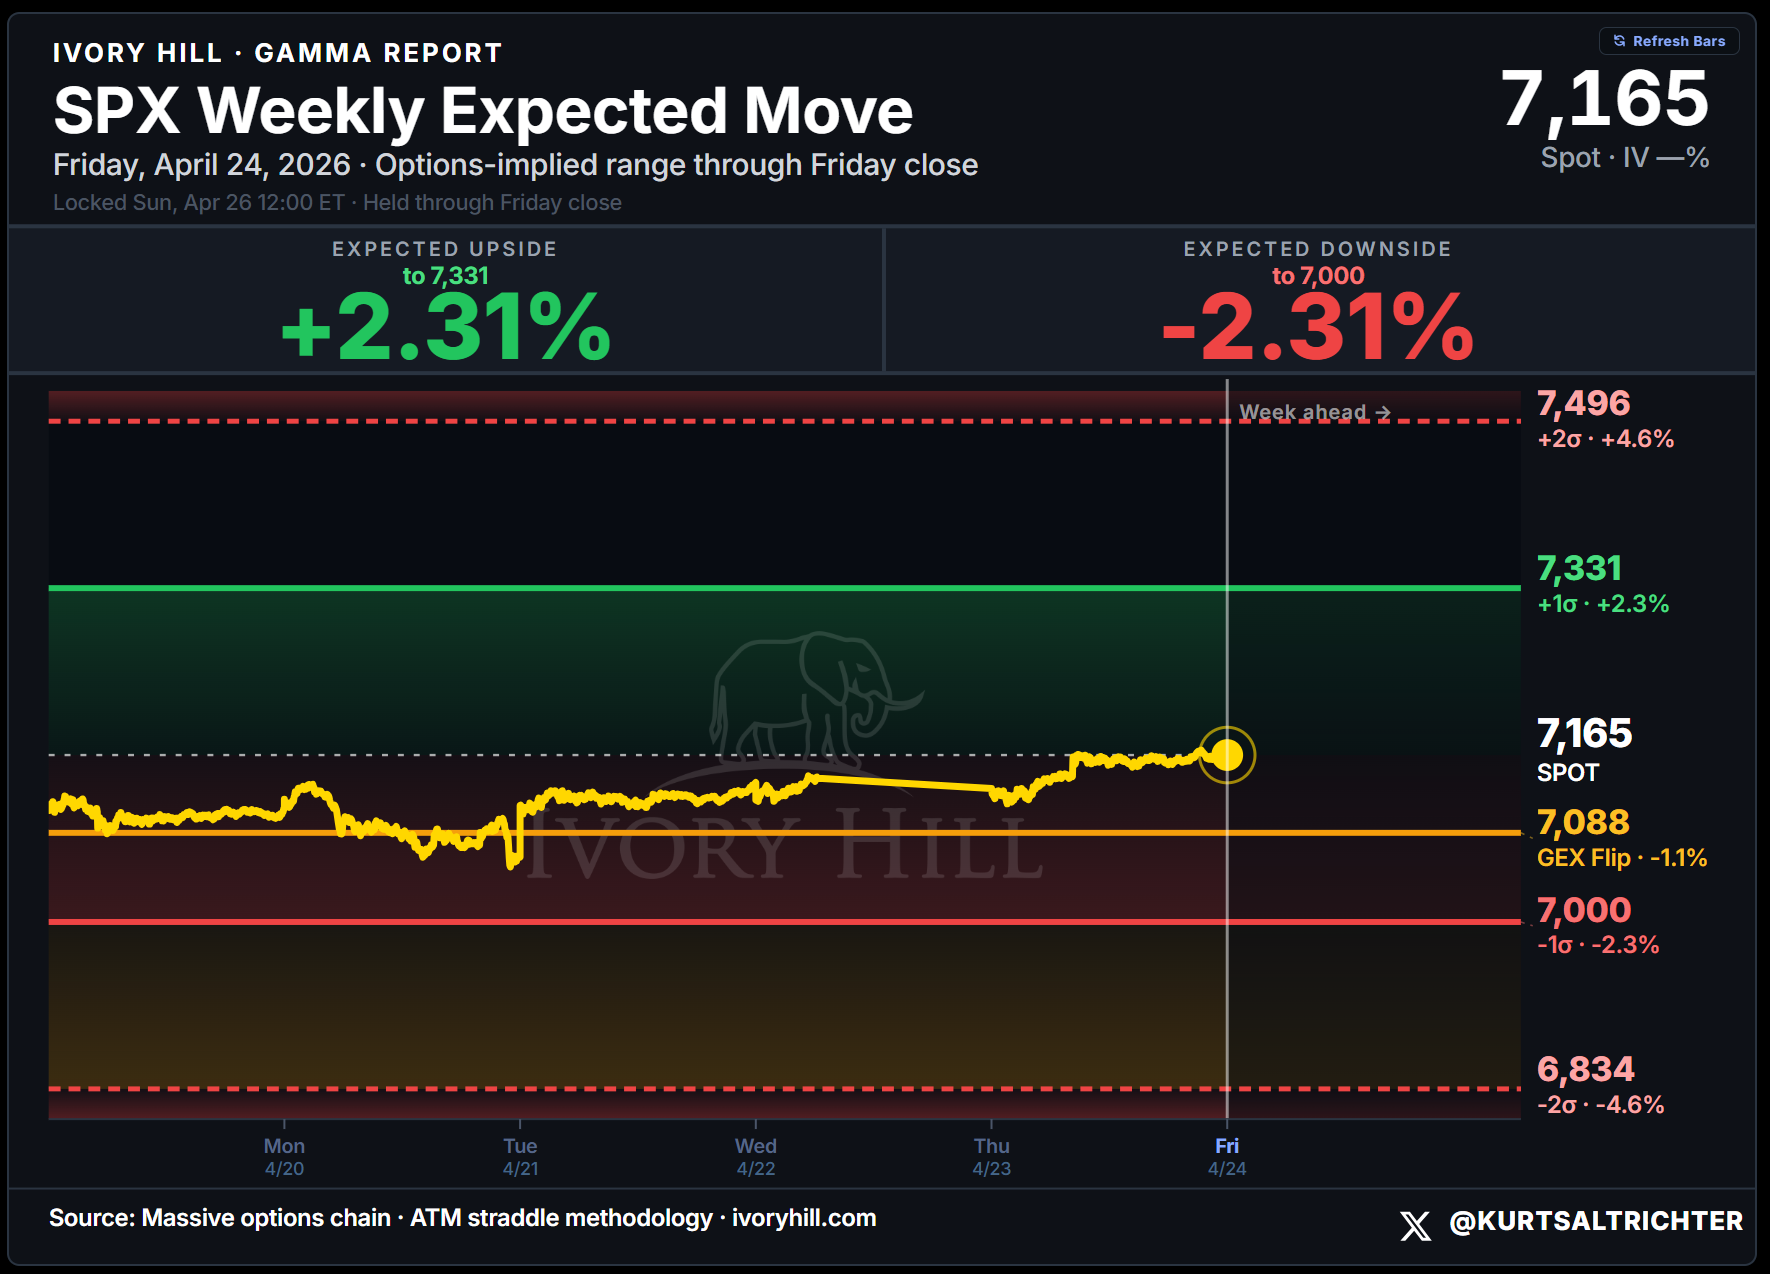
Weekly Expected Moves from the dashboard:
1-sigma range: 7,000 to 7,331 (roughly 2.3% either direction)
2-sigma range: 6,834 to 7,496 (roughly 4.6% either direction)
The line that matters: 7,000. That’s your 1-sigma lower band. Lose 7,000 this week, and you’re testing the structural support zone.
Realized Volatility - The Vol-Control Lock
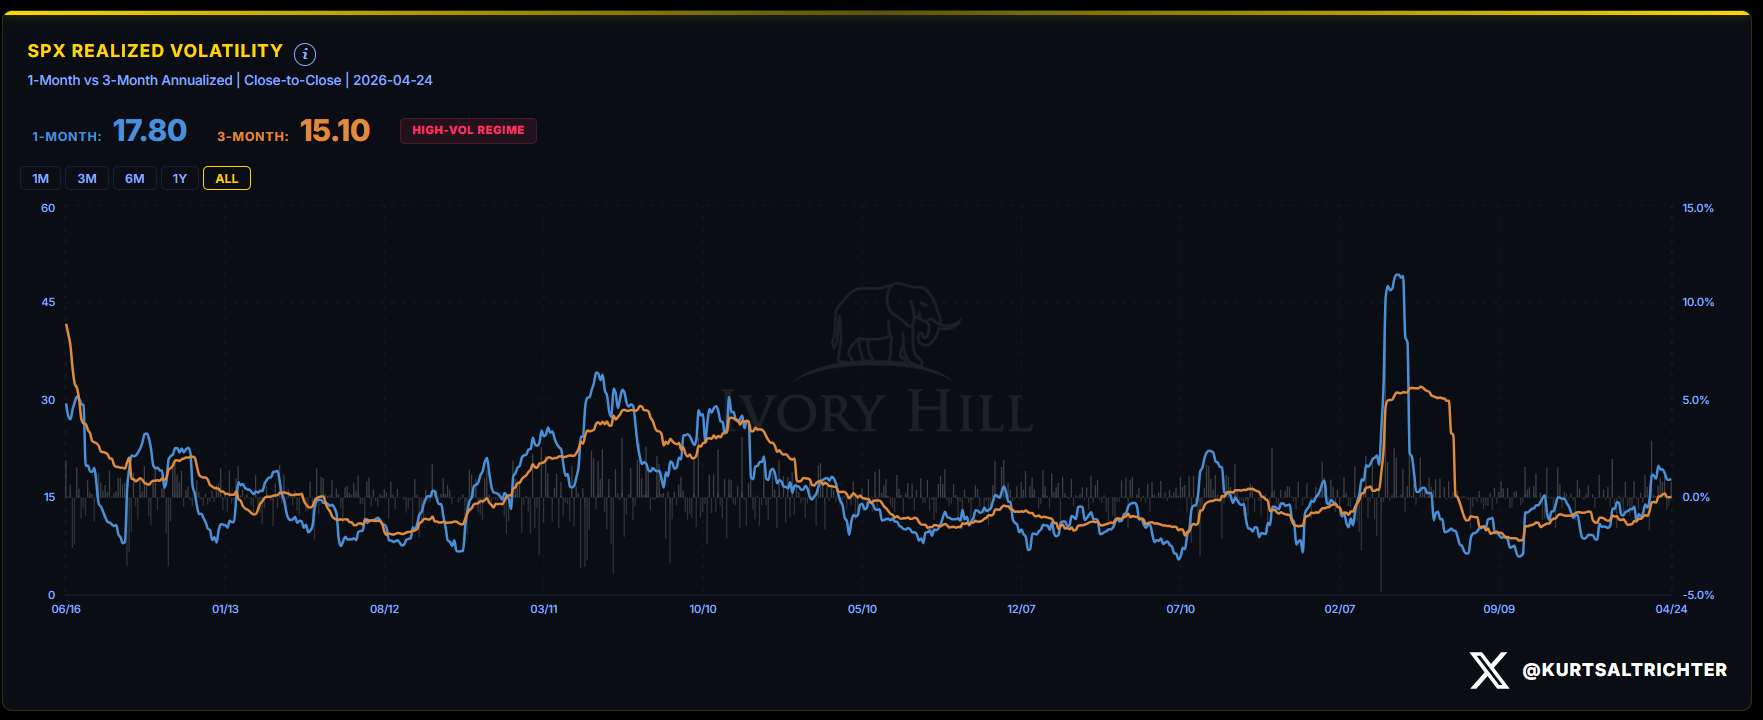
The realized volatility signal is bullish. 30-day vol at 17.80 still runs above 90-day vol at 15.10. That spread is narrowing but has not inverted. When the 30-day falls below the 90-day, vol-control funds start buying mechanically.
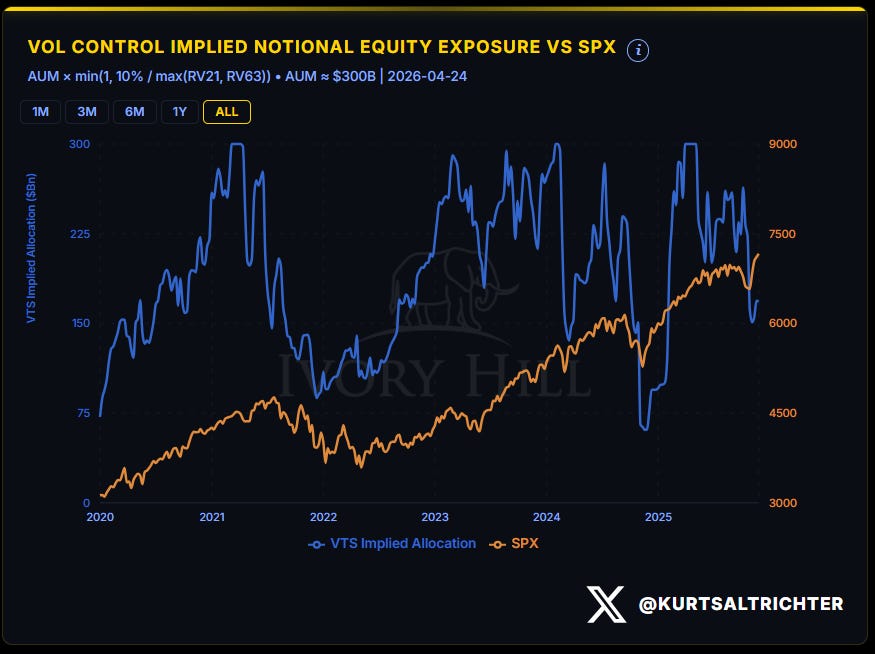
Look at the blue line. Vol-control exposure sits near $150 billion. In late 2024 and most of 2025, that line ranged between $225 and $300 billion. The S&P 500 is at its high. Vol-control exposure is not. This market could absolutely have legs from here.
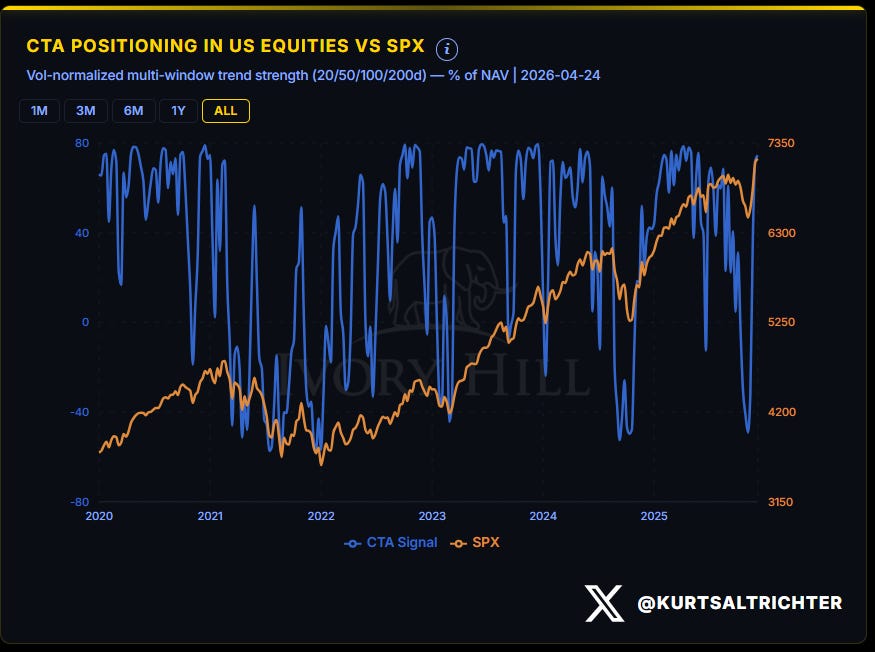
I have seen a lot of chatter about CTAs. First of all, CTAs were done buying a week ago, and second, they control two or three hundred billion. Vol control funds control over a trillion in assets. So, yes, this market can still go higher.
Edge: Recent systematic fund flows show vol-control funds are actively buying. Just four days ago, systematic funds drove an $86 billion equity buying spree, with volatility-targeting strategies as key drivers. As realized volatility declines from current levels, these algos will continue to buy stocks. The $75-150 billion gap represents some of the upside potential as these funds rebuild exposure.
SYSTEMATIC FLOWS: THE MOMENTUM BEHIND THE MOMENTUM
The Systematic Positioning Index made a two-standard-deviation swing in one week. A week ago it sat at -1 (bearish territory). Today it’s near +1 (threshold of crowded long). CTAs are most likely done buying for now.
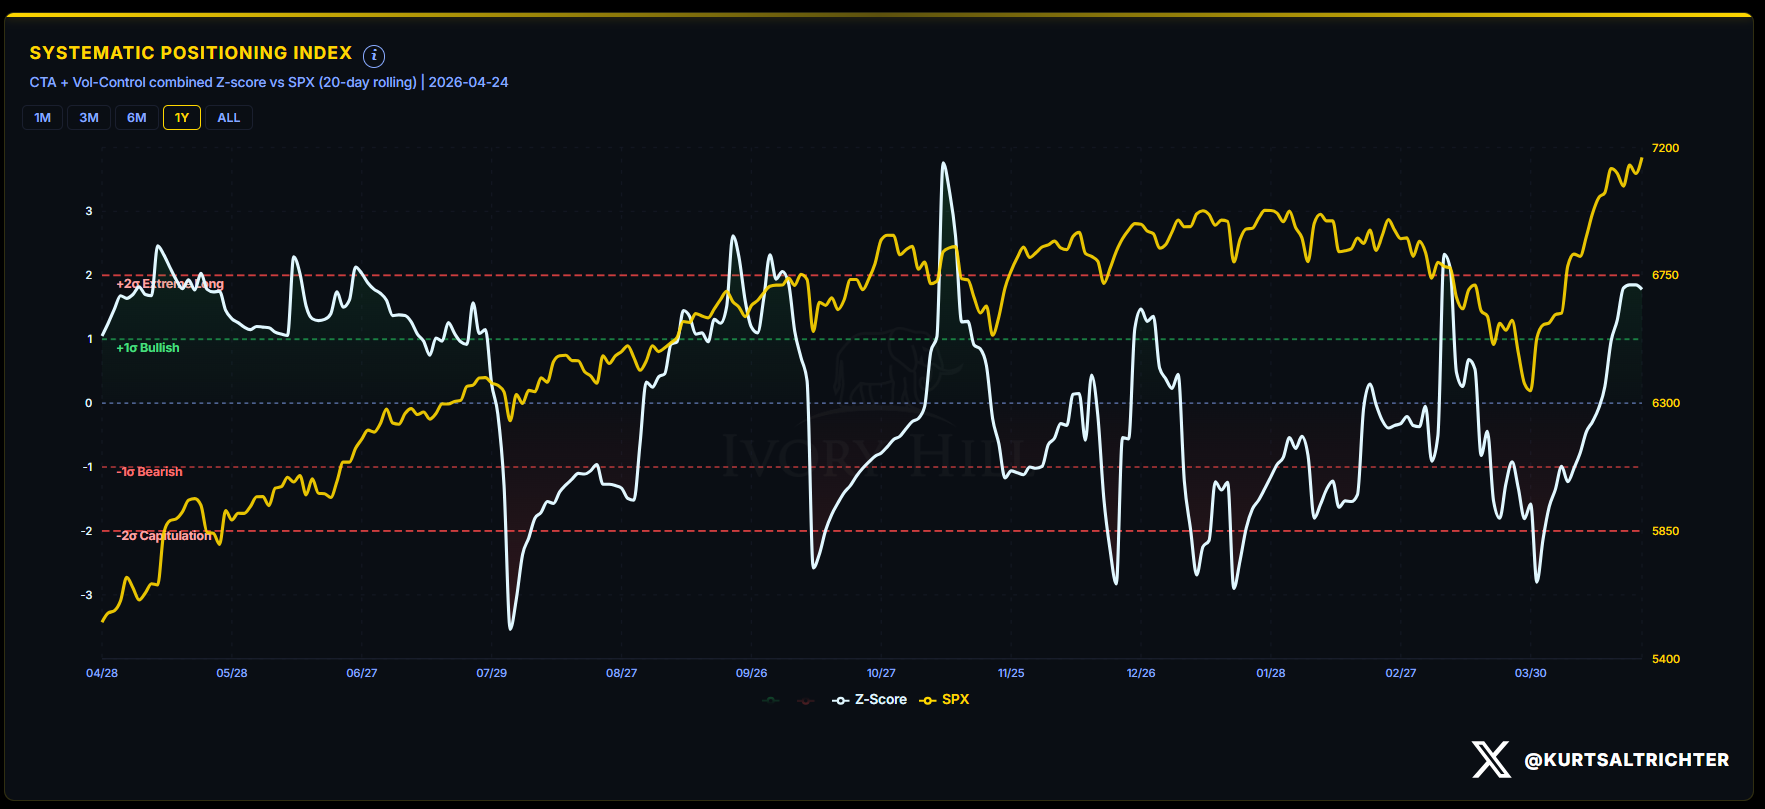
Positioning context: CTAs have exhausted their selling - the easy money was made catching that flip from bearish to bullish positioning. Any rally from here still has systematic support underneath it from vol-control funds, as long as realized vol continues to drop.
The Flow Signal Reality
The flow signal holds Bullish. The positioning data confirms this. CTA trend-following signals have been rising for the last 12 consecutive trading days. Vol-control trend signals have gradually begun to turn up over the last week. The directional momentum is in place with fresh fuel from systematic flows.
BREADTH: THE FOUNDATION BROADENS
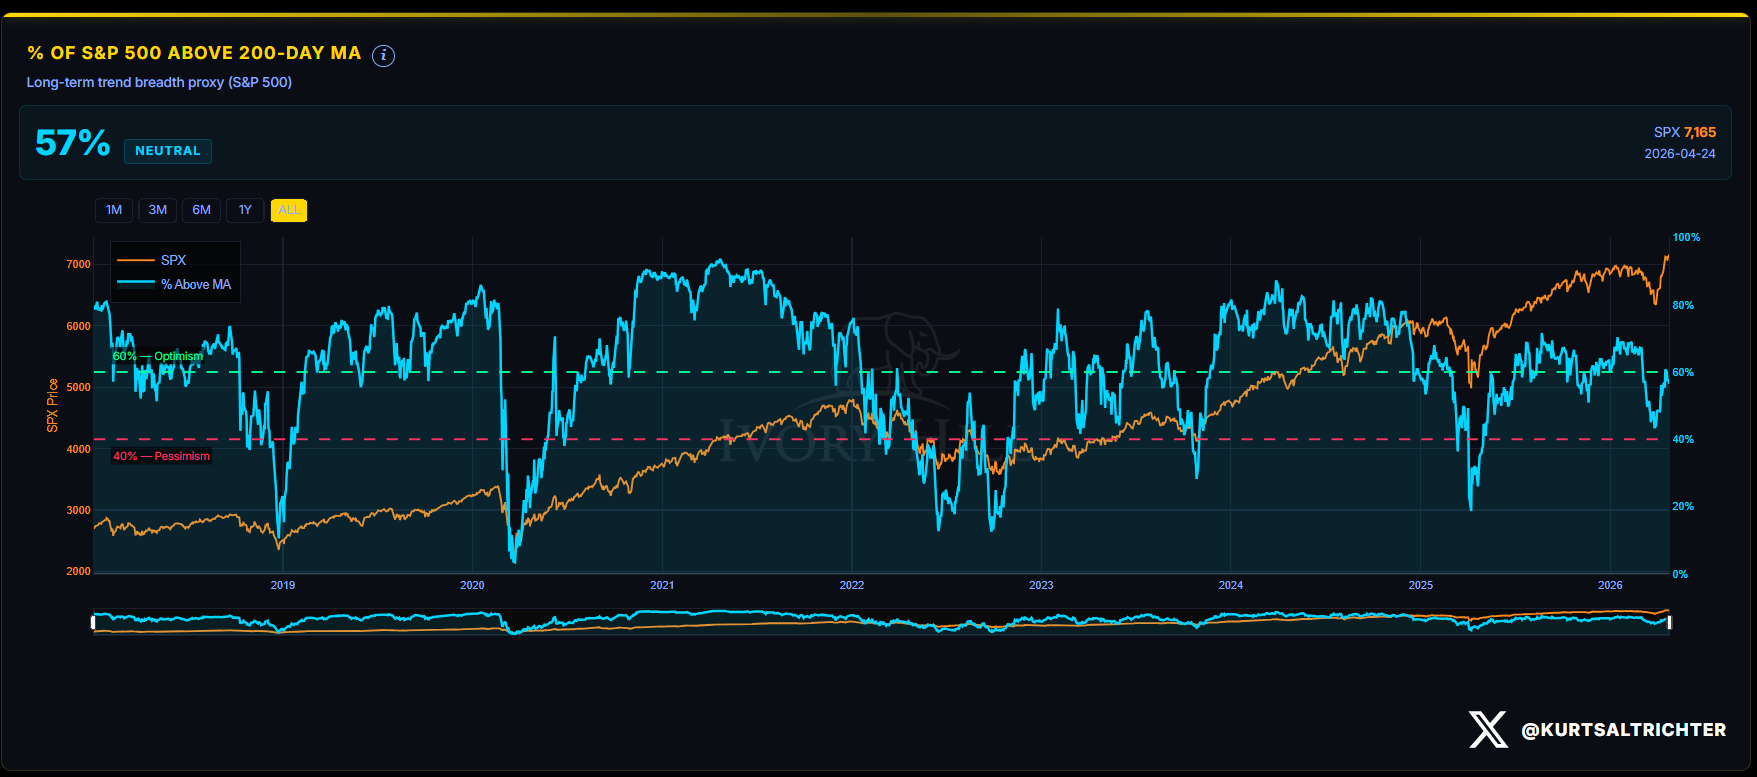
Breadth upgraded to Bullish. A few weeks ago, fewer than half of the S&P 500 components traded above their long-term trend. Today, 57% do. Participation is close to clearing the optimism threshold.
Why this matters: Narrow rallies fail. Broad rallies compound. This move is starting to broaden, but the speed has me watching for divergences.
COMPOSITE SIGNAL: RISK-ON
Current Regime: Risk-On (third consecutive week) Tactical Allocation: 75% SPHB / 25% SPXL
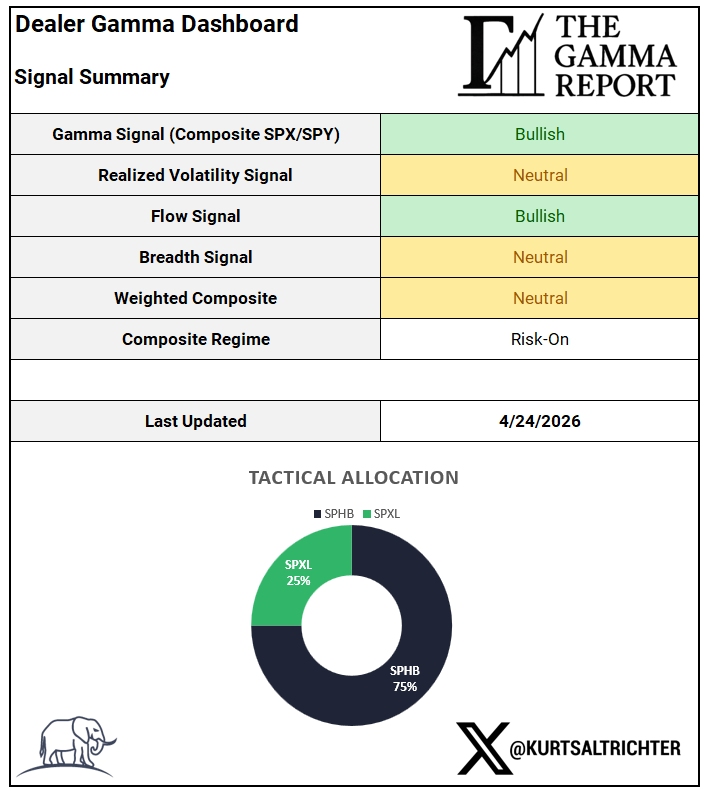
Your allocation reflects where the structure actually sits, not where headlines say it should be.
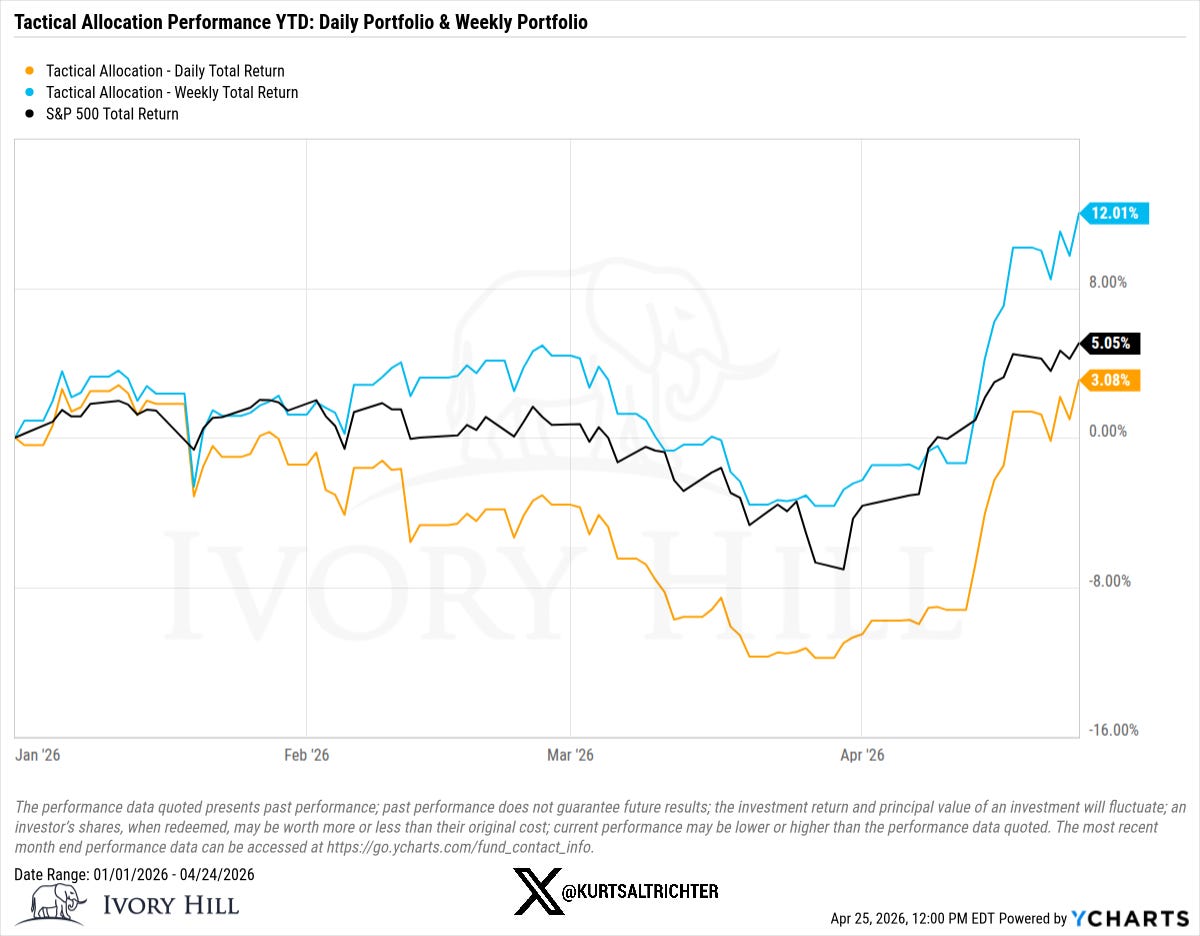
The weekly-rebalanced allocation is running ahead of the S&P 500 year-to-date at +12.01% vs +5.05%. The daily version lagged through March but is now recovering, up 3.08%.
YOUR WEEKLY CHECKLIST
What can break this setup:
A close below 7,000 with force (1-sigma support level)
Spike in realized volatility above 20% (triggers vol-control deleveraging)
Broad-based earnings disappointments (reverses breadth momentum)
FOMC hawkish surprise Wednesday (event priced for volatility expansion)
What to monitor:
Monday’s Consumer Confidence - Low-vol event that could surprise
Thursday’s LLY/MA/CAT cluster - Index-weight earnings that matter for breadth
Friday’s energy earnings (XOM/CVX) - Sector rotation catalyst
Vol-control buying pace - Watch for acceleration on any vol decline
Your tactical stance:
Gamma is positive with a 123-point cushion above flip
Breadth has 57% participation above 200-day MA
Systematic flows are net supportive (CTAs done selling, vol-control buying)
Market structure is clean.
Stay disciplined. You’re no longer buying the dip. You’re managing momentum.
And remember - The one fact pertaining to all conditions is that they will change.
Feel free to use me as a sounding board.
Follow me on X for more updates.
Best regards,
Schedule a call with me by clicking HERE
Kurt S. Altrichter, CRPS®
Wealth Advisor | President
Disclosure
The Gamma Report is published by Ivory Hill, LLC. All opinions and views expressed in this report reflect our analysis as of the date of publication and are subject to change without notice. The information contained herein is for informational and educational purposes only and should not be considered specific investment advice or a recommendation to buy or sell any security.
The data, models, and tactical allocations discussed in this report are designed to illustrate market structure and positioning trends and may differ from portfolio decisions made by Ivory Hill, LLC or its affiliates. Investing involves risk, including the possible loss of principal. Past performance is not indicative of future results.
Ivory Hill, LLC, and its members, officers, directors, and employees expressly disclaim any and all liability for actions taken based on the information contained in this report.