

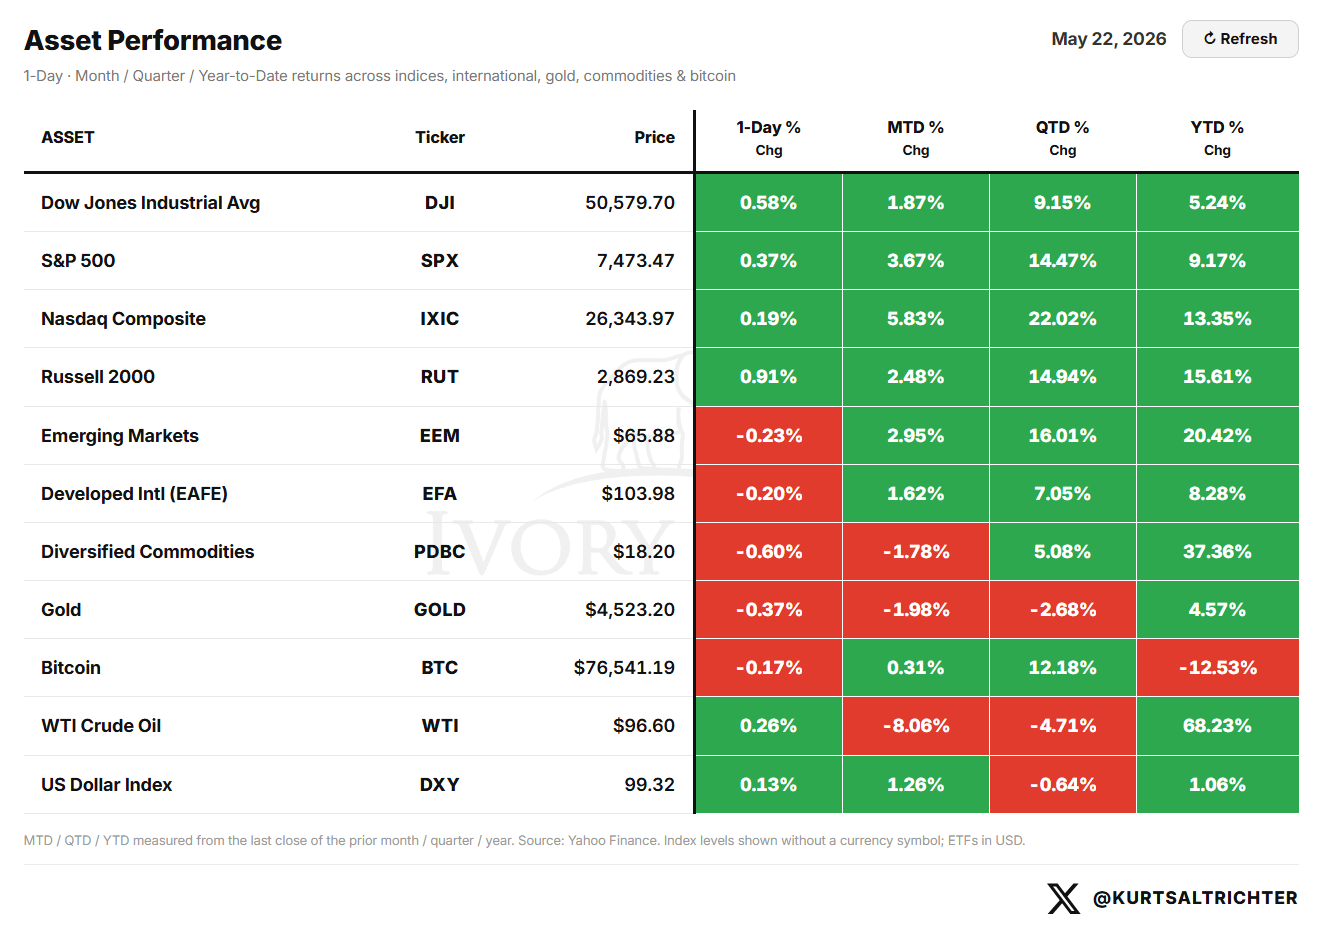
The S&P 500 closed Friday at 7,473, up 0.86% on the week. Seven consecutive weeks of risk-on signal stack.
THE ECONOMIC EVENT CALENDAR AND VOL TERM STRUCTURE
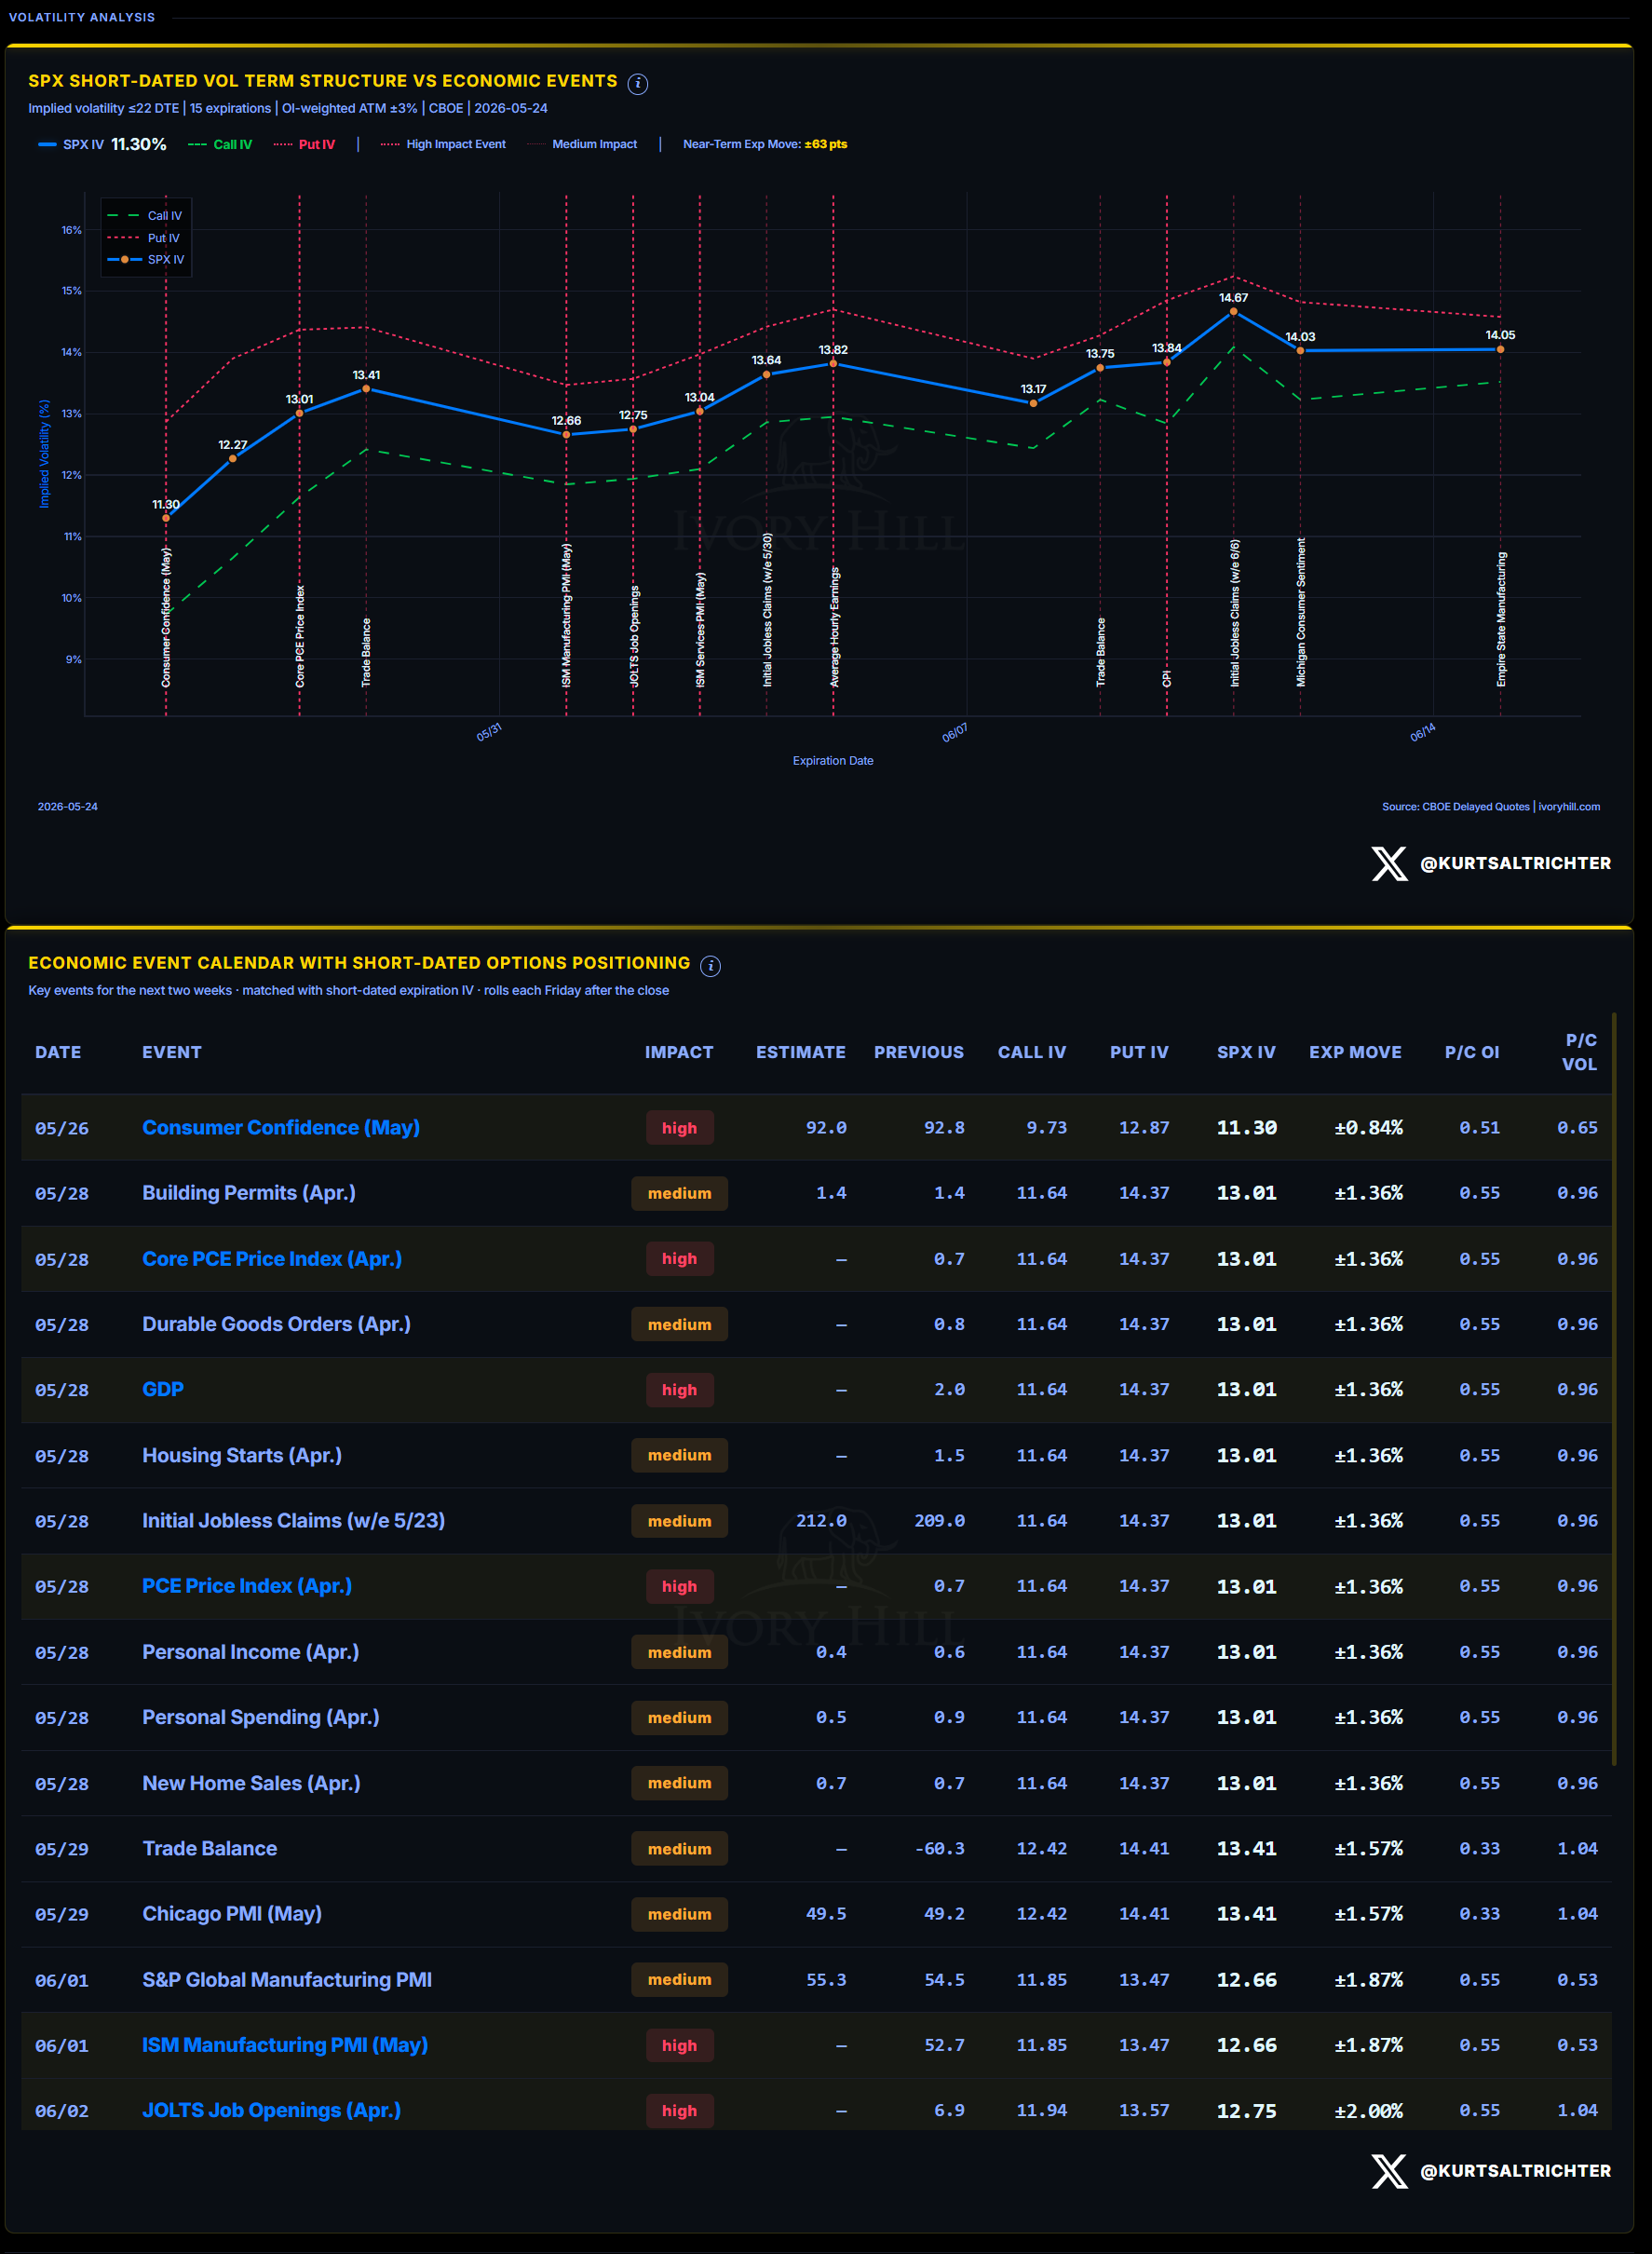
The term structure slopes upward as the macro calendar front-loads into the back half of the week.
Monday, May 25: Markets closed for Memorial Day.
Tuesday, May 26 (Consumer Confidence): First high-impact print of the week. SPX IV at this expiration is 11.30, implying a move of roughly ±0.84% in either direction. Consumer Confidence feeds directly into retail spending expectations.
A print below 90 at this level of equity positioning is a flashing yellow light.
Thursday, May 28: The heaviest macro day of the week by a wide margin. GDP preliminary (prior 2.0%), Core PCE (prior 0.7%), PCE Price Index (prior 0.7%), Initial Jobless Claims, Durable Goods Orders, Personal Income, Personal Spending, New Home Sales, and Building Permits all land the same morning. SPX IV at the May 28 expiration is 13.01, implying ±1.36%.
Core PCE is currently the Fed’s preferred inflation gauge (for now).
The chain reaction to watch for: a hot print above 0.3% m/m would reinforce the “higher-for-longer” narrative for the path for rates, and would put pressure on rate-sensitive sectors, as well as hand systematic funds a volatility spike that could trigger mechanical selling.
Friday, May 29: Trade Balance (prior -$60.3B) and Chicago PMI (estimate 49.5, prior 49.2). S&P 500 (SPX) implied volatility (IV) at 13.41, implying ±1.57% move in either direction.
EARNINGS
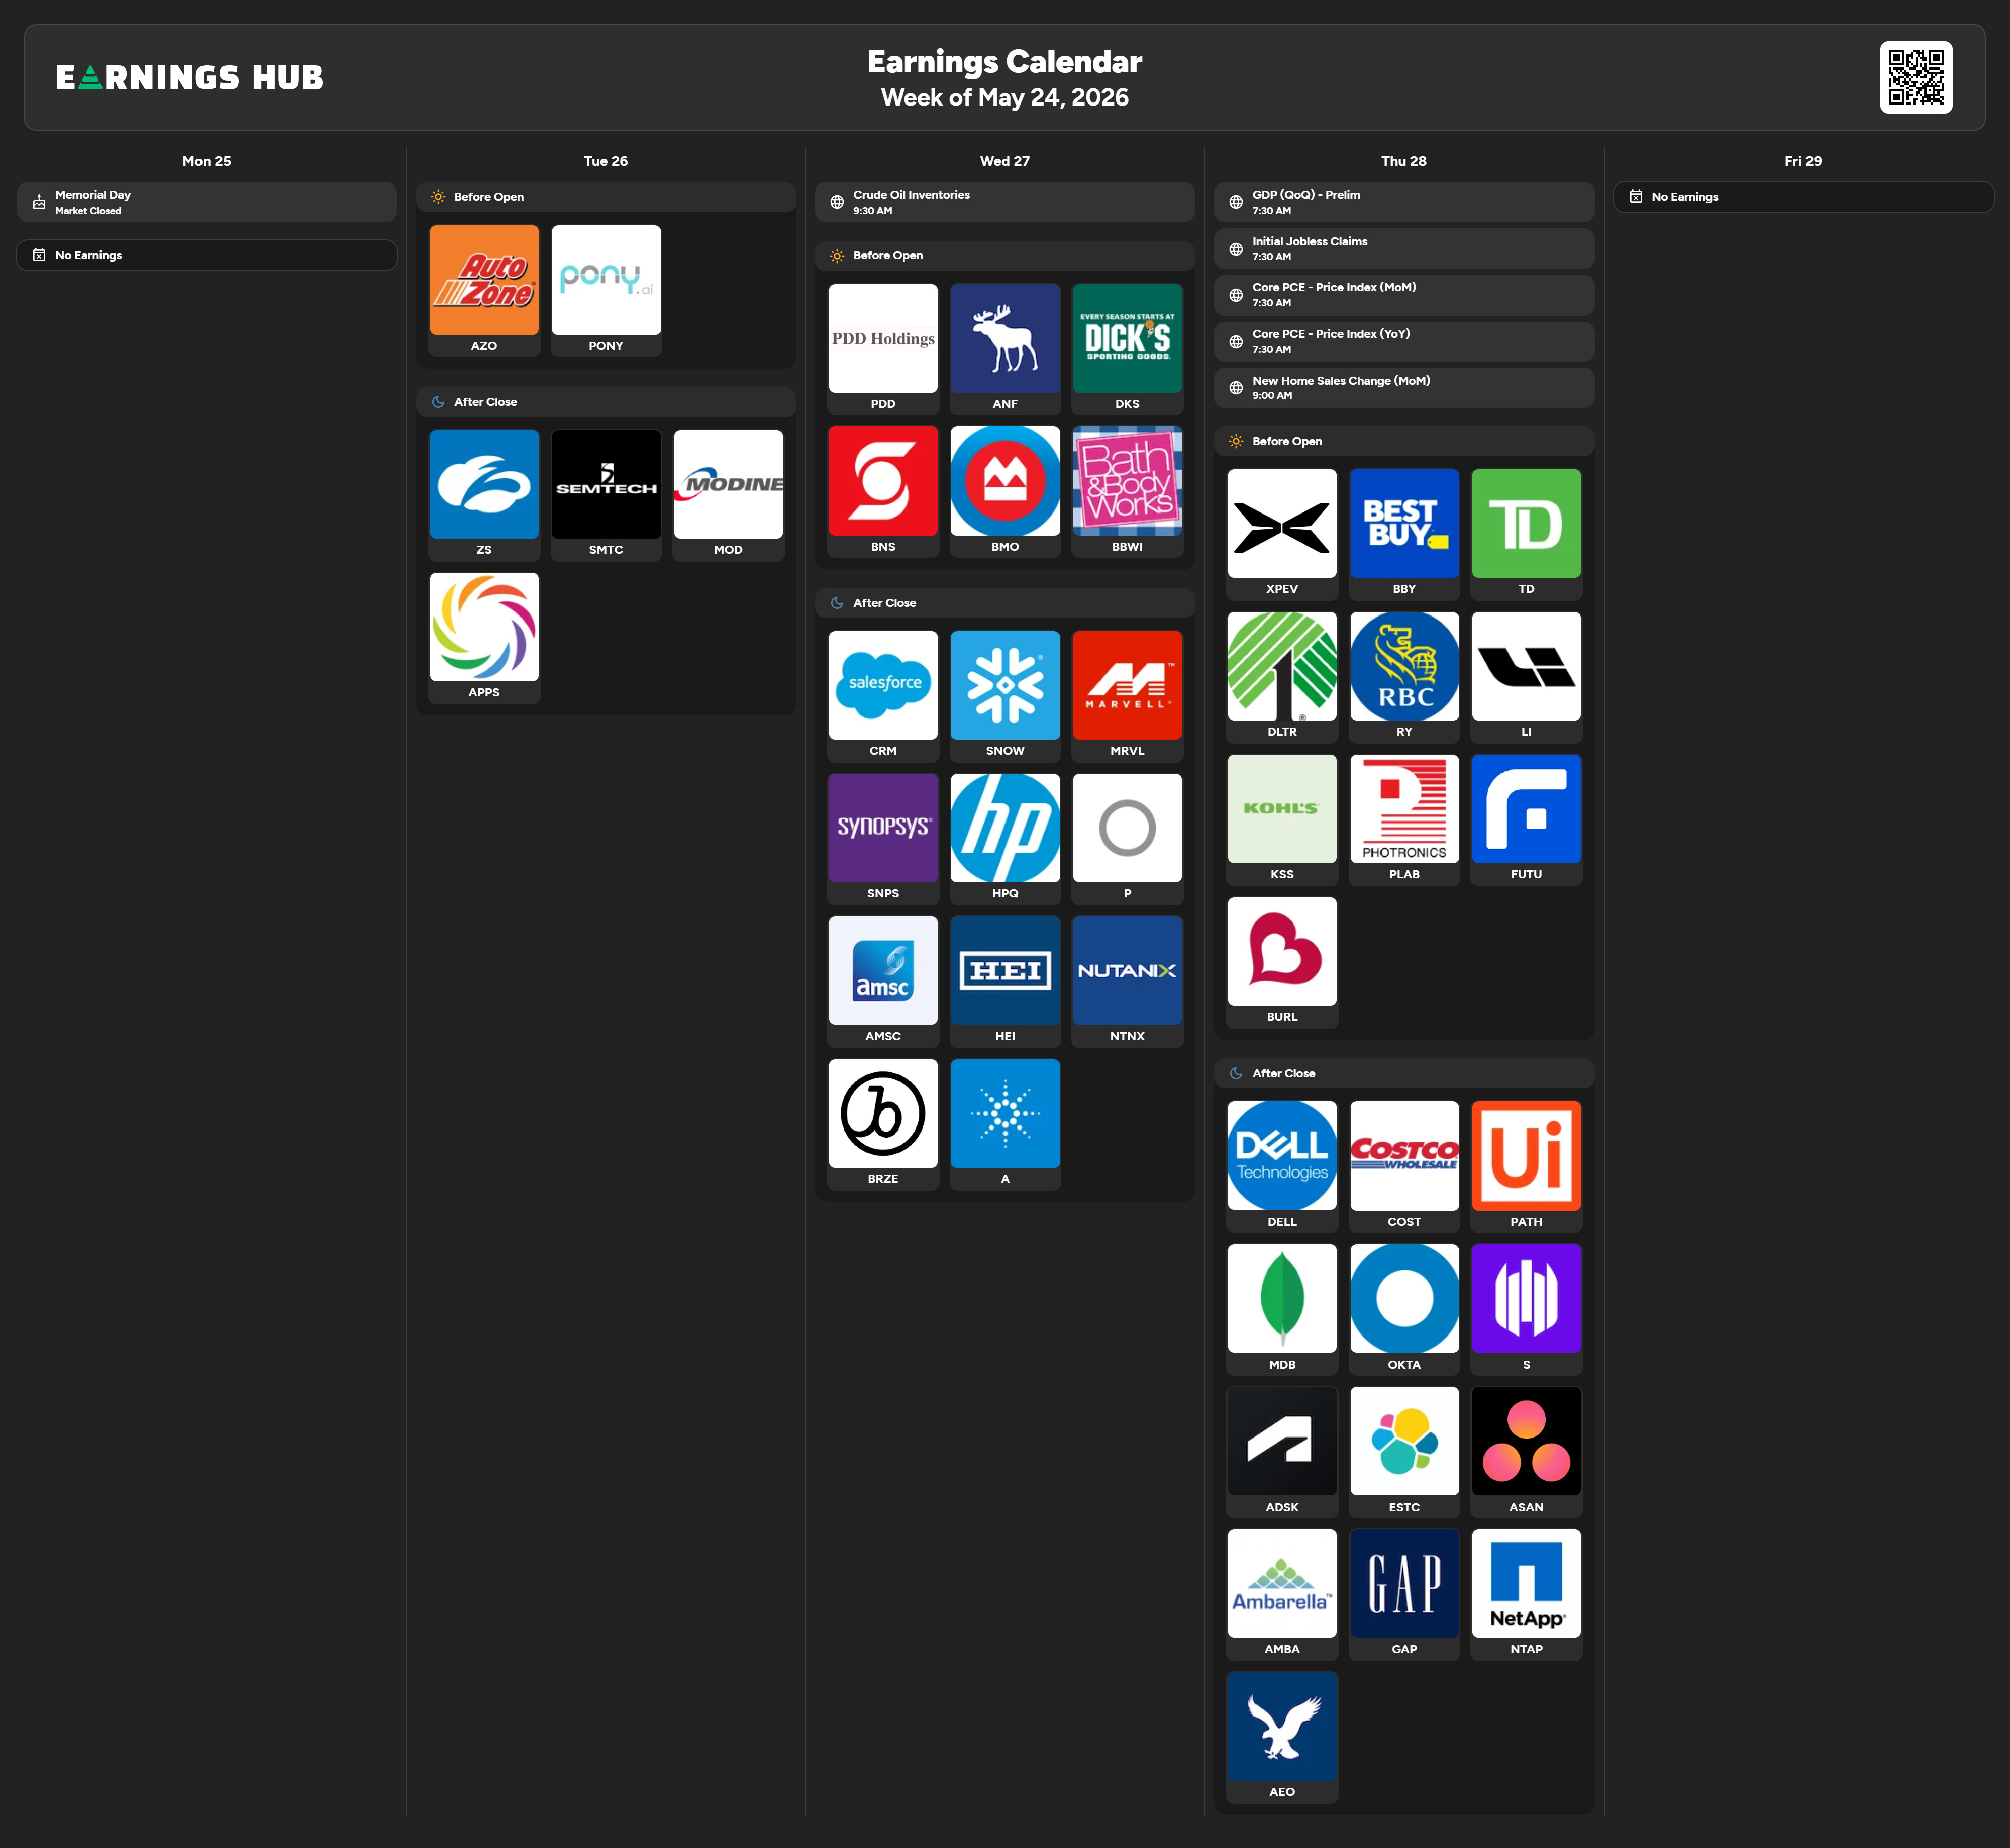
Tuesday, May 26: AutoZone (AZO) and Pony.ai (PONY) before the open. Zscaler (ZS), Semtech (SMTC), Modine (MOD), and AppLovin (APP) after the close.
ZS is the cybersecurity print this week.
Wednesday, May 27: PDD Holdings, Abercrombie & Fitch (ANF), and Dick’s Sporting Goods (DKS) before the open. After the close: Salesforce (CRM), Snowflake (SNOW), Marvell Technology (MRVL), Synopsys (SNPS), HP (HPQ), Nutanix (NTNX), Braze (BRZE), and Agilent (A).
Salesforce and Marvell are the dominant earnings to watch. Marvell is a direct read on AI chip demand downstream from NVIDIA’s Wednesday beat last week. If Marvell guides down, the NVIDIA halo trade will likely come off.
Thursday, May 28: Best Buy (BBY), Dollar Tree (DLTR), Kohl’s (KSS), Burlington (BURL), and XPEV before the open. After the close: Dell Technologies (DELL), Costco (COST), MongoDB (MDB), Okta (OKTA), Autodesk (ADSK), Elastic (ESTC), Asana (ASAN), Ambarella (AMBA), Gap (GAP), NetApp (NTAP), and American Eagle (AEO).
Costco is the best single earnings to watch on mass-market consumer health because 35-40% of the US population is a Costco cardholder. Dell is the enterprise hardware proxy for AI capex, translating into actual server demand. Thursday is also the heaviest macro day of the week, so earnings reactions will compete with GDP and PCE prints for control of the tape.
MOMENTUM PULSE CHECK
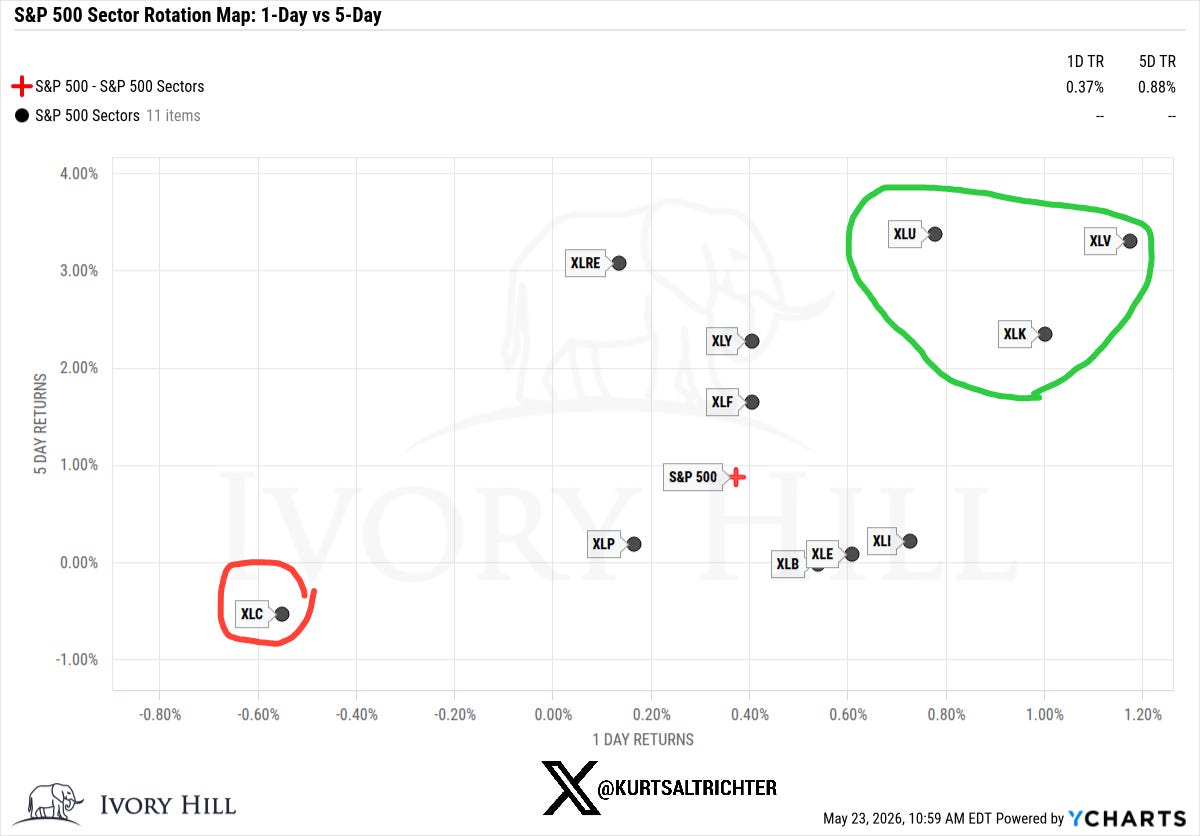
Last week’s sector rotation shows Health Care (XLV) and Utilities (XLU) leading in both timeframes, up roughly 3.3% each over the 5-day period. Technology (XLK) posted +2.32% for the week, a number earned on the front half after NVIDIA’s Wednesday print. Communication Services (XLC) was the lone sector to be negative on both axes, at -0.60% on the day and -0.56% on the week. The S&P 500 itself posted +0.37% on Friday and +0.88% for the week.
The defensive leadership in XLV and XLU is not a bearish signal in isolation. At SPX all-time highs with breadth expanding, some rotation into defensives is normal digestion. The tell would be if XLV and XLU lead while XLK and XLY break down. That did not happen last week.
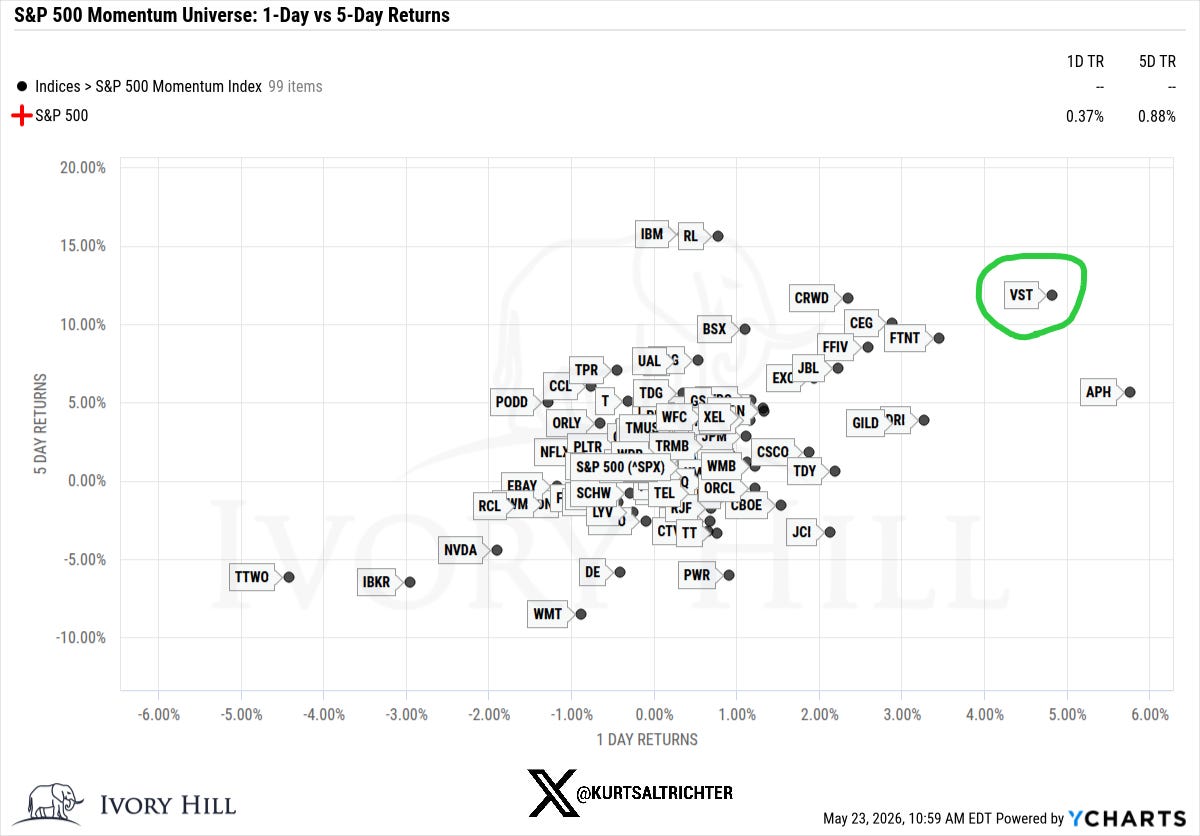
VST led the momentum universe on the 5-day at roughly +12%, followed by CRWD and APH. IBM and Ralph Lauren (RL) were near +15% on the 5-day. NVDA was negative on both timeframes after post-earnings digestion, down roughly 3% on the day and 4% for the week. TTWO, IBKR, and WMT were the notable laggards. The broader universe is positive on the 5-day, with 1-day dispersion narrowing as price stabilizes near new highs.
MARKET STRUCTURE: THE ANCHOR POINT
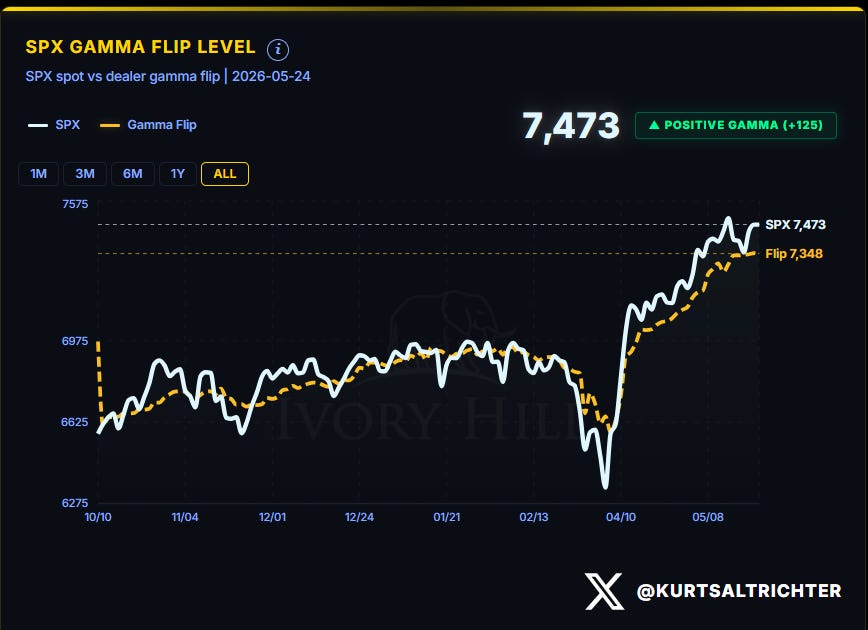
SPX closed Friday at 7,473. The gamma flip is at 7,348. Dealers are operating 125 points above the flip in positive gamma territory with net GEX at $49.38 billion.
Dealers: long gamma buy weakness, and sell strength. That mechanical behavior smoothed intraday volatility through last week, even as NVIDIA digested its own earnings and macro headlines hit on Thursday and Friday. The flip line has risen steadily alongside SPX since early April, indicating the gamma cushion is structurally sound.
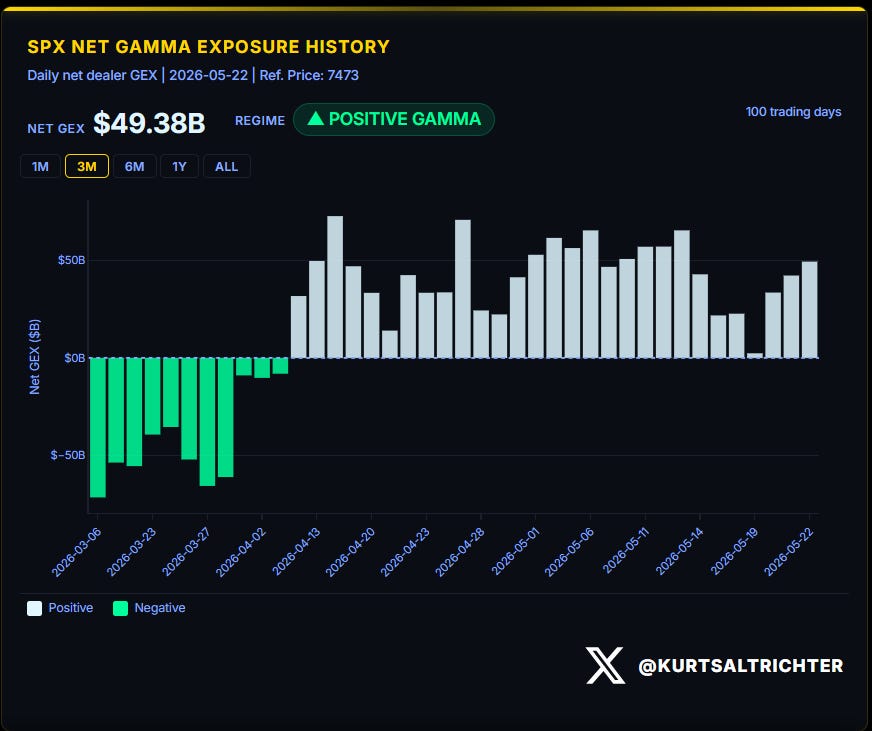
The net flip line has held consistently positive since April 13. The regime shift from negative to positive gamma on April 13 is the structural anchor for the entire rally so far. Since that date, the S&P 500 has moved from approximately 6,275 to 7,473, roughly 19%.
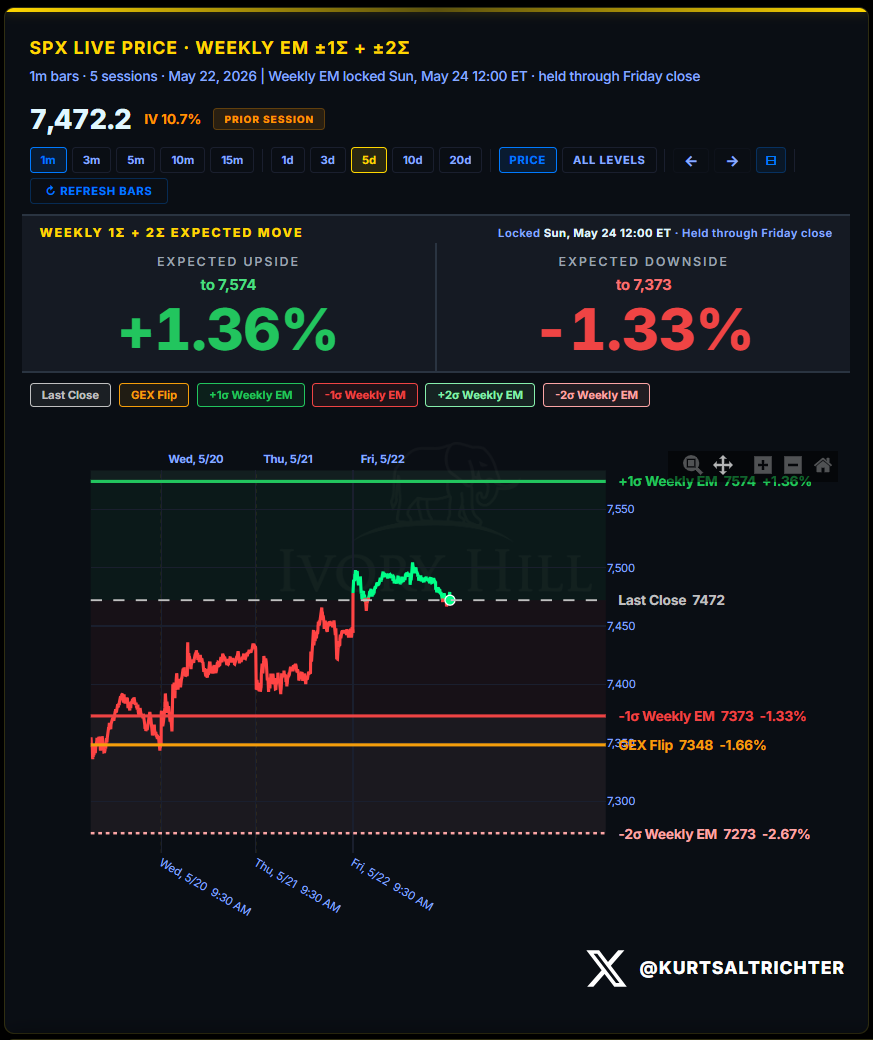
This week’s expected move is an upside to 7,574 (+1.36%), downside to 7,373 (-1.33%). The GEX flip sits at 7,348.
A close below 7,348 flips the regime. That level is closer to the spot price than it has been in recent weeks. Thursday’s PCE and GDP cluster will be the live test.
VOLATILITY REGIME
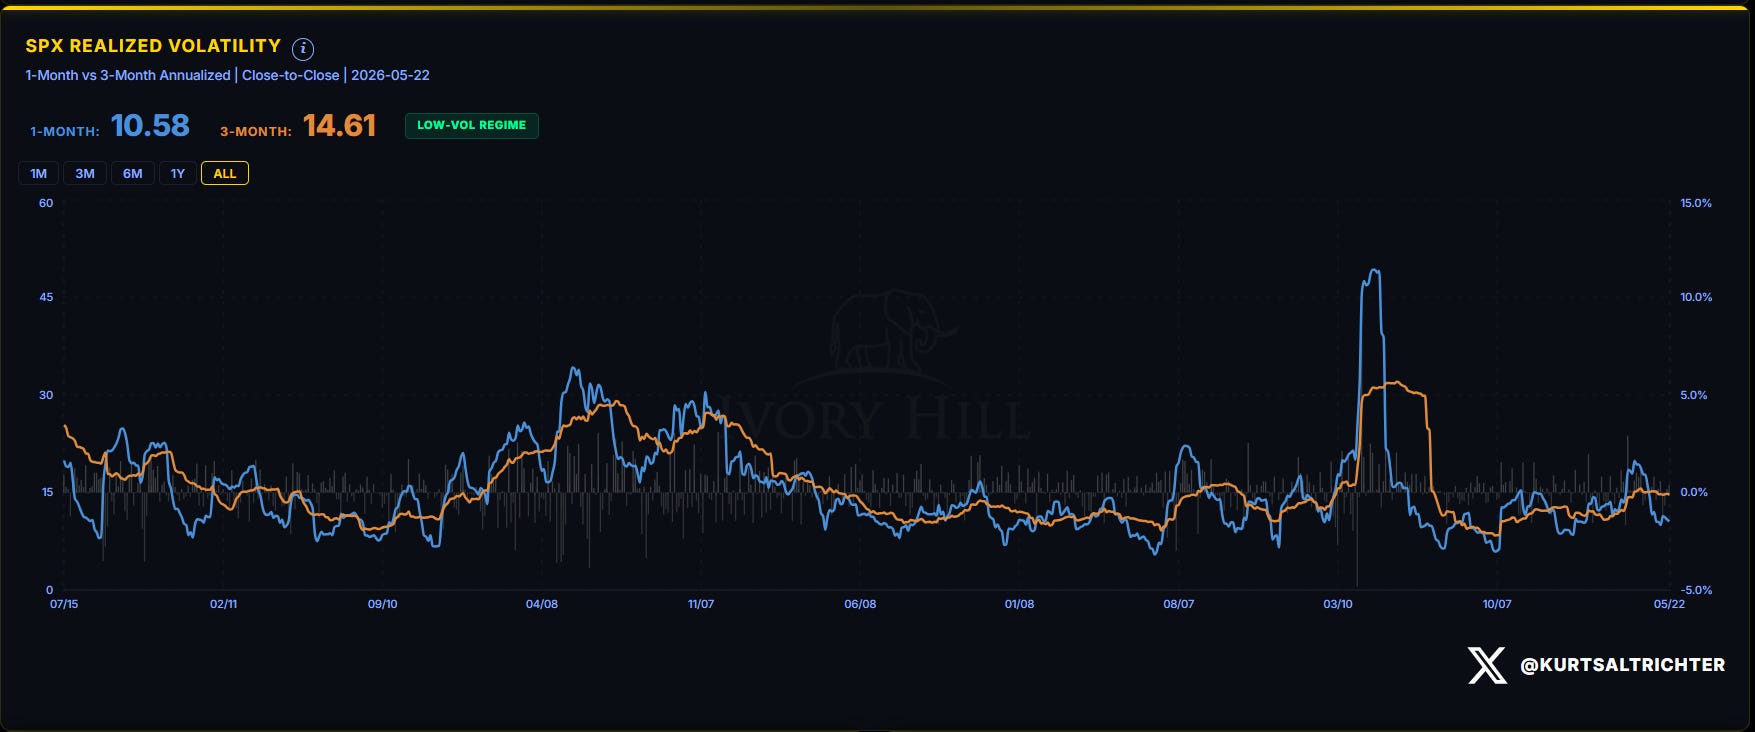
1-month RV printed 10.58 as of May 22. 3-month RV is 14.61. Regime tag: LOW-VOL.
The spread between 1-month and 3-month RV remains deeply inverted in a bullish direction. The 1-month has been grinding lower since the April spike. NVIDIA’s beat kept realized vol suppressed through the back half of last week.
The flip line condition for the vol signal: sustained 1-month RV above the 3-month. That will require multiple and consecutive days of large moves. A single bad PCE print on Thursday will likely not accomplish it alone.
Bottom line: Low volatility forces vol-control funds to mechanically buy equities. Their formulas do not care about sentiment. At 10.58 on the 1-month, the signal is still long.
SYSTEMATIC FUND FLOWS
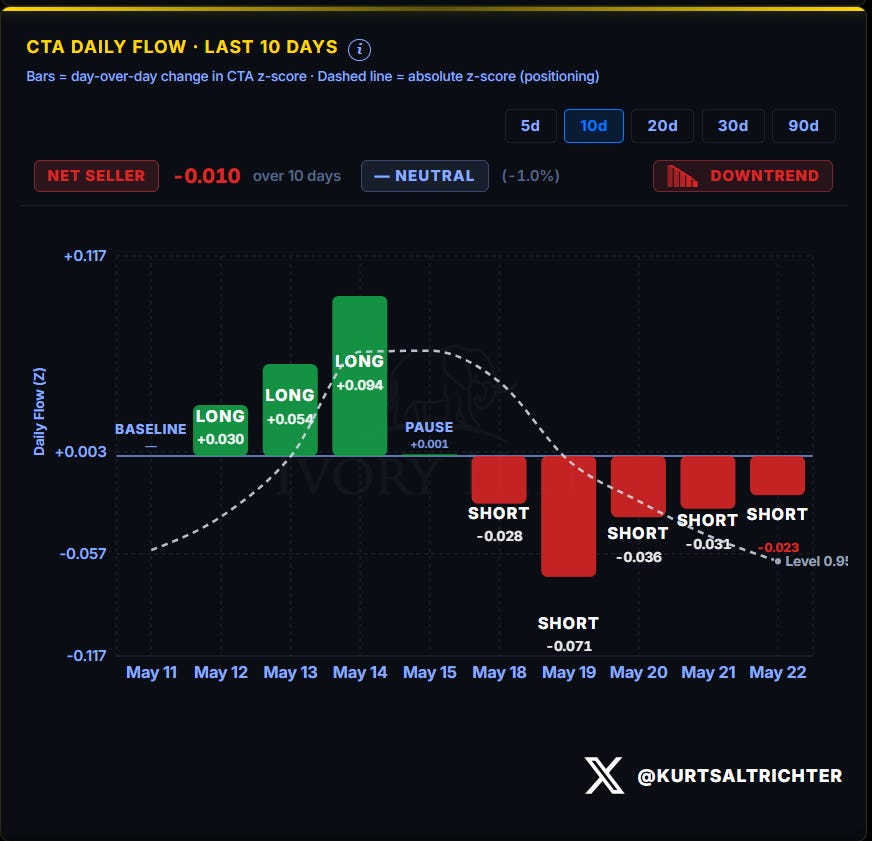
CTAs were net sellers in positioning over the last 10 days. The flow direction: four consecutive short days, with the largest single-day reduction on May 19. The absolute z-score sits near 0.95, still in bullish territory but trending lower.
Over the longer term, CTAs have rebounded from near-2022 bear market lows in late March to a z-score above +2.8 by early May. That was the largest and fastest rebuild in the historical data. What the 10-day chart shows is natural deceleration at the top of an extended trend. CTAs do not reverse without a trend signal breaking. The downtrend in flow is a warning, not yet a reversal.
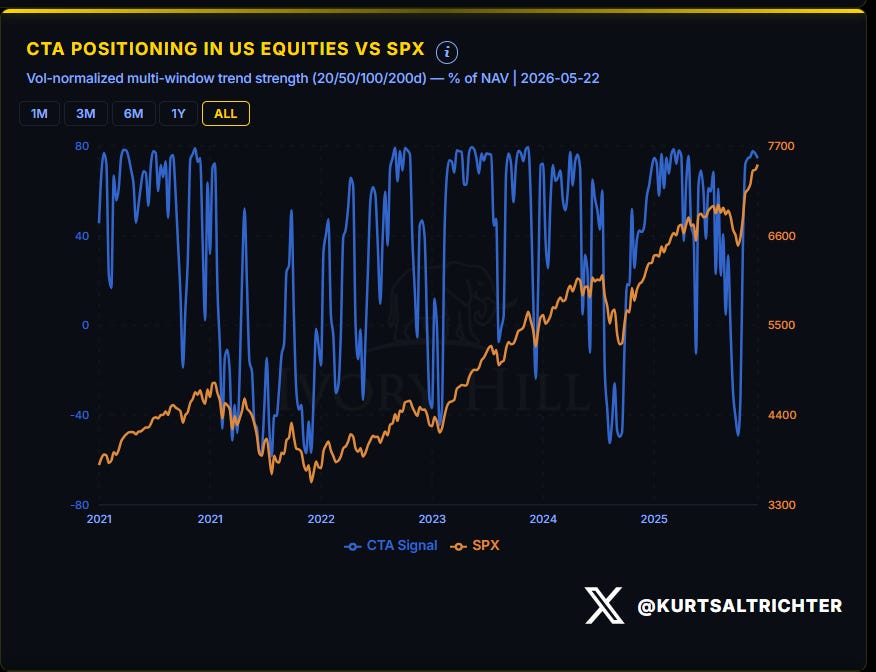
Positioning at these levels is the fuel for a sharp reversal if a trend break triggers systematic selling. It is not a problem until it is.
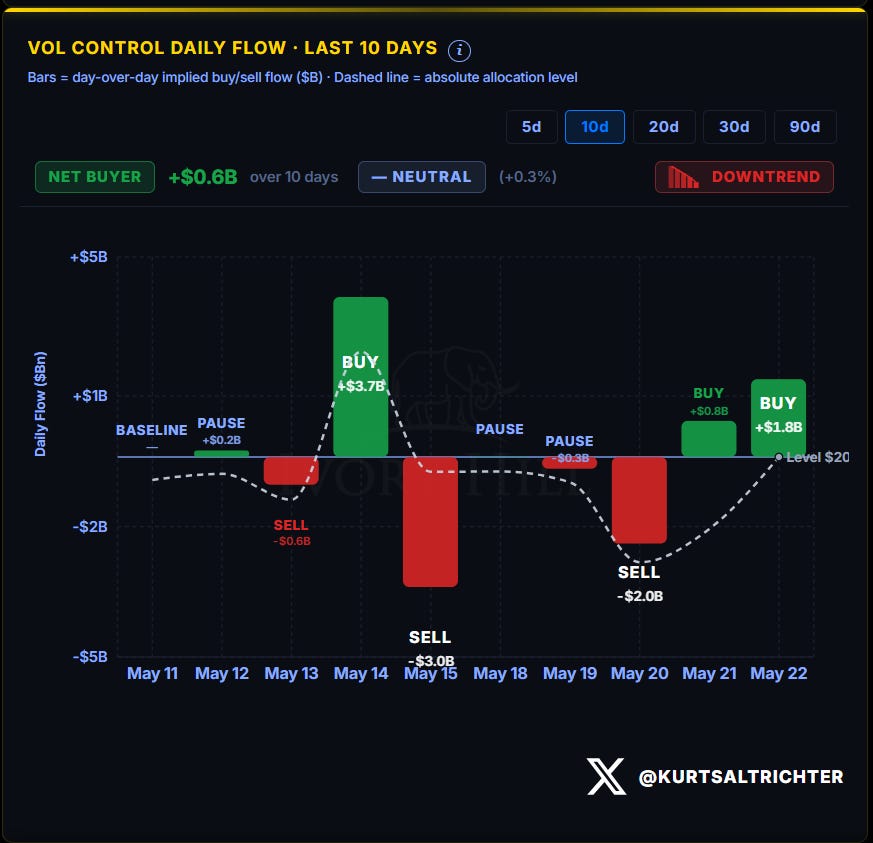
Vol-control funds were net buyers of $600 million over the last 10 days, but the flow pattern inside that window is not clean. The absolute allocation level sits near $200 billion.
Vol-control exposure has been oscillating over the past three weeks. If realized vol stays contained through the PCE week, the mechanical bid to add exposure will continue. If Thursday’s PCE produces a vol spike, the algos will sell automatically.
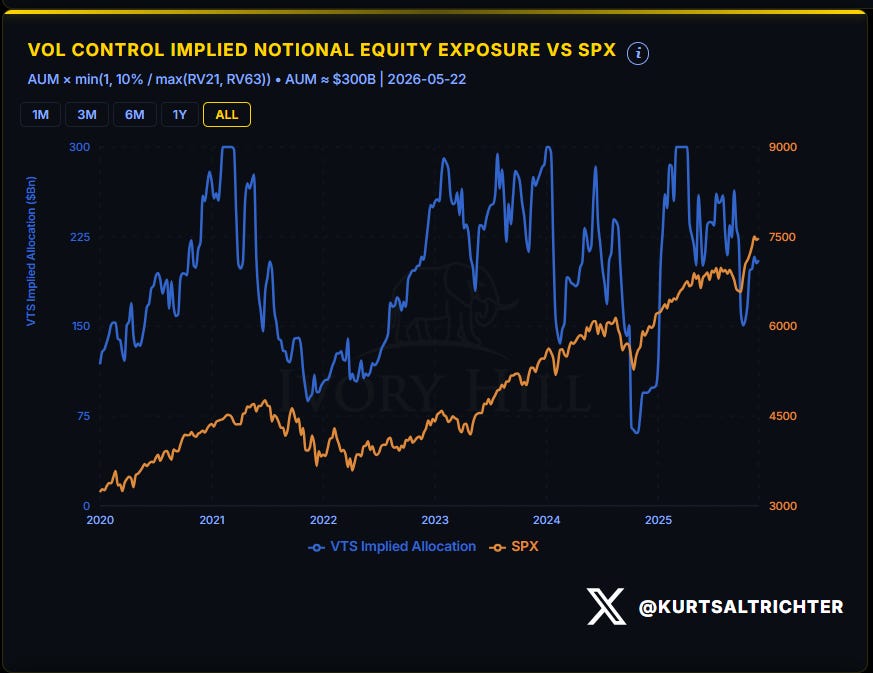
Against the historical baseline, roughly $75-$100 billion in potential allocation remains undeployed and enters mechanically only if realized vol continues lower.
SYSTEMATIC POSITIONING INDEX
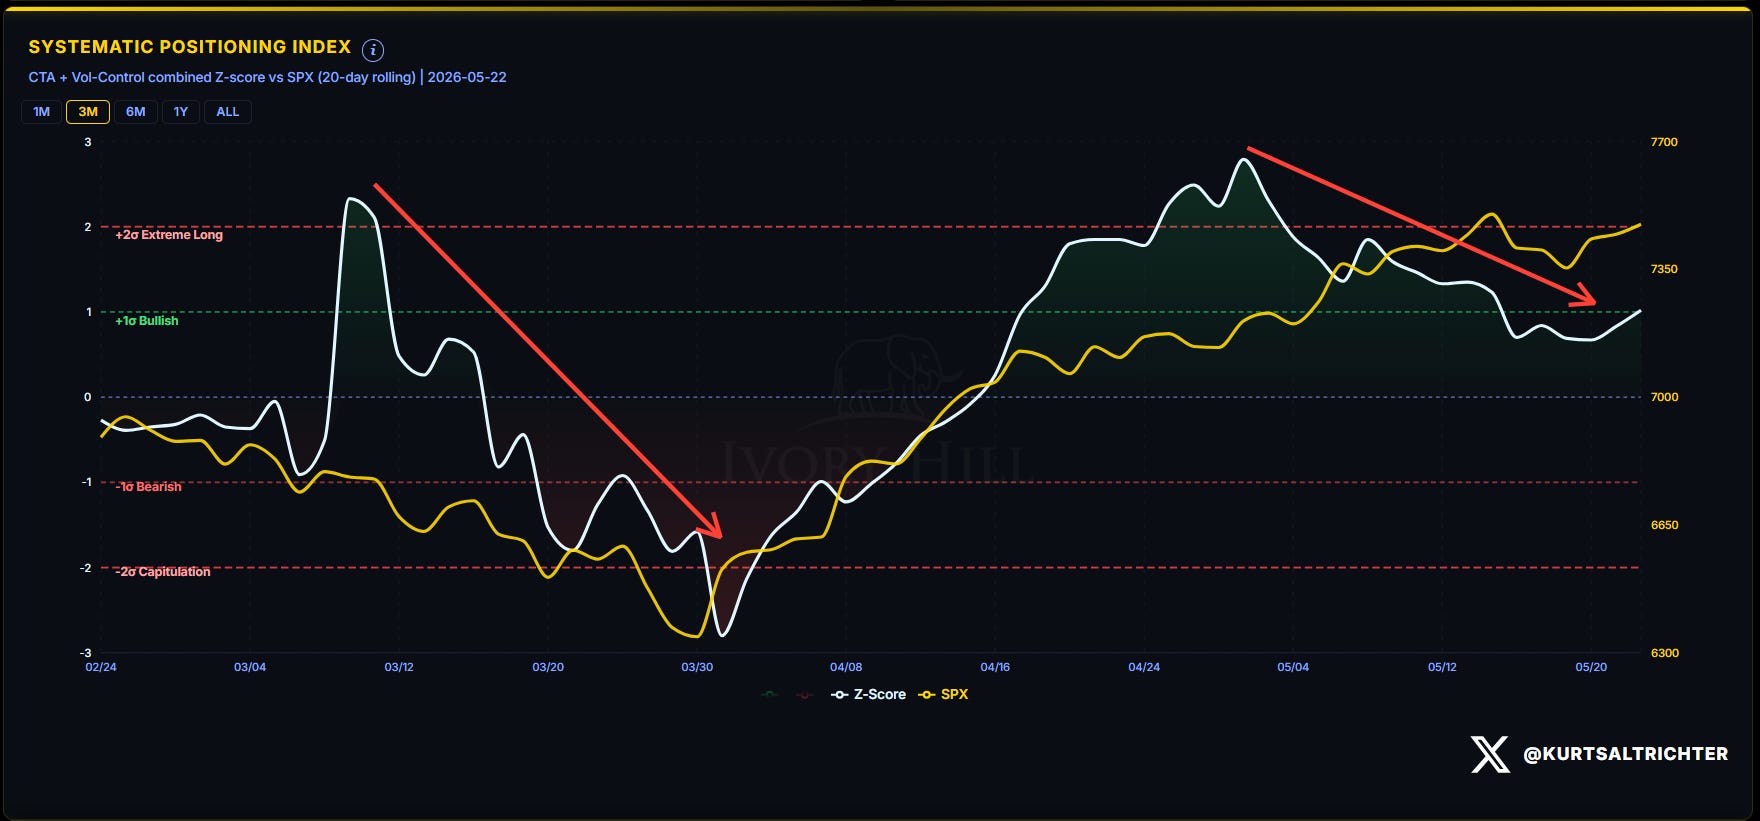
The combined CTA plus vol-control z-score is in the bullish zone between +1σ and +2σ. The z-score is at the lower boundary of that band.
Last week, I flagged this deceleration as likely. That call proved correct. The regime remains Bullish on systematic flows, but marginal buying pressure has decelerated. The next move lower on the z-score crosses into neutral territory and changes the flow signal from tailwind to neutral. Thursday’s PCE window could be a live test.
MARKET BREADTH
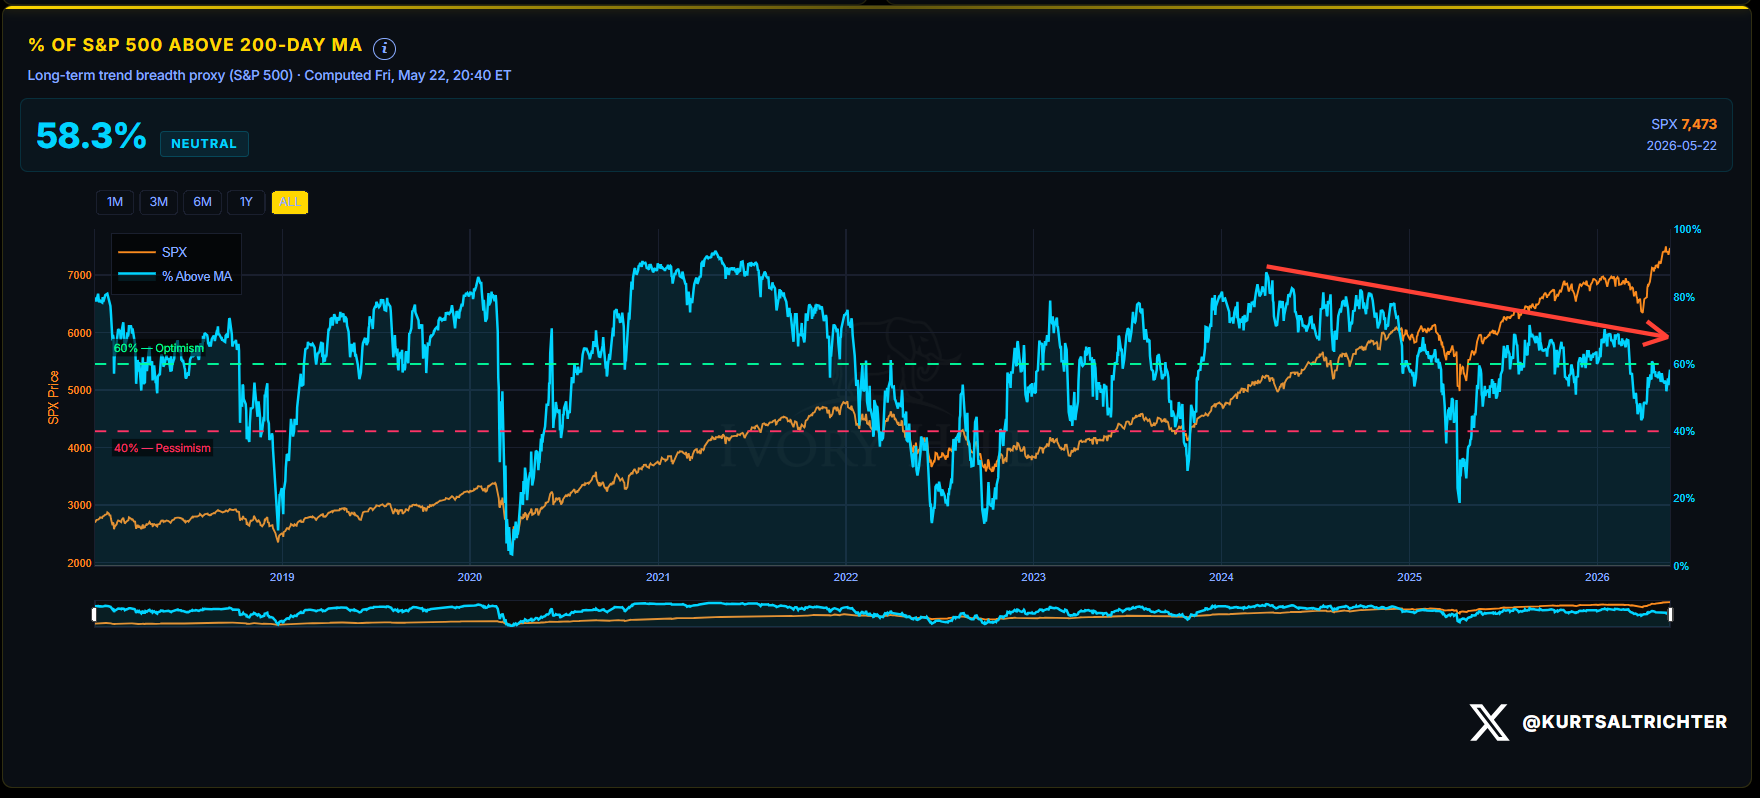
58.3% of S&P 500 members are trading above their 200-day moving average as of May 22. Signal: Neutral. Last week it was 51.7%.
The 6.6% point improvement in a single week is the most constructive breadth improvement in several weeks. NVIDIA’s print broadened participation across Technology and adjacent names. At 60%, the breadth signal is Bullish. The rally could be getting wider.
DEALER GAMMA DASHBOARD AND COMPOSITE REGIME
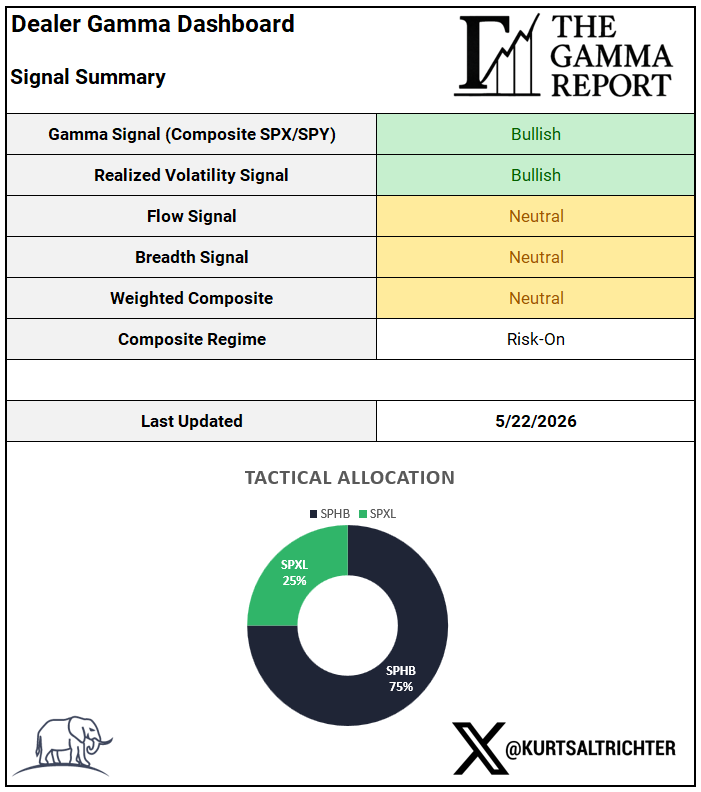
Two Bullish, two Neutral. The composite reads Risk-On because the gamma and vol signals carry sufficient weight against the two neutral readings.
The regime shifts if any of these conditions develop:
breadth breaks back below 40%,
1-month RV crosses above the 3-month on a sustained basis,
SPX closes below the gamma flip at 7,348, or CTA and vol-control flows both shift to net selling simultaneously. None are present as of Friday’s close.
TACTICAL ALLOCATION PERFORMANCE
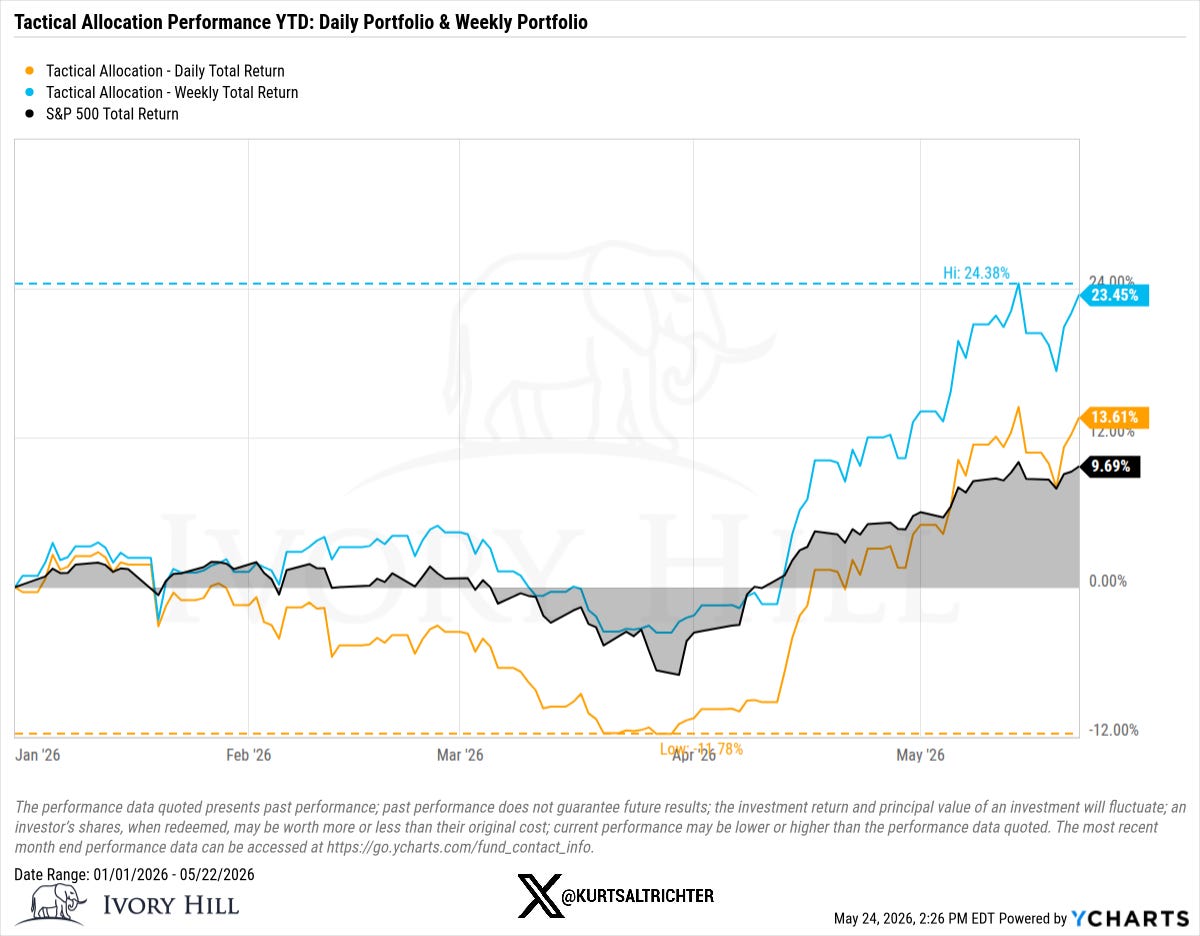
The weekly portfolio set an all-time high at 24.38% before pulling back to close at 23.45%. The daily portfolio recovered from its drawdown low of -11.78% in early April and is now +13.61% YTD. The S&P 500 Total Return sits at +9.69%.
This model is fully invested in equities at all times. It does not hold cash or bonds. The comparison to the S&P 500 Total Return is informative but incomplete. The model’s purpose is to navigate equity beta, not to outperform via asset-class diversification. The outperformance in this regime reflects structural positioning in higher-beta equities during a sustained positive gamma, low-vol, Risk-On environment.
And remember - The one fact pertaining to all conditions is that they will change.
Feel free to use me as a sounding board.
Follow me on X for more updates.
Best regards,
Schedule a call with me by clicking HERE
Kurt S. Altrichter, CRPS®
Wealth Advisor | President
Disclosure
The Gamma Report is published by Ivory Hill, LLC. All opinions and views expressed in this report reflect our analysis as of the date of publication and are subject to change without notice. The information contained herein is for informational and educational purposes only and should not be considered specific investment advice or a recommendation to buy or sell any security.
The data, models, and tactical allocations discussed in this report are designed to illustrate market structure and positioning trends and may differ from portfolio decisions made by Ivory Hill, LLC or its affiliates. Investing involves risk, including the possible loss of principal. Past performance is not indicative of future results.
Ivory Hill, LLC, and its members, officers, directors, and employees expressly disclaim any and all liability for actions taken based on the information contained in this report.