

The tactical allocation remains bullish for the fourth consecutive week in a row. The structure held through a very heavy macro and earnings week. Dealer gamma is positive, and the flip line is rising. Systematic funds are buying, but likely not for much longer. Your job this week is to hold position while the vol term structure hands you a quieter tape heading into payrolls.
THIS WEEK’S GAME PLAN
The Battlefield: Economic Events & Short-Term Vol Structure
The Economic Event Calendar with Short-Dated Vol Term Structure is your early warning system. When implied volatility around a specific event is low relative to what the market can actually move, surprises hurt more. When it’s already priced high, the hedgers have done their panicking ahead of time, and there is nobody left to panic.
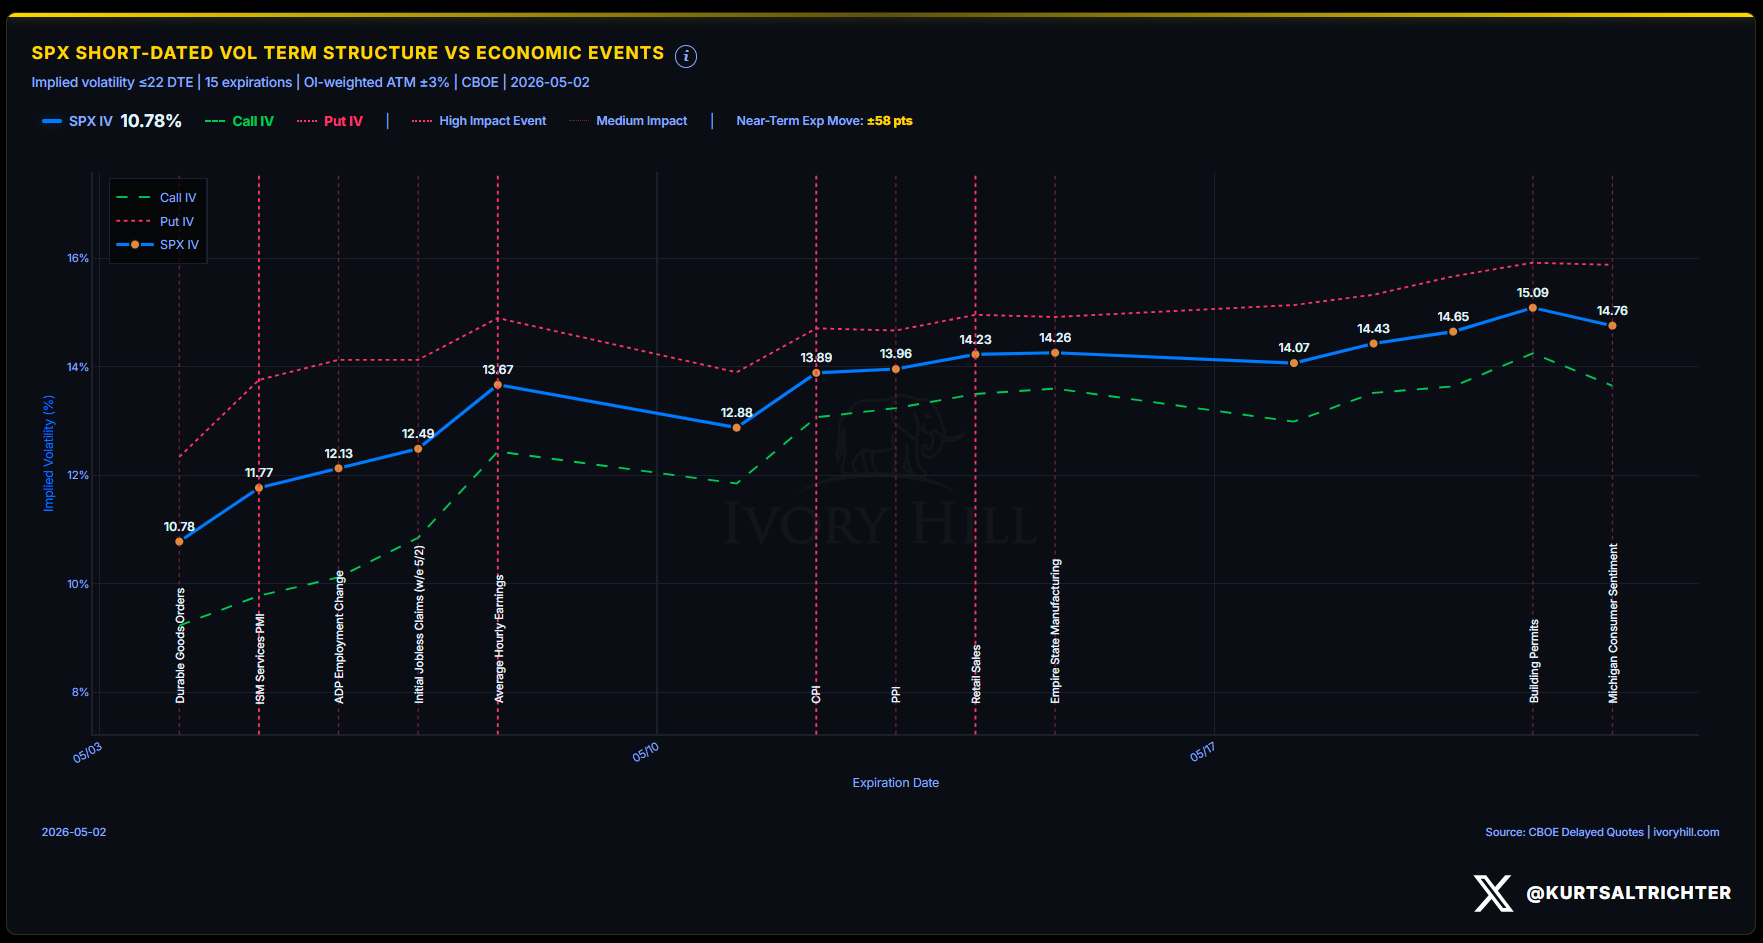
S&P 500 implied volatility (IV) sits at 10.78% as of May 2. The term structure slopes up from there: 11.77% by May 5, 12.49% by the Initial Jobless Claims print on May 7, and 13.67% by Average Hourly Earnings on May 8. Put IV runs above Call IV across every expiration shown.
The skew is elevated but orderly. Traders have already paid for protection around payrolls. That front-loaded hedging is a stabilizing force for the market.
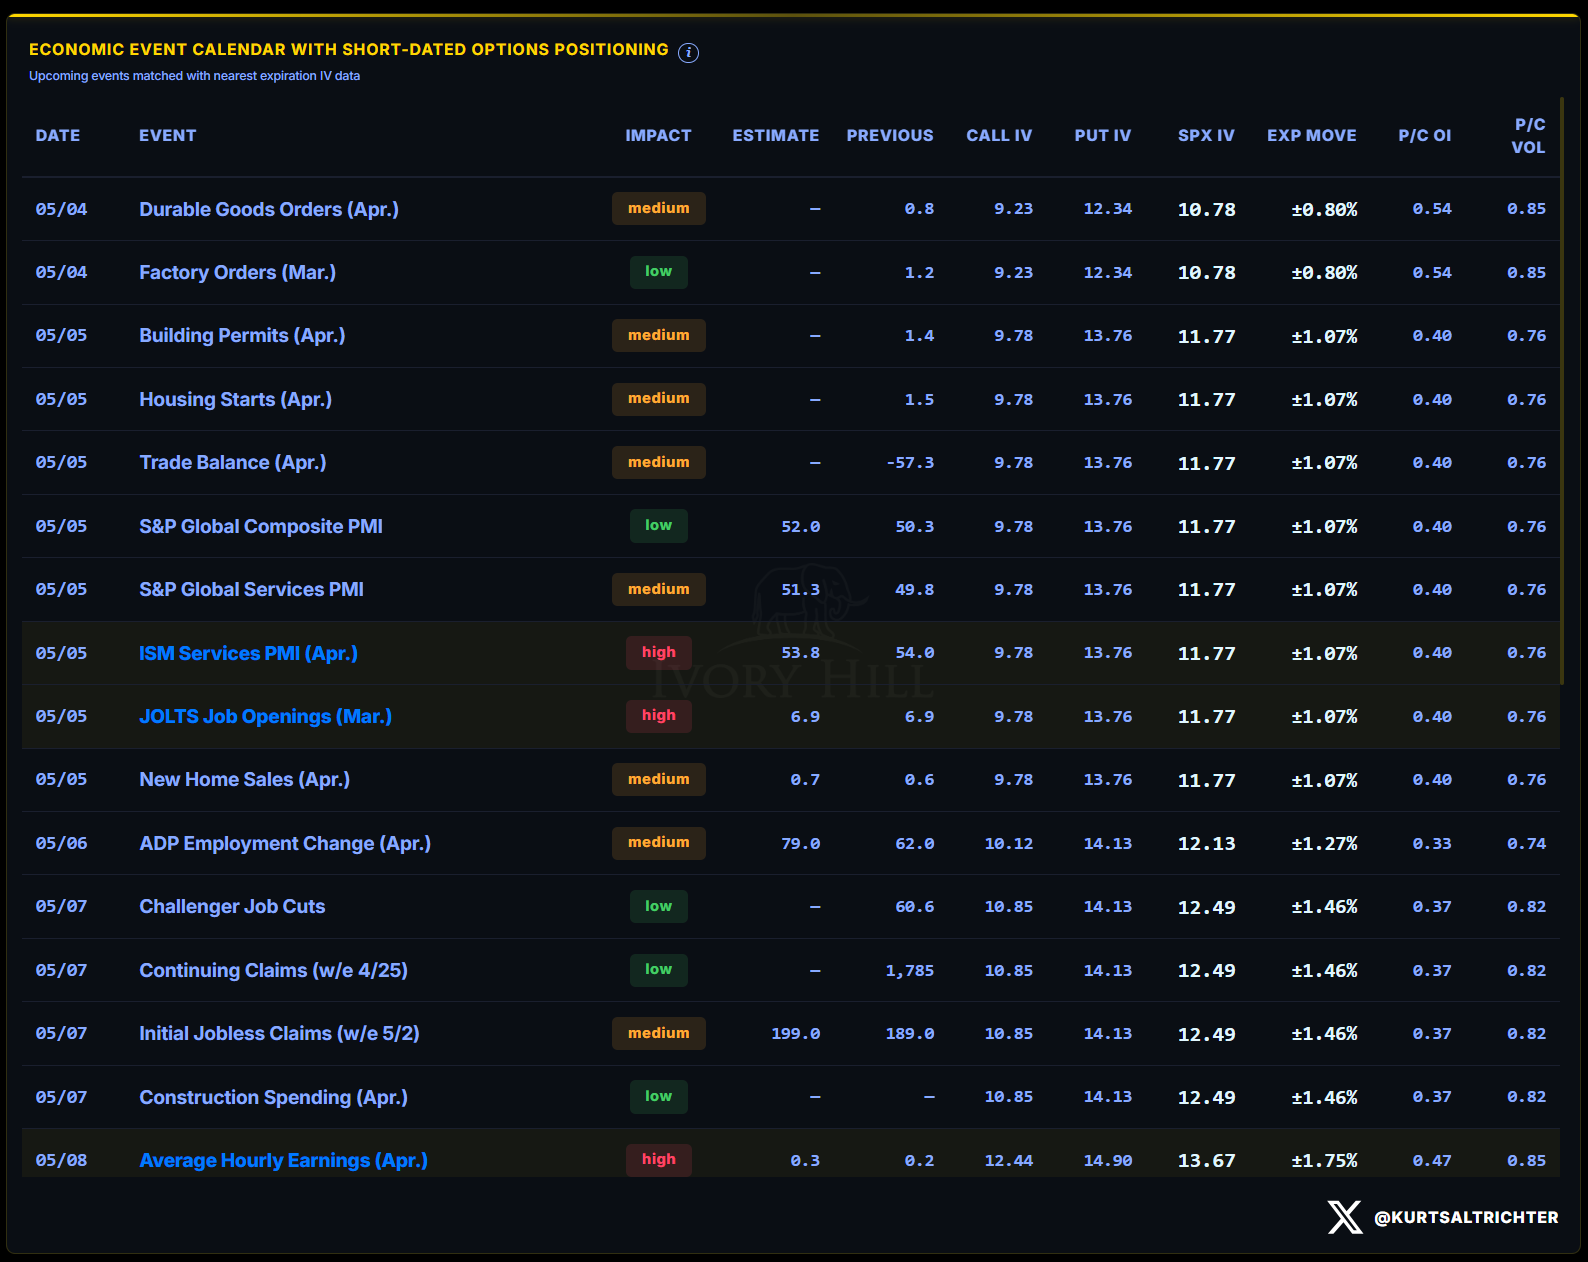
This week’s key events and what the options market is pricing:
Monday, May 4 (today): Durable Goods Orders and Factory Orders, with ±0.80% expected move priced. Low near-term vol. Low structural impact, but a significant miss could nudge short-dated vol higher into Tuesday’s heavier prints.
Tuesday, May 5: ISM Services PMI (high impact) and JOLTS Job Openings (high impact), both in the May 5 expiration pricing ±1.07% expected move. ISM estimate is 53.8 vs 54.0 prior. JOLTS estimate 6.9M vs 6.9M prior. Both are consensus prints. A miss on ISM Services would be the week’s first surprise risk.
Wednesday, May 6: ADP Employment Change, with ±1.27% expected move priced. Estimate 79K vs 62K prior. The beat expectation is high here.
Thursday, May 7: Initial Jobless Claims, with ±1.46% expected move priced. Estimate 199K vs 189K prior.
Friday, May 8: Average Hourly Earnings (high impact), with ±1.75% expected move priced. Estimate +0.3% vs +0.2% prior. This is the week’s highest-vol expiration and the number that matters most for the Fed’s wage inflation read.
Your tactical edge: Near-term vol is low. Today’s Durable Goods and Factory Orders carry minimal pricing. The ISM Services and JOLTS prints on Tuesday carry the most surprise potential before payroll noise dominates Thursday and Friday.
MOMENTUM PULSE CHECK
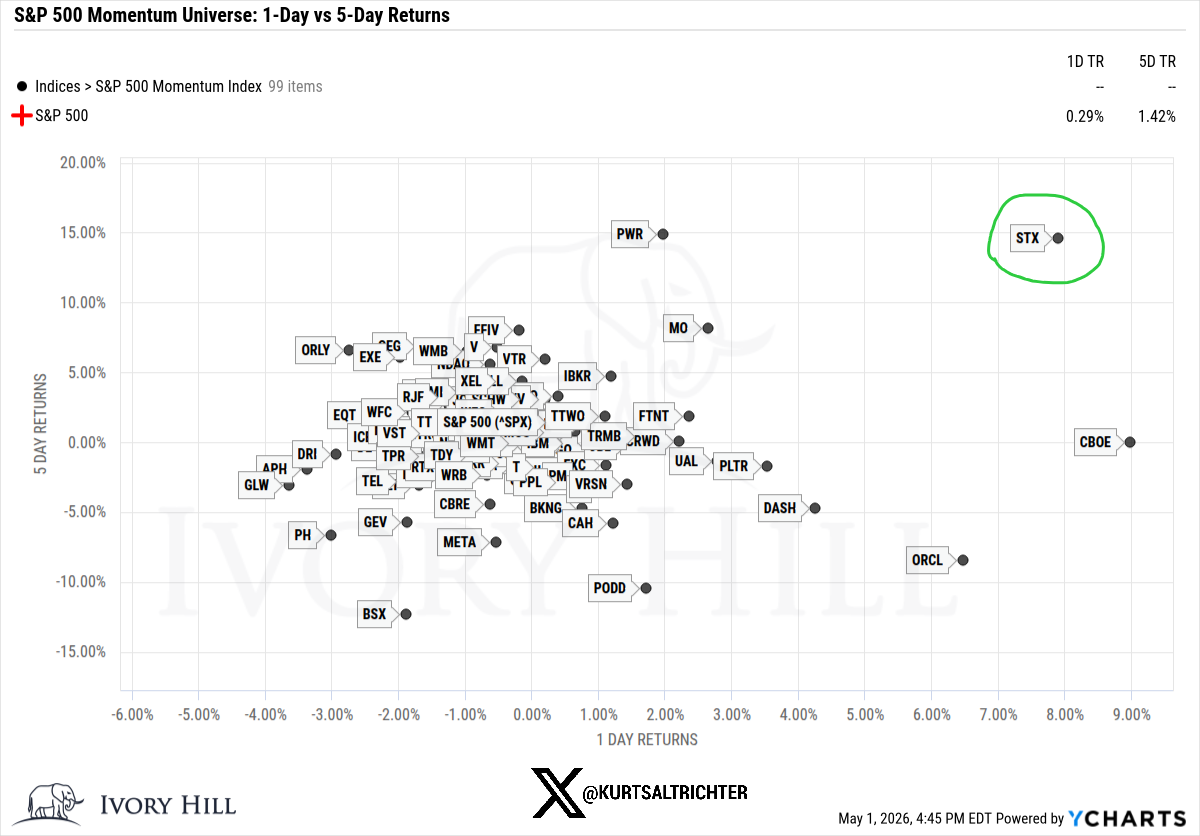
The momentum universe shows healthy dispersion as of May 1. Seagate Technology Holdings PLC STX 0.00%↑ is the standout in the top-right quadrant with strong 5-day and 1-day returns.
PWR 0.00%↑ is holding 5-day gains. MO 0.00%↑ and IBKR 0.00%↑ are positioned well. On the other side, BSX 0.00%↑ ORCL 0.00%↑ and META 0.00%↑ have underperformed on both timeframes. The S&P 500 itself showed +0.29% on the day and +1.42% over five days.
This is not a momentum universe chasing one theme. Broad dispersion across names is the signature of rotation, not exhaustion.
EARNINGS: THE WEEKLY STRESS TEST
This is a heavy earnings week. Key names by index impact:
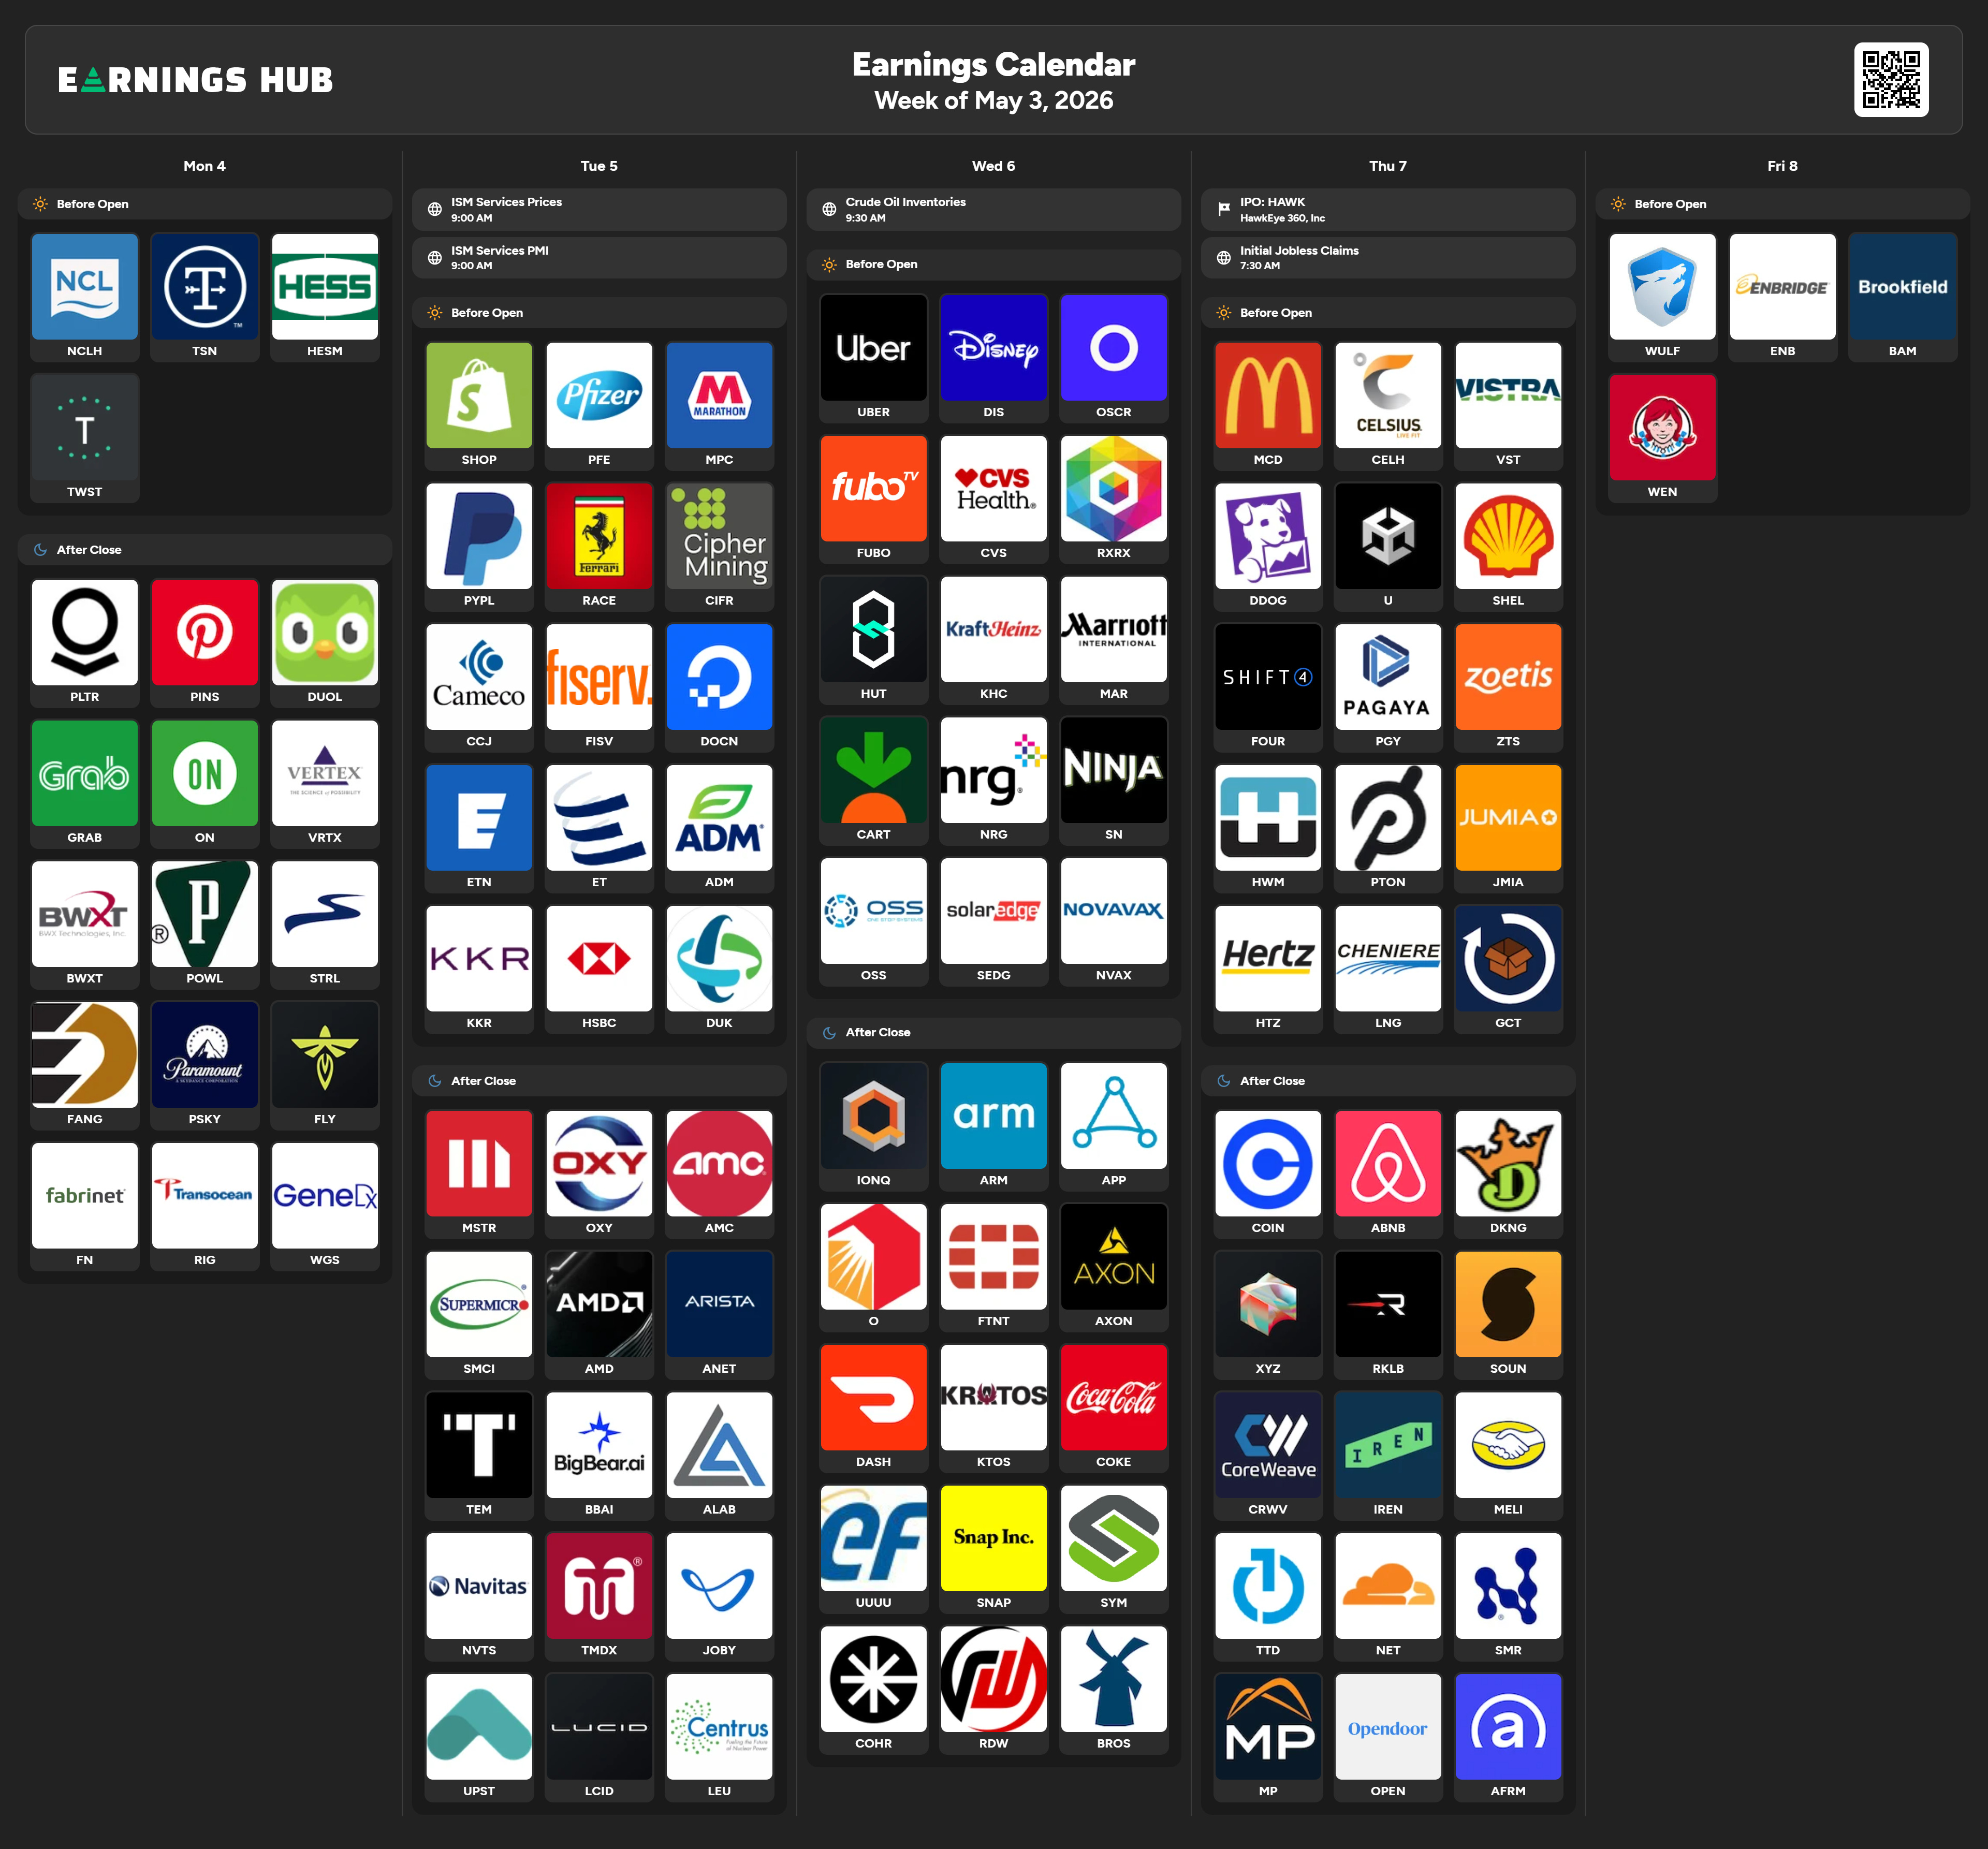
Monday, May 4 (after close): Palantir (PLTR). Momentum name with a retail following and a tendency to move the tape on sentiment. A beat with strong guidance keeps the risk-on tone intact heading into Tuesday’s macro prints.
Tuesday, May 5: AMD 0.00%↑ , PayPal PYPL 0.00%↑ , Ferrari RACE 0.00%↑ KKR 0.00%↑ Shopify SHOP 0.00%↑ , Pfizer PFE 0.00%↑ . AMD 0.00%↑ carries the most systematic weight. A guide-down here would hit the broader tech complex.
Wednesday, May 6: Uber, Disney DIS 0.00%↑ , ARM 0.00%↑ , Fortinet FTNT 0.00%↑ , Axon AXON 0.00%↑ , Coca-Cola KO 0.00%↑ . Disney and ARM are the names with the most cross-sector read-through.
Thursday, May 7: McDonald’s MCD 0.00%↑ , Datadog DDOG 0.00%↑ , Zoetis ZTS 0.00%↑ , Shift4 FOUR 0.00%↑ , CoreWeave CRWV 0.00%↑ , The Trade Desk TTD 0.00%↑ , Cloudflare NET 0.00%↑ , Coinbase COIN 0.00%↑ , Airbnb ABNB 0.00%↑ . Coinbase and Airbnb report after the close, as consumer sentiment reads.
Friday, May 8: Brookfield BAM 0.00%↑ , Enbridge ENB 0.00%↑ .
The key risk this week is AMD on Tuesday. A negative guide hits breadth before Thursday’s macro prints even land.
MARKET STRUCTURE: YOUR FOUNDATION
Gamma Positioning: The Anchor Point
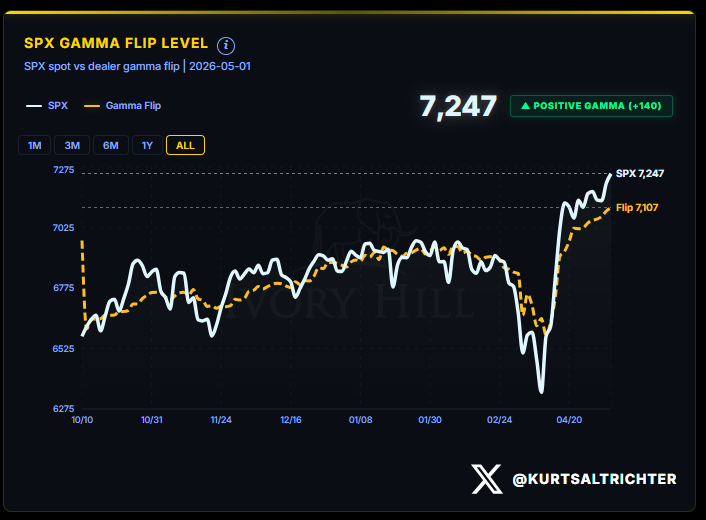
The S&P 500 closed May 1 at 7,247. The gamma flip line sits at 7,107. Spot is 140 points above the flip, in positive gamma territory. Above the flip, dealers sell into strength and buy into weakness. That mechanical behavior is what keeps intraday ranges contained.
The flip line itself is rising. It was 6,983 on April 27. It is 7,107 on May 1. That 124-point move in the flip over one week means dealer positioning is anchoring at progressively higher levels. The structure is not just intact. It is improving.
Weekly expected moves for the week of May 4th.
1-sigma range: 7,109 to 7,351, roughly ±1.67% in either direction. 2-sigma range: 6,989 to 7,471, roughly ±3.3% in either direction.
The GEX flip for the week sits at 7,065. That is your structural floor. A close below 7,065 on volume flips dealer hedging mechanics from supportive to amplifying. Stay above it, and positive gamma remains your shock absorber.
REALIZED VOLATILITY: THE VOL-CONTROL LOCK
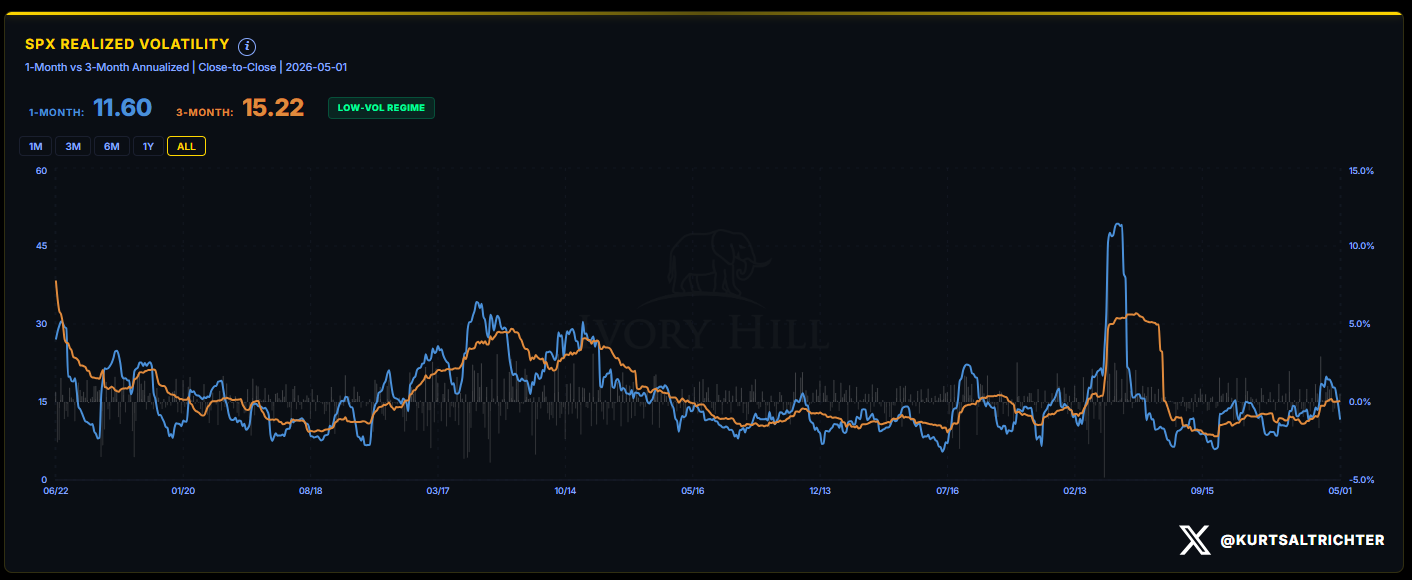
30-day realized volatility: 11.60. 90-day realized volatility: 15.22. The model is reading LOW-VOL REGIME.
Last week, 30-day vol was running at 17.80. It has dropped sharply as the post-April spike rolls off the lookback window. The 30-day is now well below the 90-day. That inversion is the mechanical trigger for vol-control funds. When short-dated vol runs below long-dated vol, these algorithms increase equity exposure systematically.
Vol-control implied notional equity exposure has been rising off the lows, but it remains well below the $225-$300 billion range that characterized late 2024 and early 2025. The dry powder is still there, but the buying is fading.
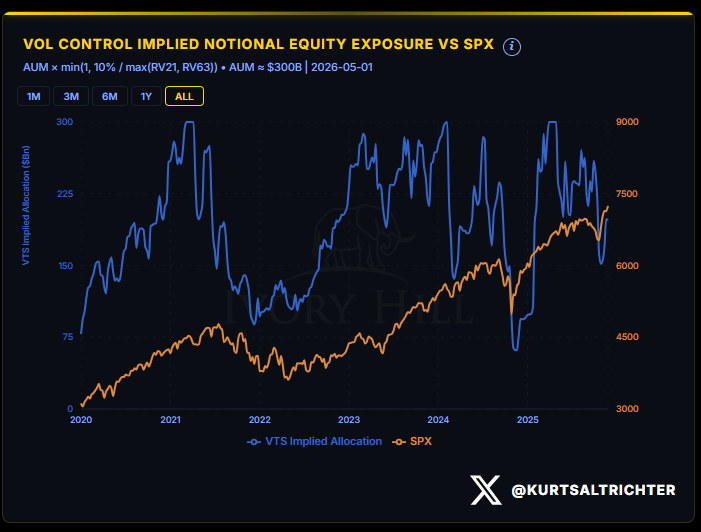
The vol-control trend signal flipped to Flat on May 1. The directional improvement has paused. Exposure has been rebuilding, but the pace has leveled off. That does not mean exposure has rolled over. The exposure level itself remains supportive. Watch for the trend to re-engage Rising if realized vol stays suppressed through the week.
SYSTEMATIC FLOWS: THE MOMENTUM BEHIND THE MOMENTUM
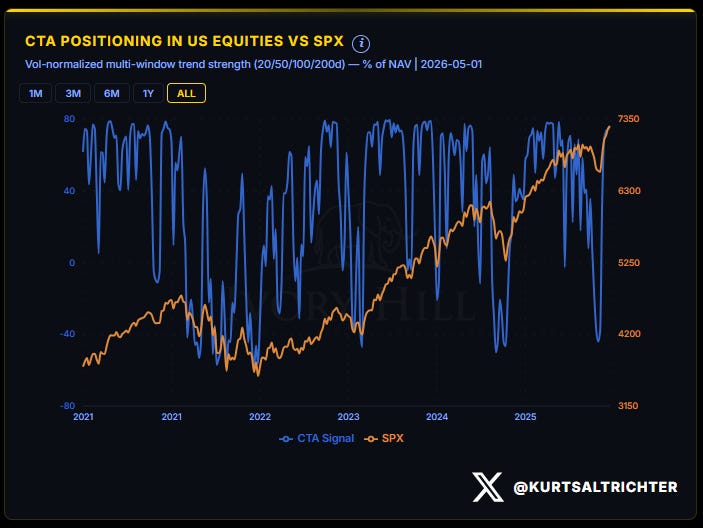
CTA trend signal: Flat. CTAs flipped from bearish to bullish positioning over a two-week window and are now sitting extended. The easy repositioning move has been made.
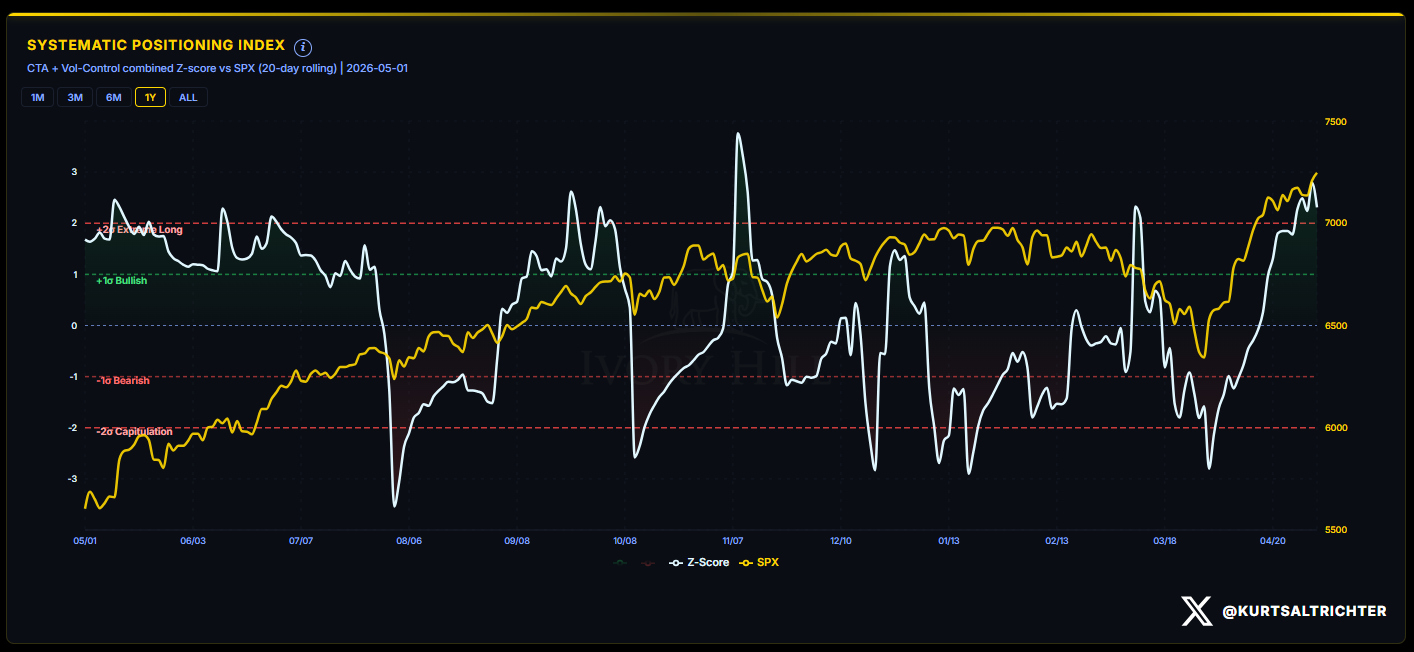
The Systematic Positioning Index Z-score has moved to approximately +3, into extreme-long territory above the +2 sigma threshold. A week ago, it was recovering from near -2.5. That swing captured the CTA repositioning cycle in real time.
At +3 sigma, CTAs are not a source of incremental buying. They are positioned. The next catalyst for their flows is either a volatility spike that forces deleveraging or a vol decline that allows vol-control funds to take the baton.
The flow signal reads Neutral. That is the correct read. CTAs are done buying. Vol-control funds are rebuilding but have paused their trend. Net systematic positioning is supportive of the market staying up, not a source of new fuel to push it higher from here.
BREADTH: THE PARTICIPATION READ
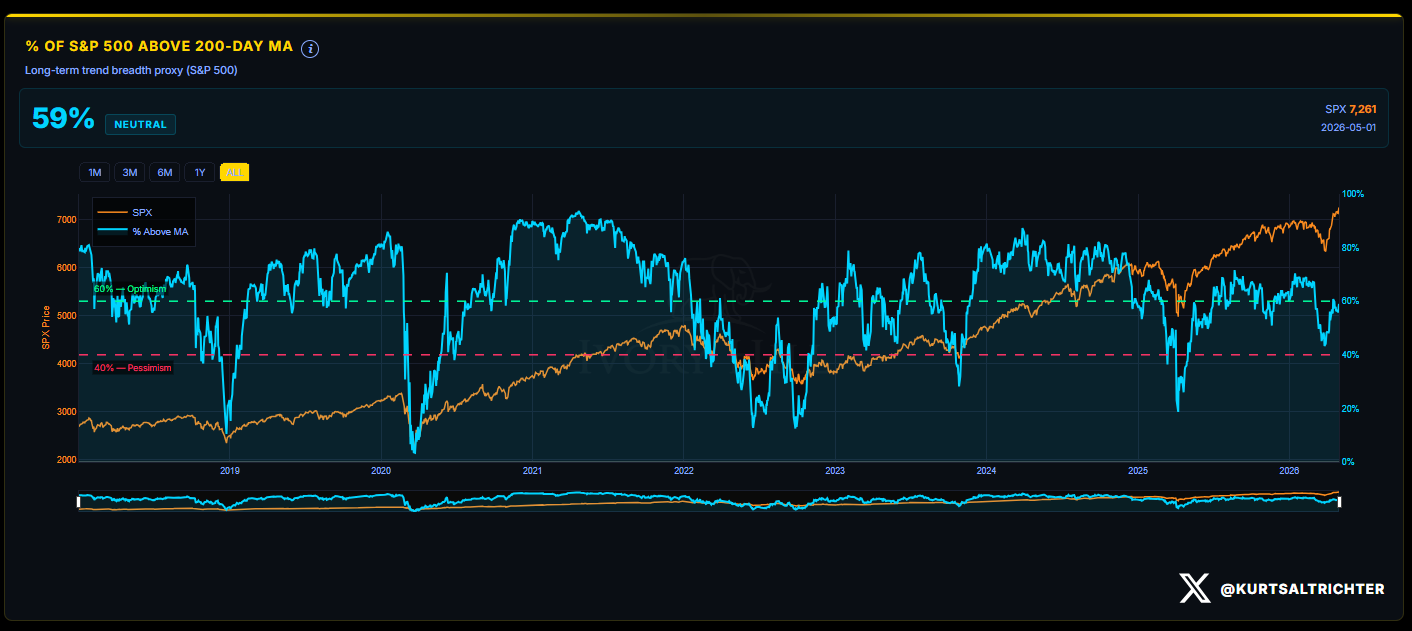
59% of S&P 500 components are trading above their 200-day moving average as of May 1. The model tags this Neutral, below the 60% optimism threshold.
One percentage point from the threshold. That number has been climbing from below 50% just weeks ago. The trend is in the right direction. Breadth has not confirmed a full broad-based bull signal yet, but it is knocking on the door.
Narrow rallies fail. This one has been broadening. 59% participation heading into a heavy earnings week is a structure that can survive a bad print from one sector without collapsing the whole tape.
COMPOSITE SIGNAL: RISK-ON
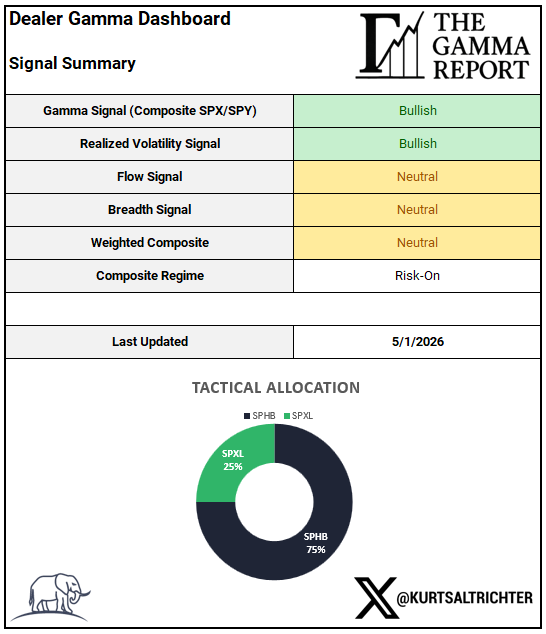
Tactical Allocation: 75% SPHB / 25% SPXL
Two signals are Bullish, two are Neutral. The Weighted Composite lands Neutral, but the composite regime reads Risk-On because the gamma and vol signals carry more structural weight than flow and breadth at this stage of the cycle.
TACTICAL ALLOCATION PERFORMANCE
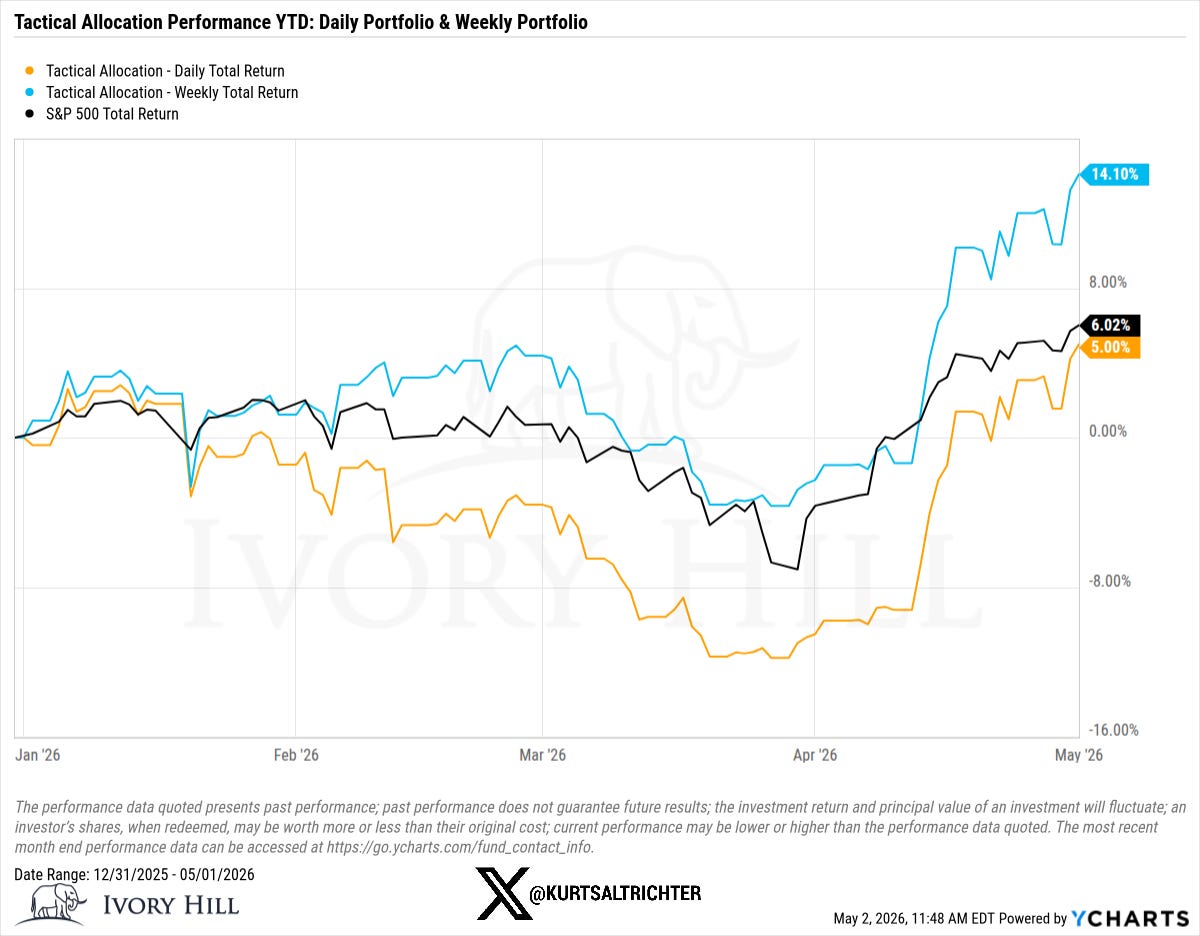
Through May 1, 2026:
Weekly portfolio: +14.10% YTD Daily portfolio: +5.00% YTD S&P 500 Total Return: +6.02% YTD
The weekly-rebalanced portfolio is running more than 800 basis points ahead of the benchmark. The daily model has recovered meaningfully from its March trough and is now running in line with the index. The alpha gap between the two models reflects the precision of regime entry timing.
BOTTOM LINE
Risk-On holds for the fourth consecutive week. The structure that got you here is intact.
Dealer gamma is positive. The flip line is at 7,107 and rising. Realized vol has dropped to 11.60, LOW-VOL REGIME, and vol-control funds are mechanically rebuilding exposure. CTAs are positioned and extended. Breadth is at 59%, one point from confirming a full broad-based signal.
The week’s risks are concentrated: AMD earnings on Tuesday, ISM Services and JOLTS on Tuesday morning, and Average Hourly Earnings on Friday. Any one of those can spike short-dated vol. A sustained vol spike is the mechanical trigger for vol-control deleveraging and the one event that changes the regime.
Stay disciplined. You are managing momentum, not chasing it.
What can break this setup:
Close below 7,065 (GEX flip; dealer mechanics shift)
Realized vol spike above 20% (vol-control deleveraging trigger)
AMD guide-down Tuesday (breadth reversal risk before macro prints land)
Average Hourly Earnings beat Friday (wage inflation re-pricing risk)
What to monitor:
ISM Services PMI on Tuesday, a low-vol event that can surprise
AMD after-close Tuesday, index-weight earnings with systematic read-through
Vol-control trend signal, watch for re-engagement to Rising if vol stays suppressed
And remember - The one fact pertaining to all conditions is that they will change.
Feel free to use me as a sounding board.
Follow me on X for more updates.
Best regards,
Schedule a call with me by clicking HERE
Kurt S. Altrichter, CRPS®
Wealth Advisor | President
Disclosure
The Gamma Report is published by Ivory Hill, LLC. All opinions and views expressed in this report reflect our analysis as of the date of publication and are subject to change without notice. The information contained herein is for informational and educational purposes only and should not be considered specific investment advice or a recommendation to buy or sell any security.
The data, models, and tactical allocations discussed in this report are designed to illustrate market structure and positioning trends and may differ from portfolio decisions made by Ivory Hill, LLC or its affiliates. Investing involves risk, including the possible loss of principal. Past performance is not indicative of future results.
Ivory Hill, LLC, and its members, officers, directors, and employees expressly disclaim any and all liability for actions taken based on the information contained in this report.
This is a comprehensive analysis. Thank you