

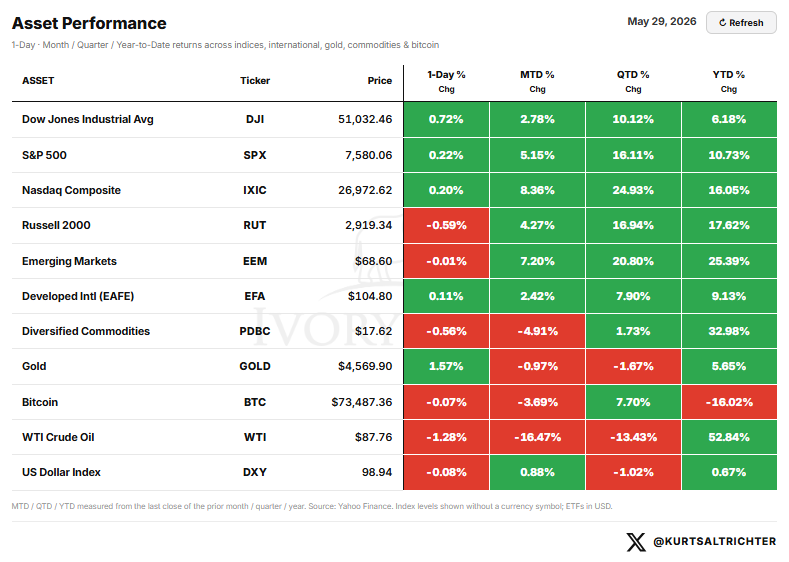
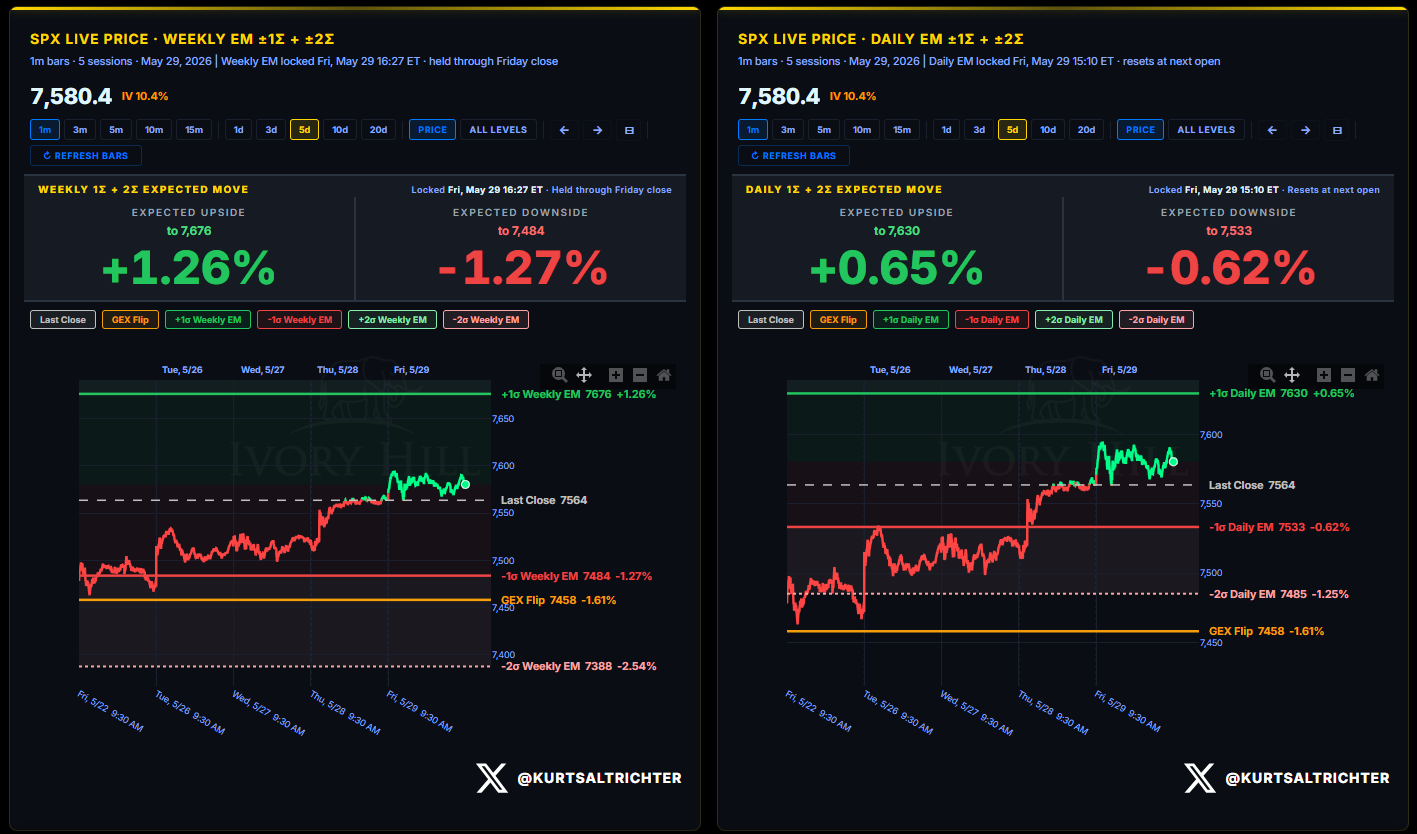
The S&P 500 closed Friday at 7,580, and tagged the upper bound of the weekly expected move that I posted in last week’s report.

IMPLIED CORRELATION: THE DISPERSION SIGNAL
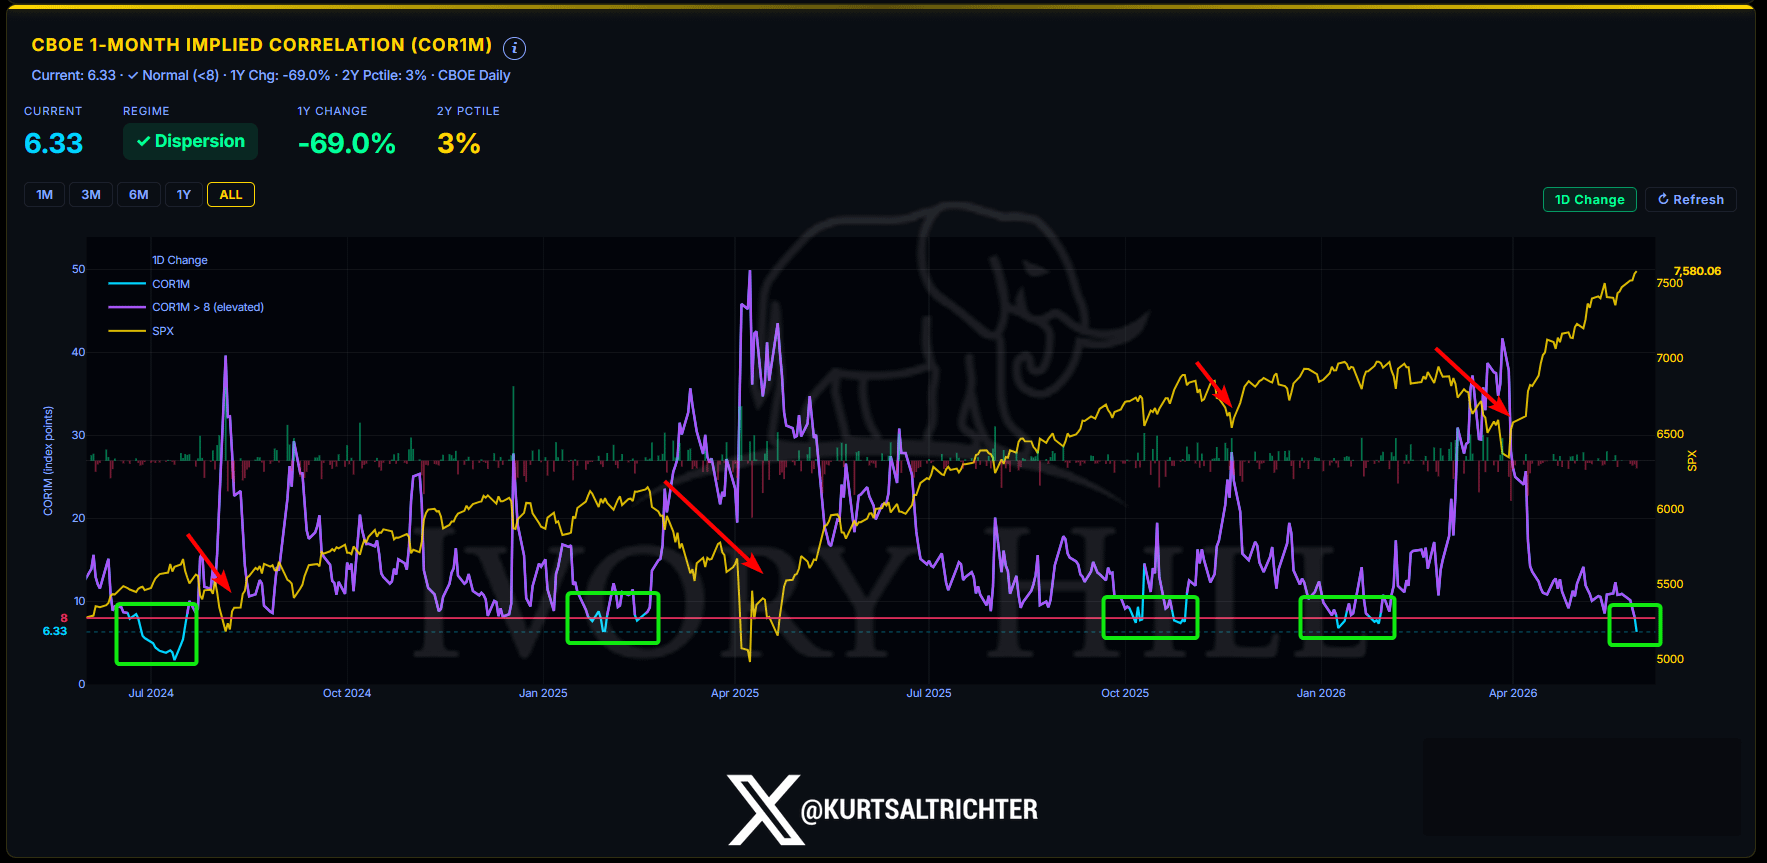
COR1M is at 6.33. 3rd percentile of the two-year range. Down 69% year over year.
The purple line measures how closely the stocks in the S&P 500 move together on any given day. When it's high, everything is going up or down at the same time. When it's low, stocks are doing their own thing independently.
Below 8, stocks trade on fundamentals. Above 8, the market moves as one instrument on macro. Every spike above 8 on this chart lines up with a drawdown.
At 6.33, stocks are doing their own thing. IBM is up 17% because of IBM. BSX is down 15% because of BSX. They have nothing to do with each other. No single thread to pull that unravels the whole thing.
A crowded macro trade unwinds fast. Hundreds of uncorrelated single-stock moves do not. Inside positive gamma and 10.17 realized vol, this is anecdotal evidence that the structure is confirming itself.
When this reading is pinned to the floor, the risk is not a broad market selloff. The risk is being in the wrong stock. “It’s a stock picker’s market.” Your name selection is what either kills or makes your return. That is why breadth at 58.3% can coexist with SPX at all-time highs. The index doesn’t need everything to participate. It needs the right things to participate. Right now, they are.
The signal to worry about is not low correlation. The signal to worry about is when this line starts moving back toward 8 with a high rate of change. That means something macro is about to override fundamentals. NFP on Friday and CPI on June 10 are the two catalysts with enough weight to do it.
THE ECONOMIC EVENT CALENDAR AND VOL TERM STRUCTURE
The term structure slopes upward through the back half of the week, with Friday’s payrolls print carrying the heaviest volatility premium in the short-term.
Monday, June 1 (today): ISM Manufacturing PMI for May, estimated 52.6 versus a prior of 52.7. S&P Global Manufacturing PMI is estimated at 55.3 versus a prior of 54.5. SPX IV at this expiration is 11.25, implying a move of ±1.02% in either direction. Two manufacturing prints on the same morning create a little divergence risk. ISM has been the weaker of the two surveys all year.
Tuesday, June 2: JOLTS Job Openings for April, estimated 6.8M versus a prior of 6.9M. SPX IV at this expiration is 11.51, implying ±1.20%.
Wednesday, June 3: ADP Employment Change estimated at 109K, matching the prior of 109K. ISM Services PMI is estimated at 53.6, matching the prior of 53.6. SPX IV is implying ±1.38%. ISM Services holding at 53.6 is the number to watch. A contraction in services changes the narrative heading into Friday.
Thursday, June 4: Initial Jobless Claims for the week ending May 30, prior 215K. SPX IV, implying ±1.55%.
Friday, June 5: Nonfarm Payrolls for May, estimated at 85K versus a prior of 115K. Average Hourly Earnings estimated at 0.3% versus a prior of 0.2%. Unemployment Rate prior to 4.3%. SPX IV, implying ±1.75%.
The 85K payroll estimate is the number to watch this week. A print at or below that confirms continued labor deceleration. A beat above last month’s 115K resets the narrative and likely pushes the S&P 500 index toward the weekly upper expected move of 7,676. The wage number matters equally. Earnings at 0.3% month-over-month, alongside a soft payroll print, are a stagflation-lite story that the market will not like.
EARNINGS
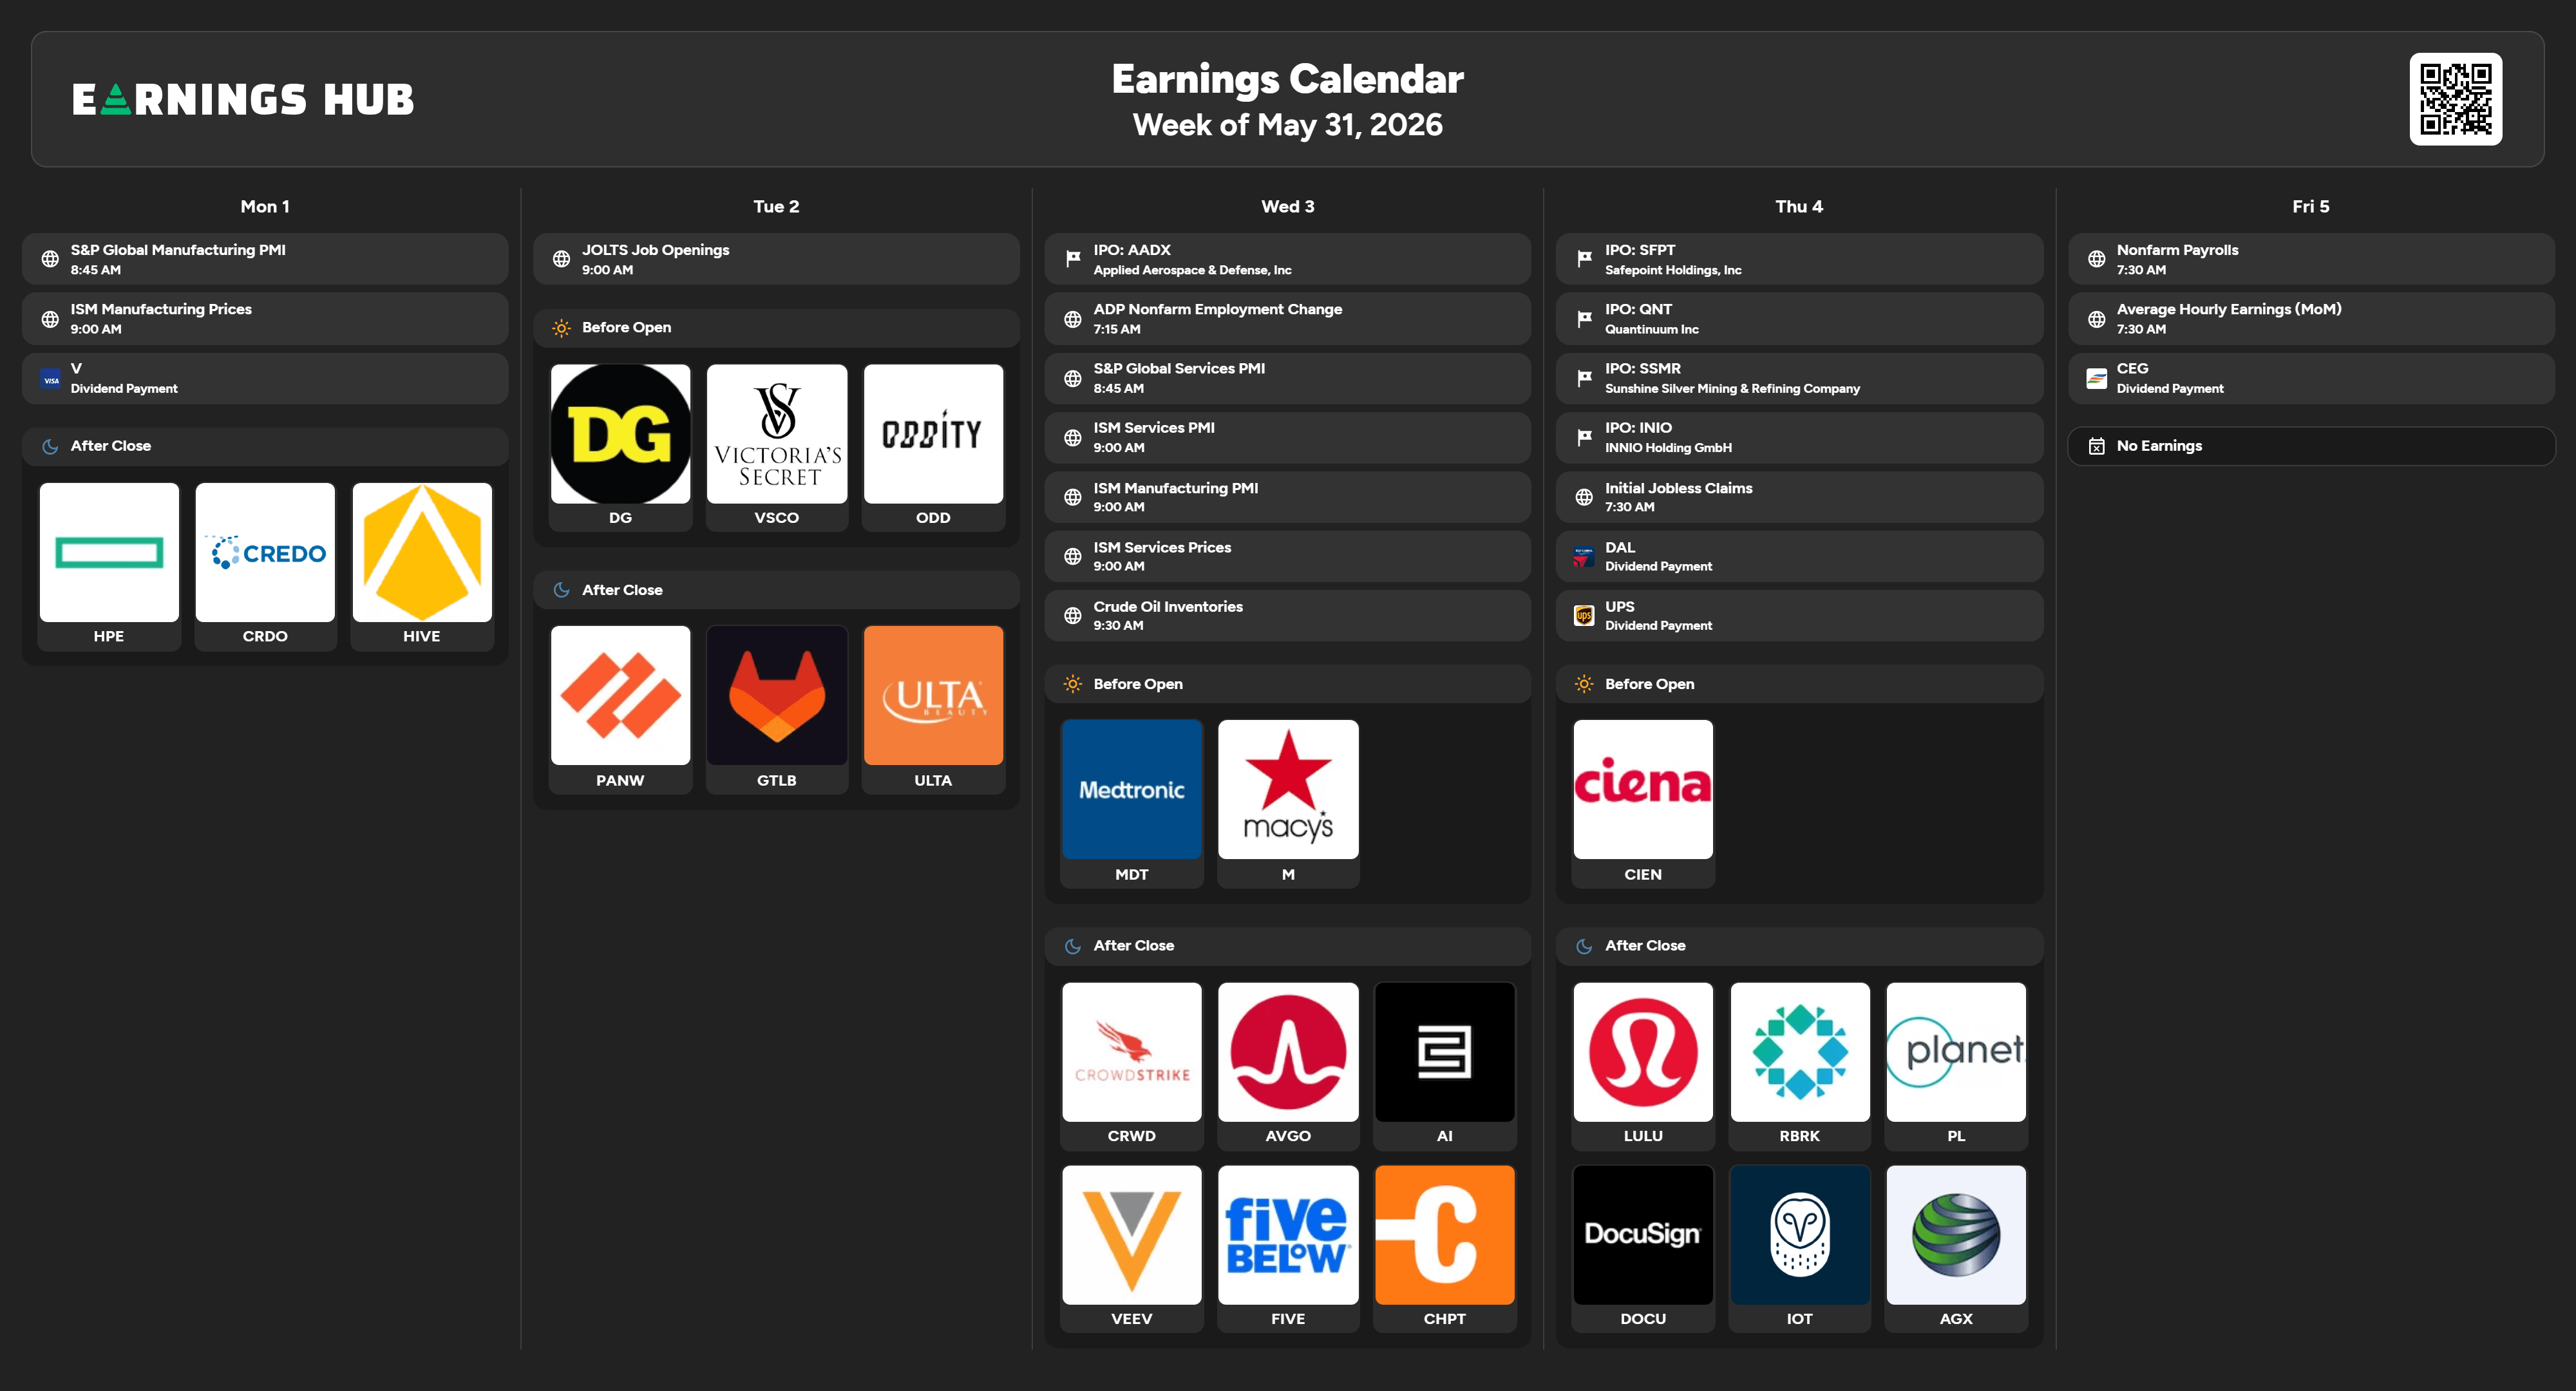
Last week’s earnings were among the heaviest of the quarter. This week is a little less noisy, but there are still a few names worth keeping an eye on.
Monday, June 1 (today): No earnings before the open. After the close: Hewlett Packard Enterprise (HPE), Credo Technology (CRDO), and Hive Digital Technologies (HIVE).
HPE 0.00%↑ This is the enterprise infrastructure print to watch this week. AI server demand has been the story in hardware all year. HPE’s guidance on that segment will either confirm or complicate the Dell and Marvell prints from last week.
Tuesday, June 2: Dollar General (DG), Victoria’s Secret (VSCO), and Oddity Tech (ODD) before the open. After the close: Palo Alto Networks (PANW), GitLab (GTLB), and Ulta Beauty (ULTA).
PANW 0.00%↑ is the cybersecurity print of the week to watch. Ulta is a direct read on discretionary consumer spending at the mid-to-premium tier category.
Wednesday, June 3: Medtronic (MDT) and Macy’s (M) before the open. After the close: CrowdStrike (CRWD), Broadcom (AVGO), C3.ai (AI), Veeva Systems (VEEV), Five Below (FIVE), and ChargePoint (CHPT).
AVGO 0.00%↑ is the most important earnings print of the week. Broadcom’s AI revenue guidance has been one of the cleanest forward indicators of hyperscaler infrastructure spend. CRWD 0.00%↑ reports alongside it in cybersecurity. Wednesday after the close is another live test for the AI trade as we head into the second half of the year.
Thursday, June 4: Ciena (CIEN) before the open. After the close: Lululemon (LULU), Rubrik (RBRK), Planet Labs (PL), DocuSign (DOCU), Iotivity (IOT), and Agile Growth (AGX).
LULU 0.00%↑ is the premium consumer health check to keep an eye on. The stock has been under pressure all year. Thursday’s print is either a stabilization signal or another leg lower for the stock.
Friday, June 5: No earnings. NFP dominates the morning headlines.
MOMENTUM PULSE CHECK
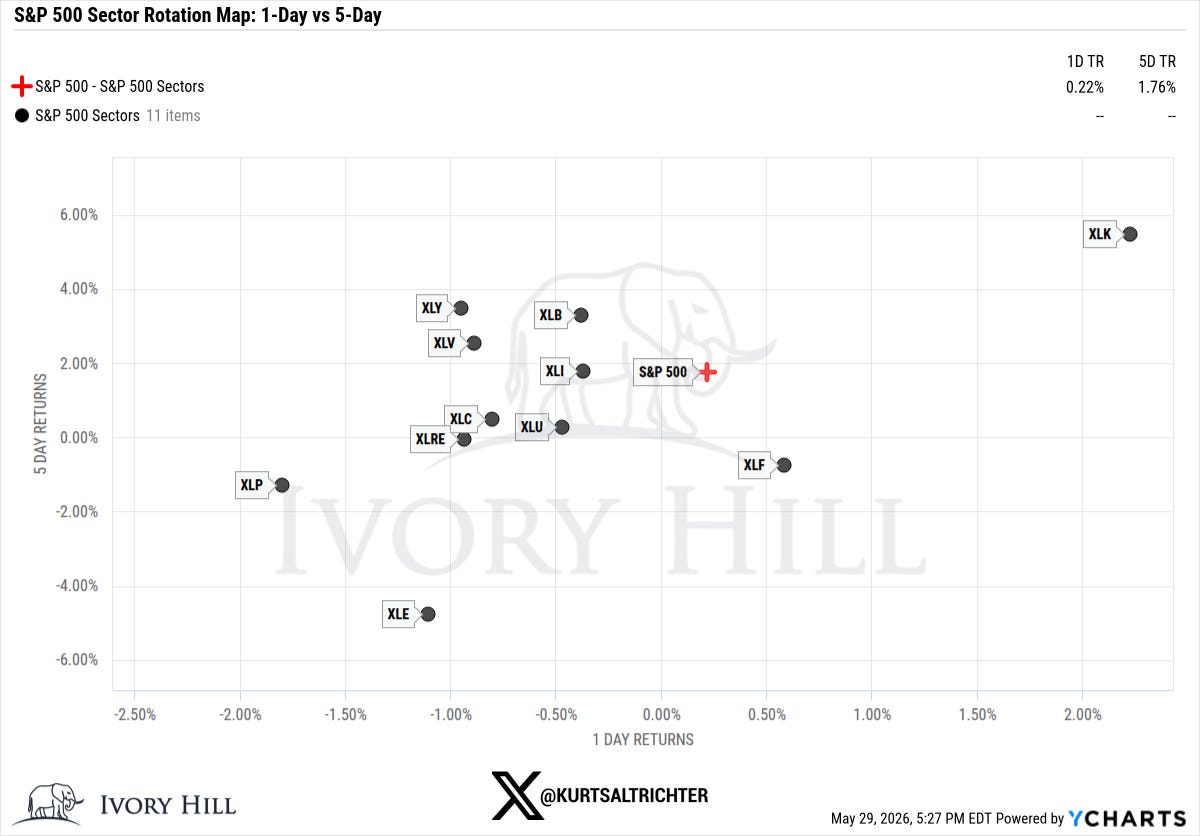
Last week showed Technology (XLK) as the lone sector in the upper-right quadrant, gaining roughly 2.3% over five days. Energy (XLE) was the weakest sector at -4.5%.
The defensive rotation that led last week, with Health Care (XLV) and Utilities (XLU) out front on the five-day, did not repeat. And that’s an important point when you see two defensive sectors outperforming alongside tech, which is typically nothing to worry about. Tech reclaiming leadership at S&P 500 all-time highs is a market that we have been used to over the last few years.
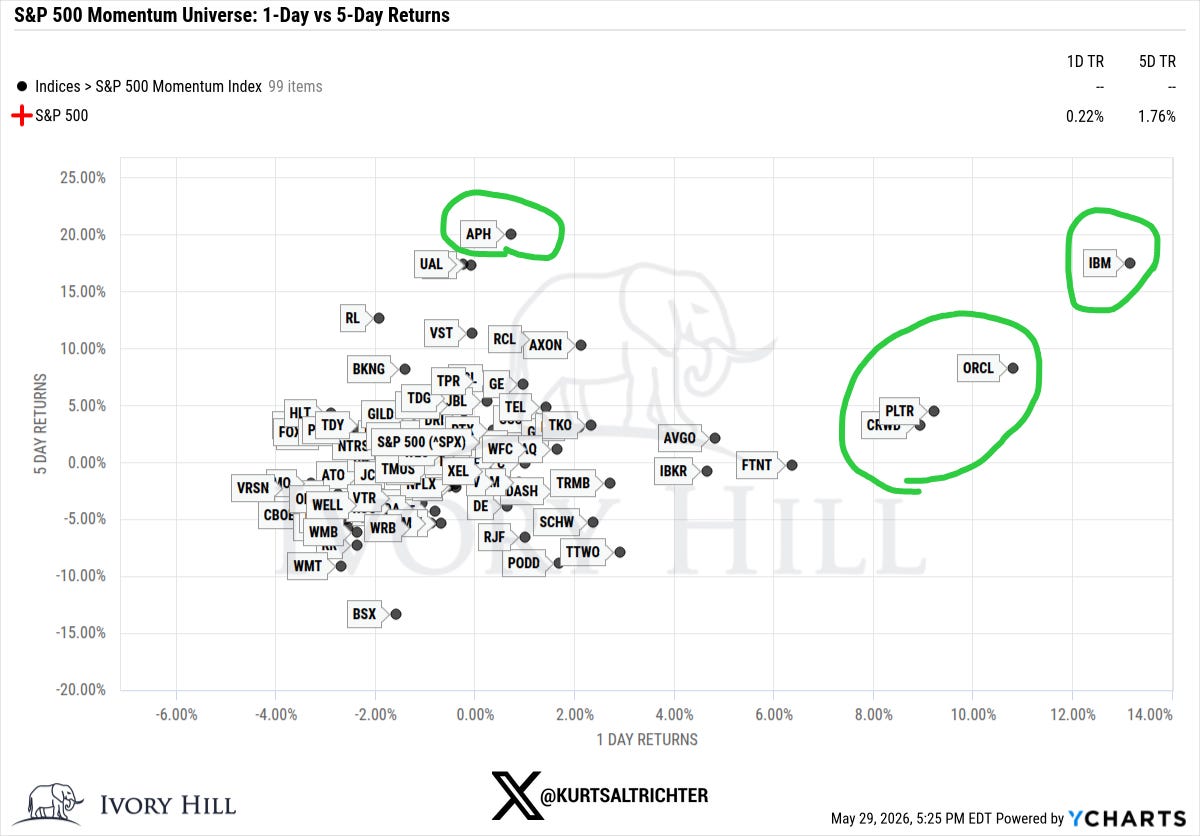
IBM 0.00%↑ was the standout in the 99-name momentum universe. Roughly +14% on Friday and approximately +17% over five days. Oracle (ORCL) gained 9% on Friday. Palantir (PLTR) and CrowdStrike (CRWD) were both positive on the day and the week. Amphenol (APH) led the five-day window, up 20%.
At the bottom: Boston Scientific (BSX) lost 15% over five days. Walmart (WMT) dropped10%. Take-Two Interactive (TTWO) gave back roughly 8%.
Last week’s report showed VST leading the five-day at roughly +12%, with IBM and RL near +15%. This week, IBM held the top of the universe on both axes, while the consumer and defensive names that struggled two weeks ago continued lower.
MARKET STRUCTURE: THE ANCHOR POINT
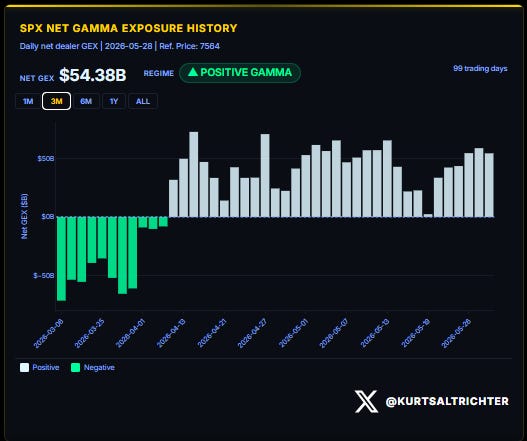
SPX closed Friday at 7,580. The gamma flip is at 7,458. Dealers are operating 122 points above the flip in positive gamma territory with net GEX at $54.38 billion.
Dealers long gamma buy weakness and sell strength. That mechanical behavior smoothed out the intraday volatility throughout the week, even as Thursday front-loaded GDP, Core PCE, and a full cluster of secondary data, all simultaneously with the heaviest earnings night of the quarter.
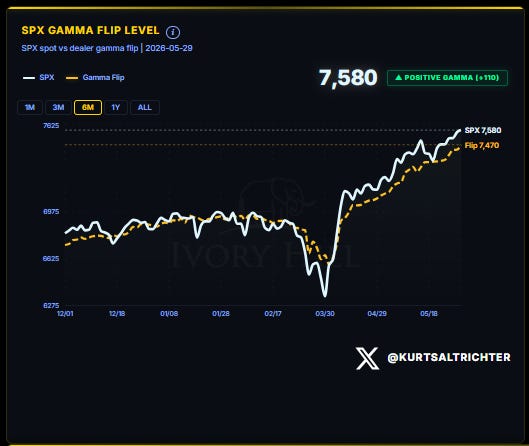
The flip line has held consistently positive since April 13. The regime shift from negative to positive gamma on April 13 is the structural anchor for the entire rally. Since that date, the S&P 500 has moved from approximately 6,275 to 7,580, roughly 20.8%.
This week’s expected move has an upside of 7,676 (+1.26%). Downside to 7,484 (-1.27%). A close below 7,458 flips the regime. Friday’s NFP print could be the live test.
VOLATILITY REGIME
1-month RV printed 10.17 as of Friday’s close. 3-month RV is 14.44. Regime tag: LOW-VOL.
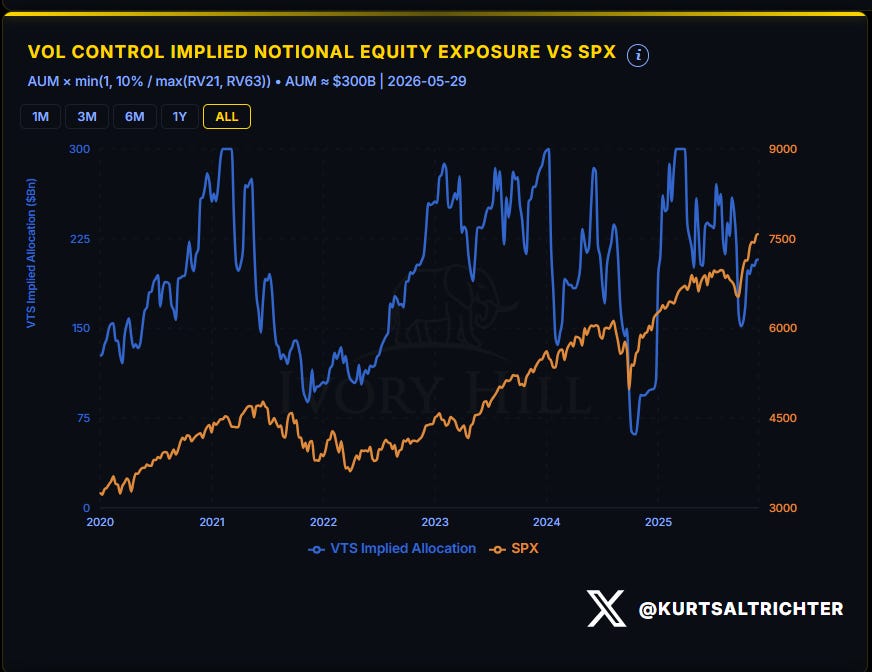
The spread between 1-month and 3-month RV remains inverted in the bullish direction. DOWN. The 4.27-point gap reflects the April drawdown still sitting inside the 3-month lookback period. As those sessions roll off over the next six to eight weeks, the 3-month RV will mechanically drift toward the 1-month, assuming vol stays anchored near current levels. That drift increases vol-control fund equity allocations systematically over time.
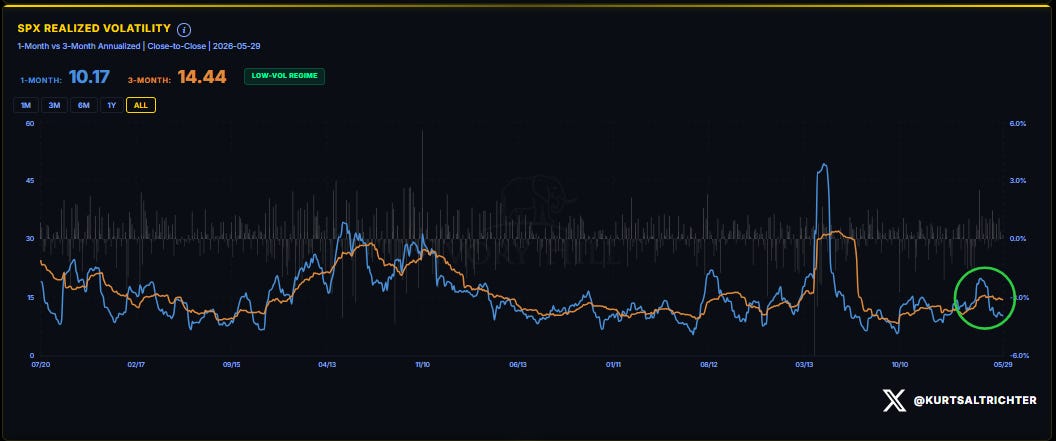
Bottom line: Low volatility forces vol-control funds to mechanically buy stocks. Their algos do not care about sentiment. At 10.17 on the 1-month, the signal is still long.
SYSTEMATIC FUND FLOWS
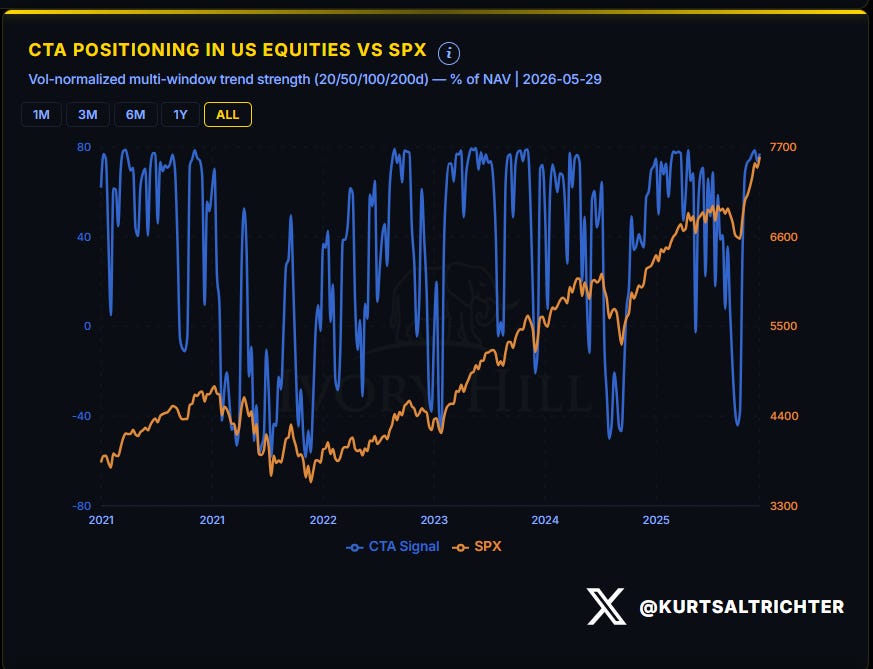
Last week I flagged CTAs as net sellers on four consecutive days with an absolute z-score near 0.95 and trending lower, calling it “a warning, not yet a reversal.” That reversal came. CTAs posted net buying of +0.098 on the z-score over the five-day window. The absolute level reached 1.054. Status: Bullish at +10.3%, in uptrend.
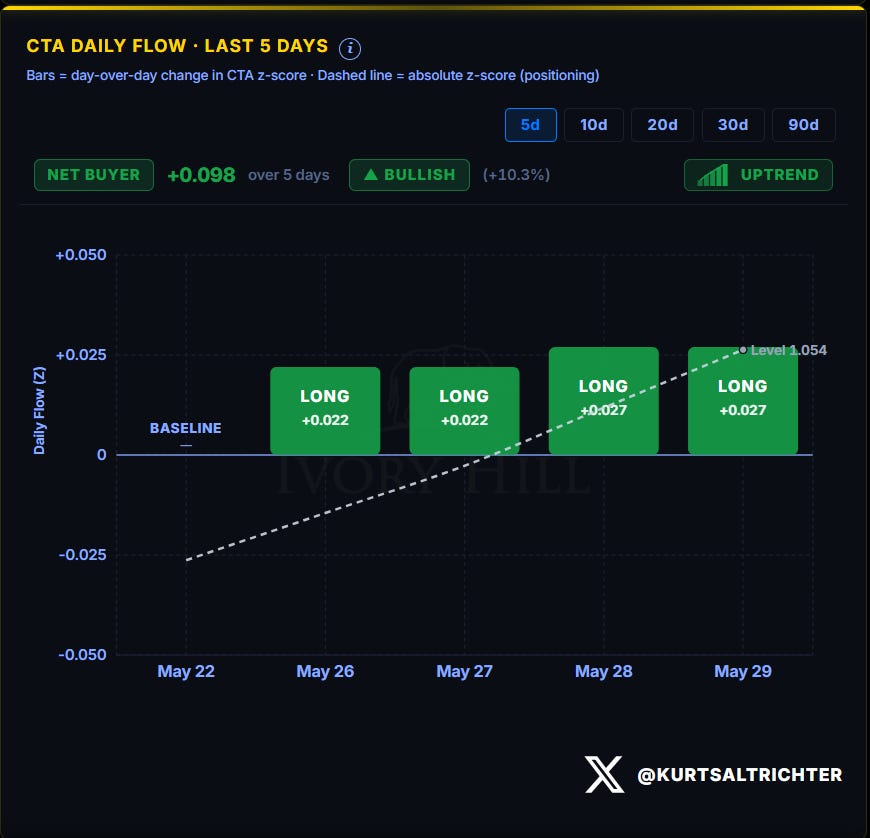
The Thursday macro cluster resolved without a vol spike. No vol spike means no systematic selling trigger. CTAs rotated from deceleration back into active buying once the trend signal held.
Vol-control funds posted net buying of $1.9 billion over the five-day window. The absolute allocation level stands at $206.4 billion. Status reads Neutral at +0.9%.
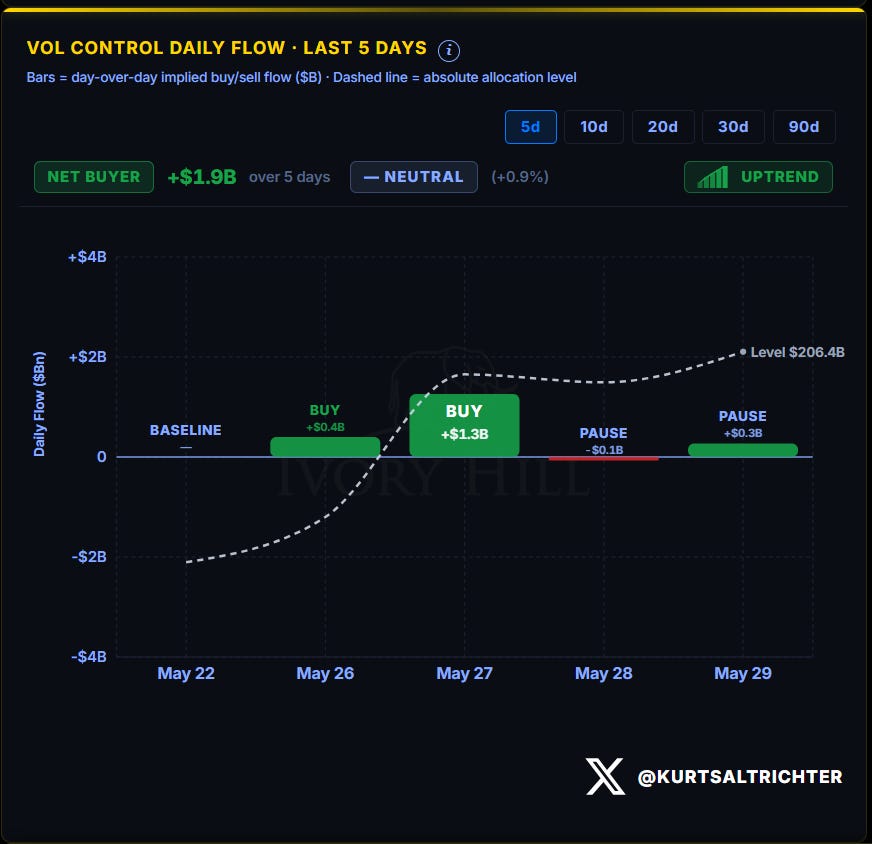
Last week, I described vol-control flow as unstable, with oscillation over three weeks, and the question of whether PCE would trigger mechanical selling. It did not. The trend flipped from flat to rising. That is the direct driver of the Flow Signal upgrade from Neutral to Bullish this week.
SYSTEMATIC POSITIONING INDEX
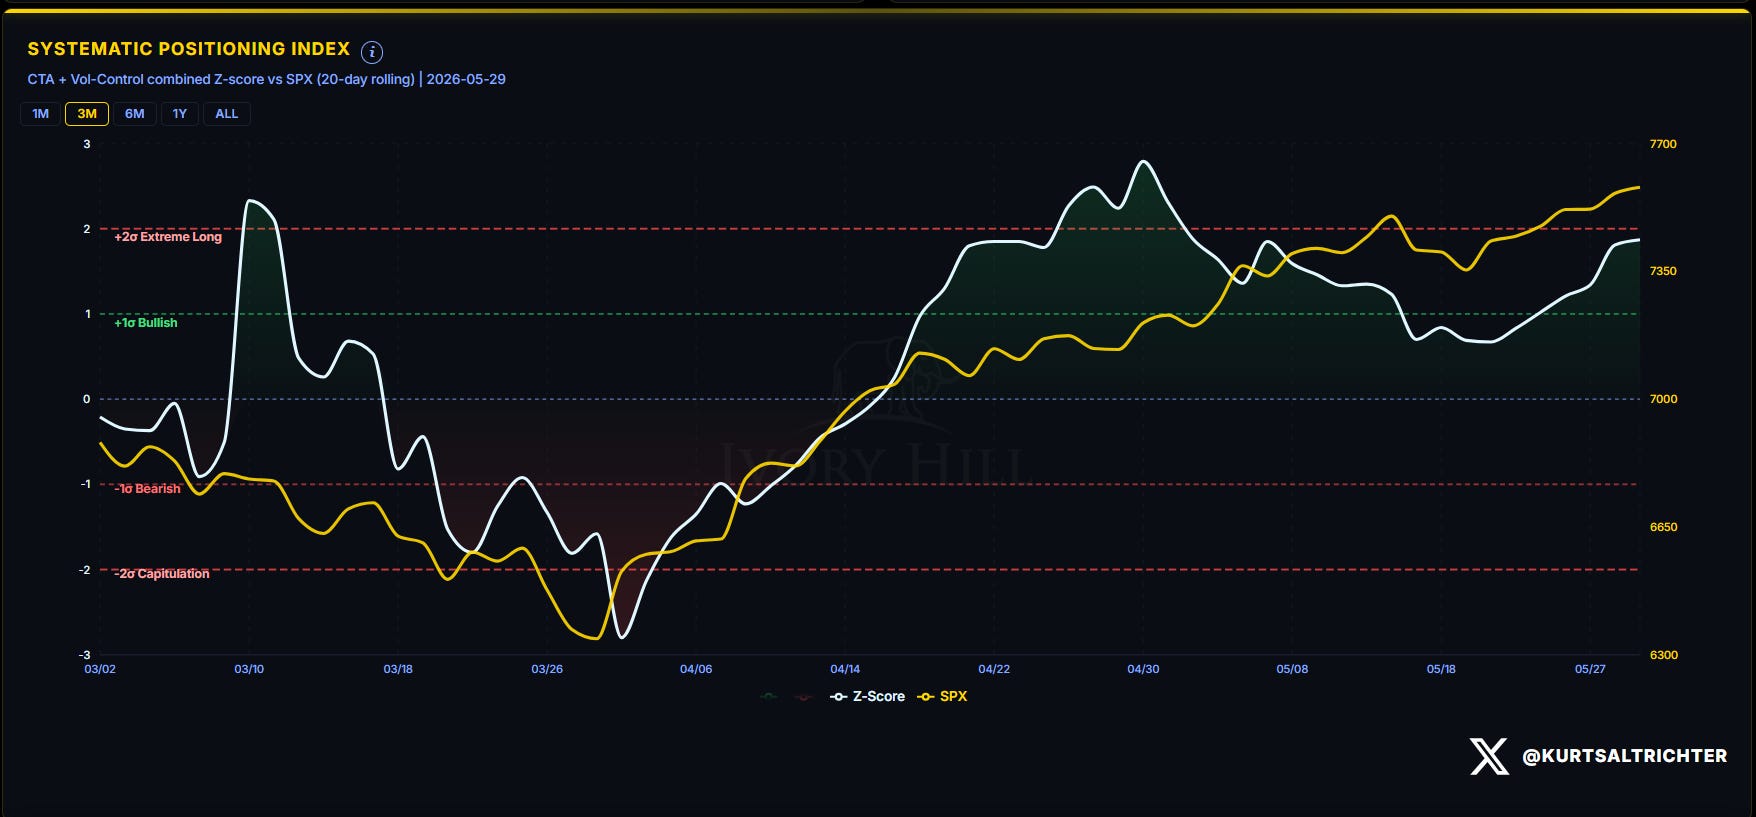
The combined CTA plus vol-control z-score is in the bullish zone between +1σ and +2σ on the 20-day rolling window. The z-score has recovered from the lower boundary of that band where it sat last week and is pushing back toward the upper boundary.
Last week, I warned that the next move lower on the z-score would cross into neutral territory and change the flow signal from tailwind to neutral. That did not happen. The z-score reversed. The regime remains Bullish on systematic flows with renewed momentum behind it.
MARKET BREADTH
58.3% of S&P 500 members are trading above their 200-day moving average as of Friday’s close. Signal: Neutral. Last week it was also 58.3%.
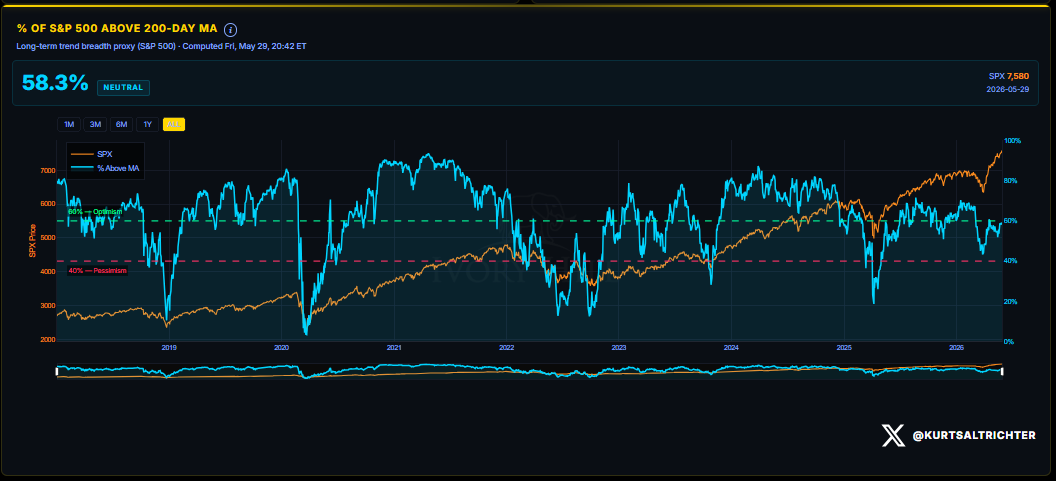
Last week, I noted the 6.6 percentage-point improvement in a single week and said, “At 60%, the breadth signal is Bullish. The rally could be getting wider.” The S&P 500 gained 1.43% this week, and breadth did not move. The index is making new highs on more concentrated leadership. I think this will become more of a theme in the 2nd half of 2026 than what we’ve seen in the 1st half.
DEALER GAMMA DASHBOARD AND COMPOSITE REGIME
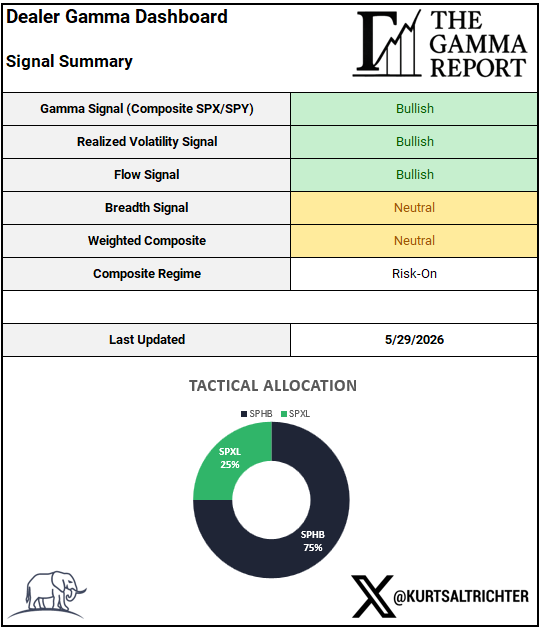
Three Bullish, one Neutral. The composite reads Risk-On. The Flow Signal upgraded from Neutral to Bullish as vol-control flipped from flat to rising. This report carries three Bullish and one Neutral signal. The model’s conviction increased without a change in allocation.
The regime shifts if any of these conditions develop: breadth breaks back below 40%, 1-month RV crosses above the 3-month on a sustained basis, SPX closes below the gamma flip at 7,458, or CTA and vol-control flows both flip to net selling simultaneously. None are present as of Friday’s close.
TACTICAL ALLOCATION PERFORMANCE
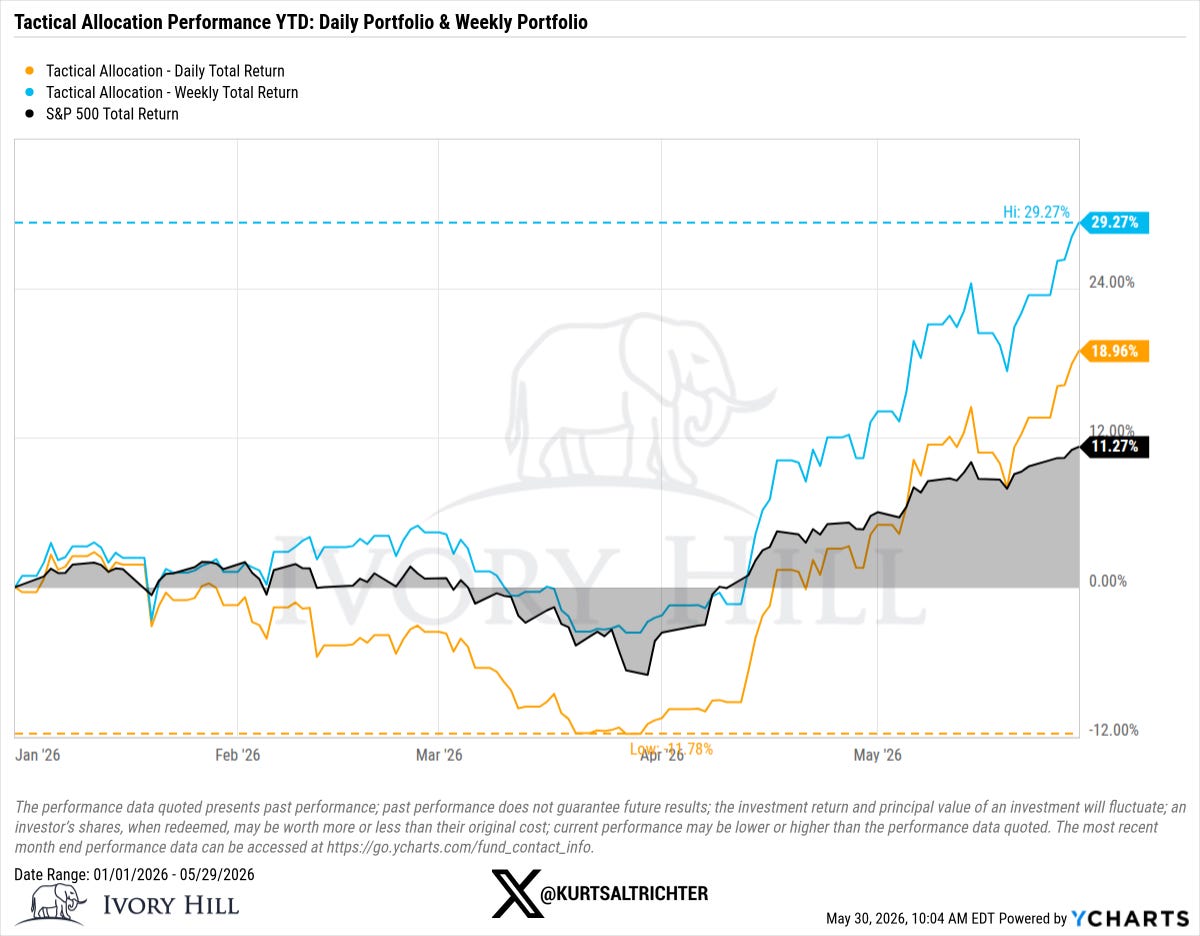
The weekly portfolio set a new all-time high at 29.27% YTD, clearing the prior high of 24.38% set in last week’s report. The daily portfolio sits at +18.96% YTD, up from +13.61% last week. The S&P 500 Total Return sits at +11.27%, up from +9.69%.
This model is fully invested in equities at all times. It does not hold cash or bonds. A comparison to the S&P 500 Total Return is informative but incomplete. The model’s purpose is to navigate equity beta, not to outperform via asset-class diversification. The outperformance in this regime reflects structural positioning in higher-beta equities during a sustained positive gamma, low-vol, Risk-On environment.
Current allocation: SPHB 75% / SPXL 25%. No change.
The regime conditions support staying positioned through this week’s macro prints. Friday’s NFP is the primary variable. If payrolls clear the 85K estimate and breadth responds by pushing through 60%, the next report will face an upgraded composite.
And remember - The one fact pertaining to all conditions is that they will change.
Feel free to use me as a sounding board.
Follow me on X for more updates.
Best regards,
Schedule a call with me by clicking HERE
Kurt S. Altrichter, CRPS®
Wealth Advisor | President
Disclosure
The Gamma Report is published by Ivory Hill, LLC. All opinions and views expressed in this report reflect our analysis as of the date of publication and are subject to change without notice. The information contained herein is for informational and educational purposes only and should not be considered specific investment advice or a recommendation to buy or sell any security.
The data, models, and tactical allocations discussed in this report are designed to illustrate market structure and positioning trends and may differ from portfolio decisions made by Ivory Hill, LLC or its affiliates. Investing involves risk, including the possible loss of principal. Past performance is not indicative of future results.
Ivory Hill, LLC, and its members, officers, directors, and employees expressly disclaim any and all liability for actions taken based on the information contained in this report.