

Week two of Neutral. The market spent all of last week trying to claw its way back to Risk-On, only to stop one point short of reclaiming positive gamma.
The S&P 500 closed Friday at 7,431. The gamma flip sits at 7,432. One point. After five sessions of fighting back from Wednesday’s low, the index is pinned to the exact line that defines the regime, and it closed on the wrong side of it.
Last week, I told you the realized vol signal was the next domino and that it was one bad session away from flipping. It flipped. One-month realized vol crossed above three-month on Friday.
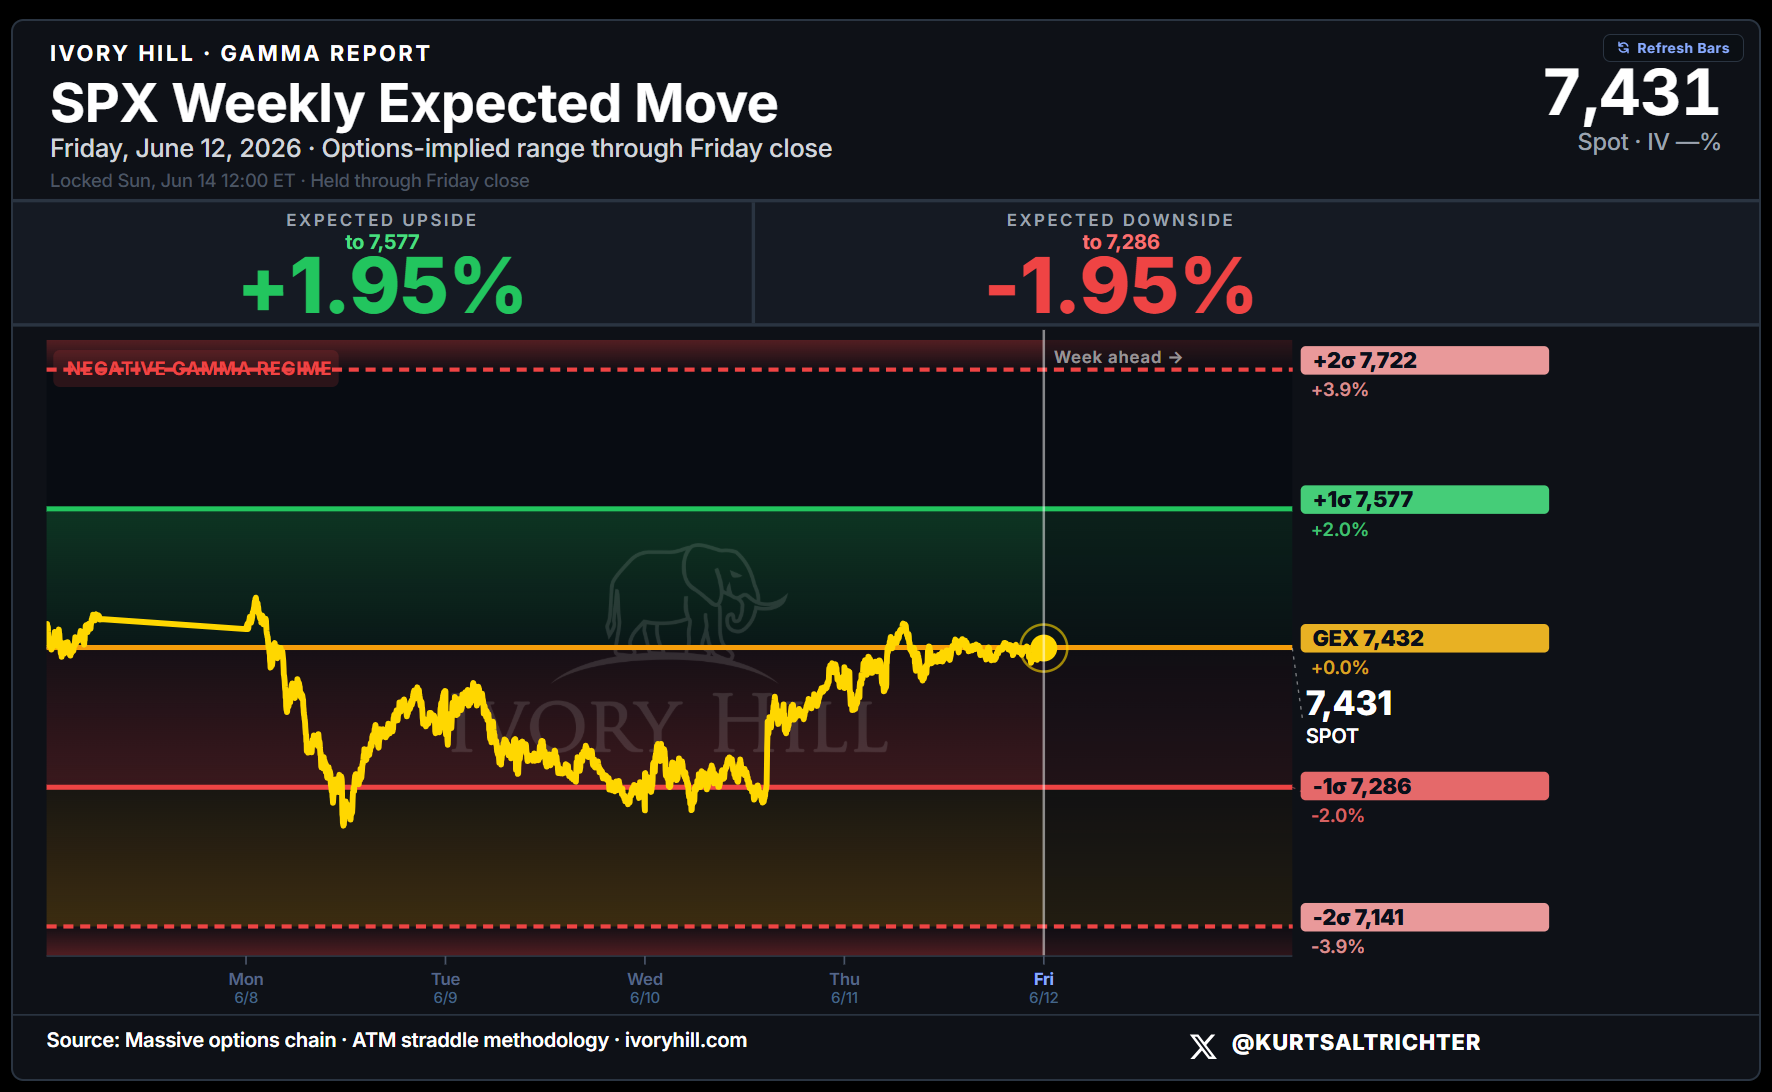
CPI was the test I flagged for Wednesday. The market sold the print straight down to 7,267, the week's low, then bought it all the way back to the flip by Friday. Pay attention to the expected move levels, as they have been pretty spot-on over the past month or two.

Friday was green across the board. The S&P 500 added 0.50%, the Dow 0.70%, the Russell 2000 0.79%. Gold was the standout single day at +3.63%. WTI fell 3.23% but still leads the year at +47.82% YTD. Bitcoin lost another 0.29% and is down 26.60% YTD, the worst major on the board.
The S&P 500 is down 1.96% in June, the Nasdaq down 4.02%, the worst of the complex. The Russell 2000 is positive on the month at +0.84%. Small caps sat out the drawdown, and that shows up again in breadth.
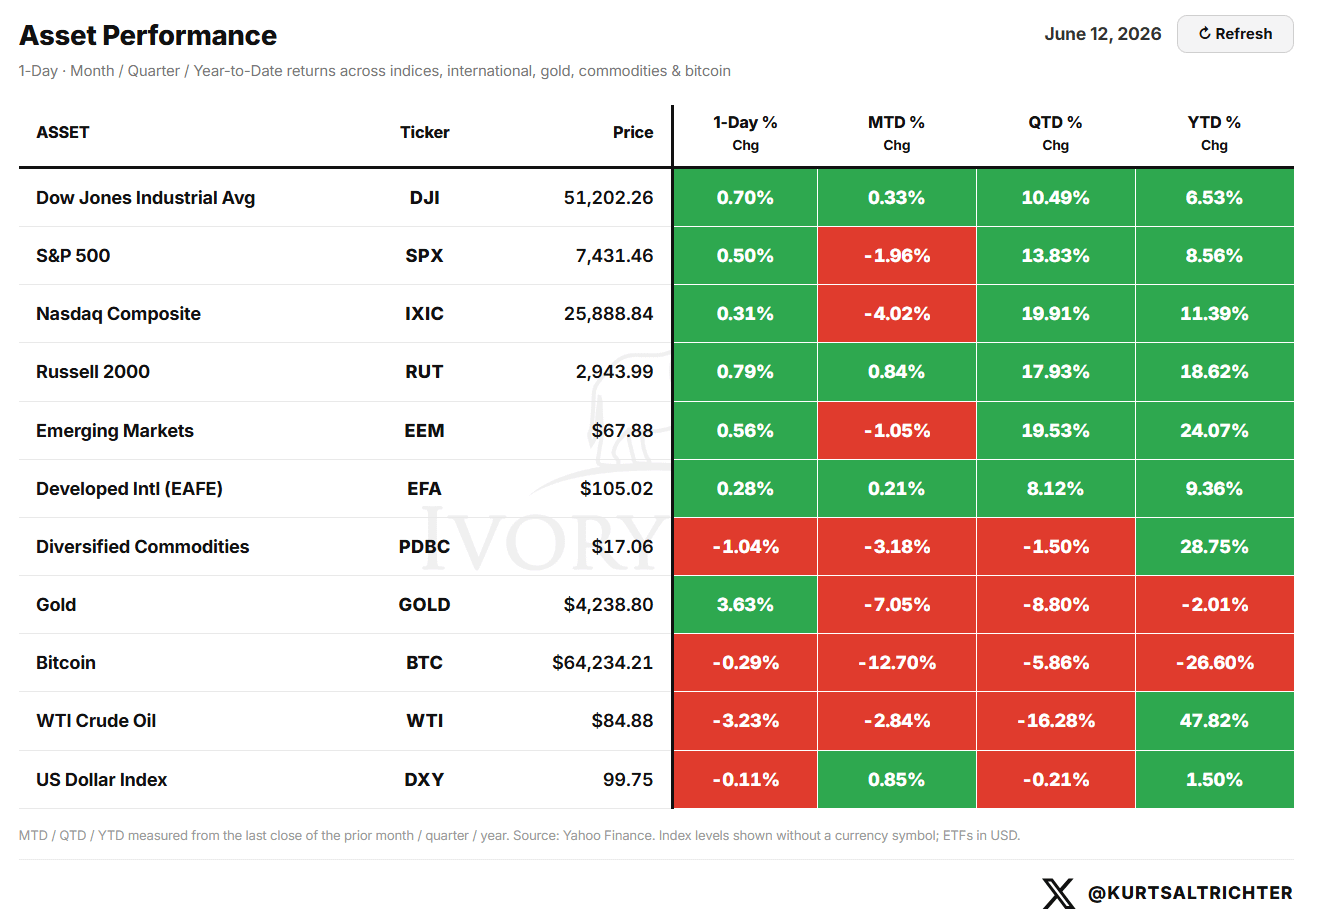
The S&P 500 is down 1.96% in June. The Nasdaq is down 4.02%, the worst performer in the index complex, as tech took the brunt of the early-June selloff. The Russell 2000 is positive on the month at +0.84%. Small caps did not participate in the drawdown the way mega-cap tech did, and that shows up again in breadth later.
IMPLIED CORRELATION: THE DISPERSION SIGNAL
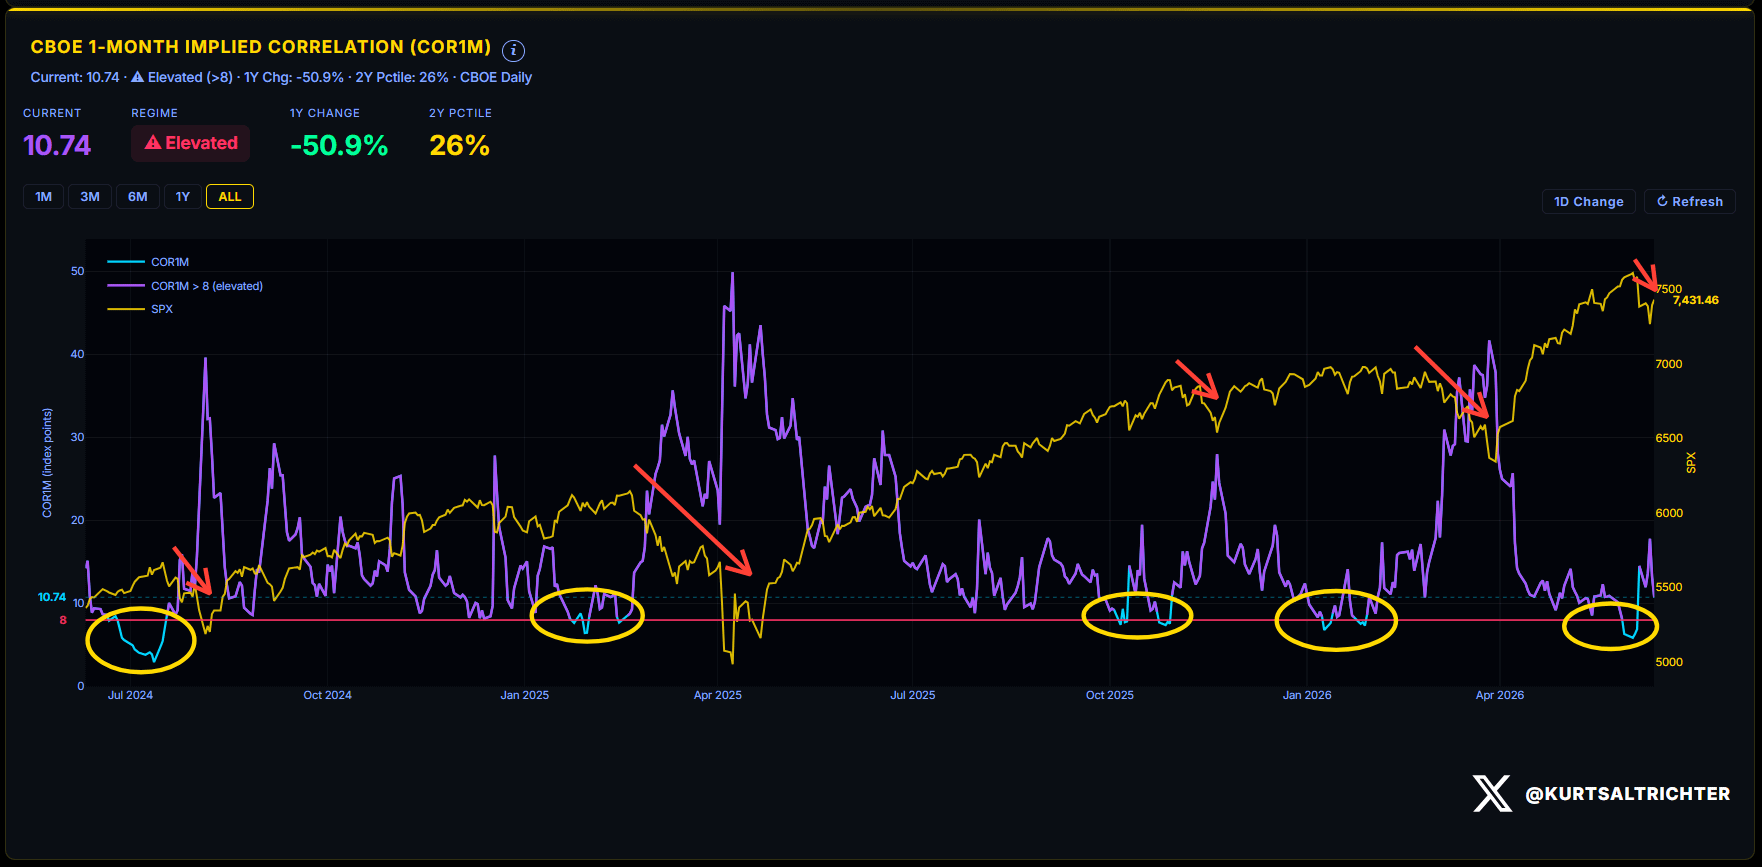
One week ago, this chart was 14.52, having doubled off the floor into the NFP selloff. It has come back in. Correlation spiked when the macro override hit and has since receded as the market recovered, but it has not broken back below 8. We are still above the line.
The single-trade intensity that defined NFP Friday has eased. Stocks are starting to separate again, which is what let the index round-trip back to the flip while individual names sorted into winners and losers underneath.
Until COR1M closes back under 8, the tape remains dominant, and the FOMC on Wednesday is exactly the kind of event that can pin correlation right back to the highs in a single session.
THE ECONOMIC EVENT CALENDAR AND VOL TERM STRUCTURE
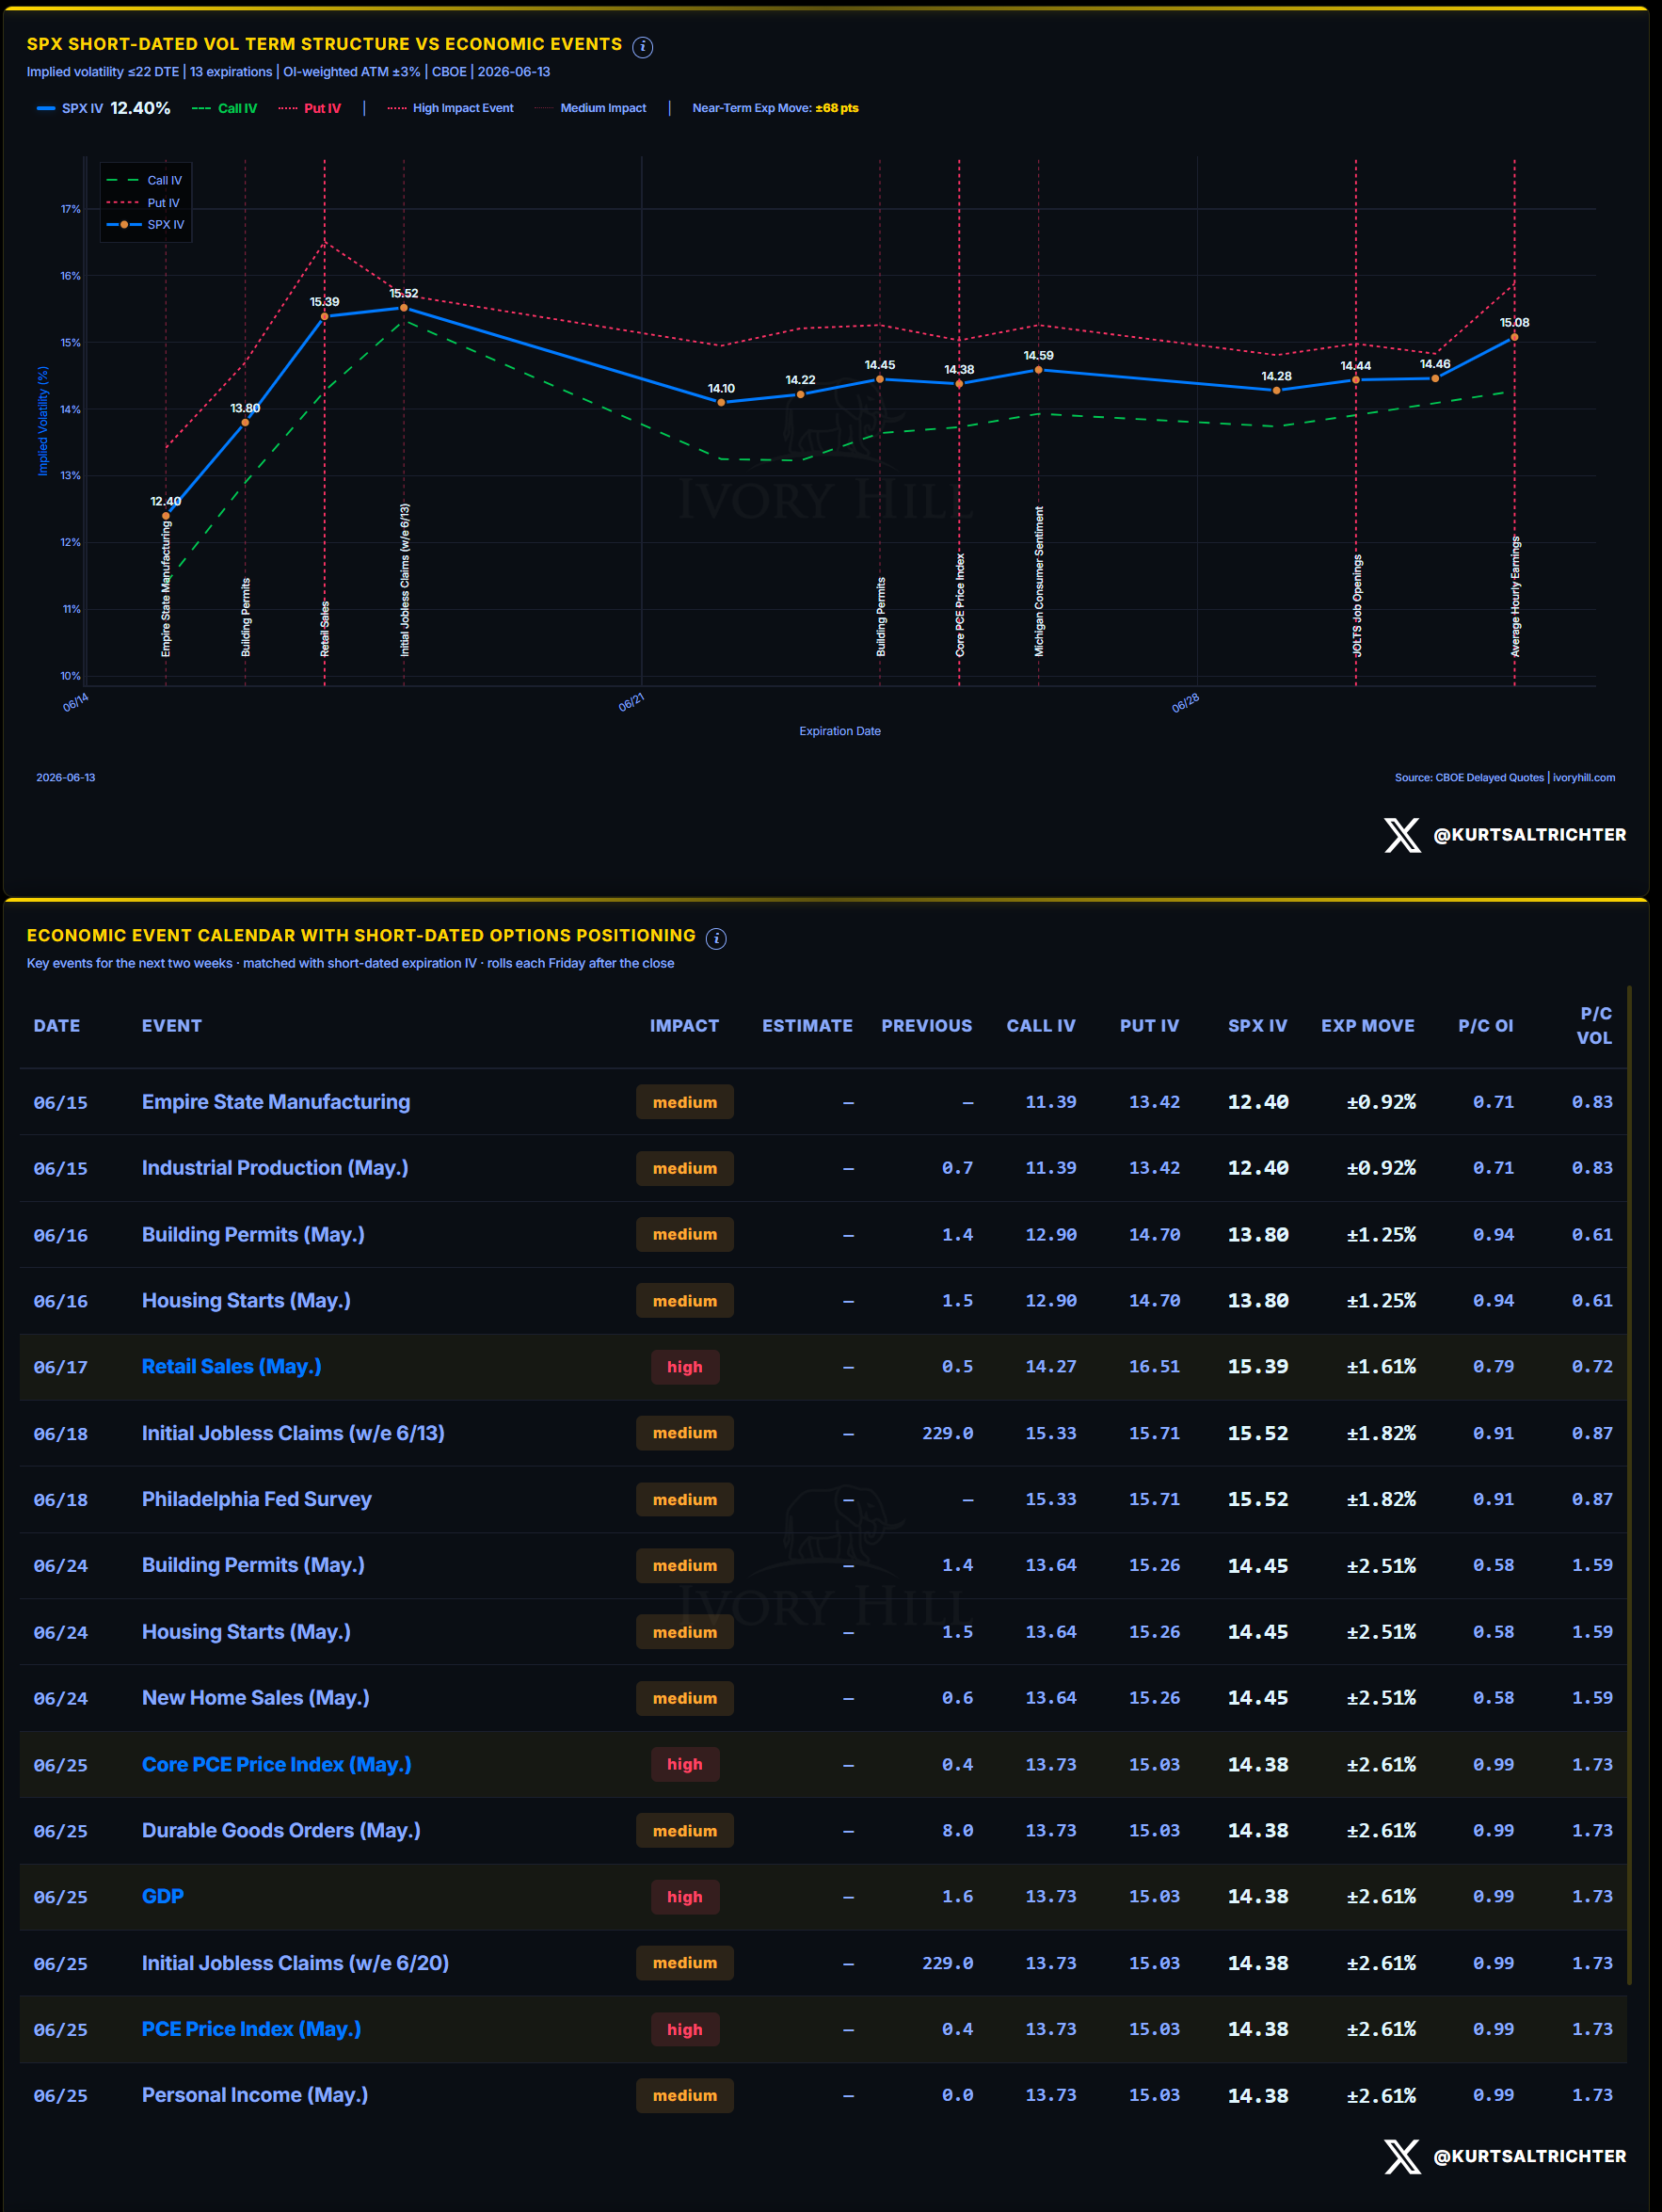
The vol that NFP injected has bled out. The near-term expected move is ±68 points. The early part of the week is priced pretty soft, then the curve ramps up in the middle of it.
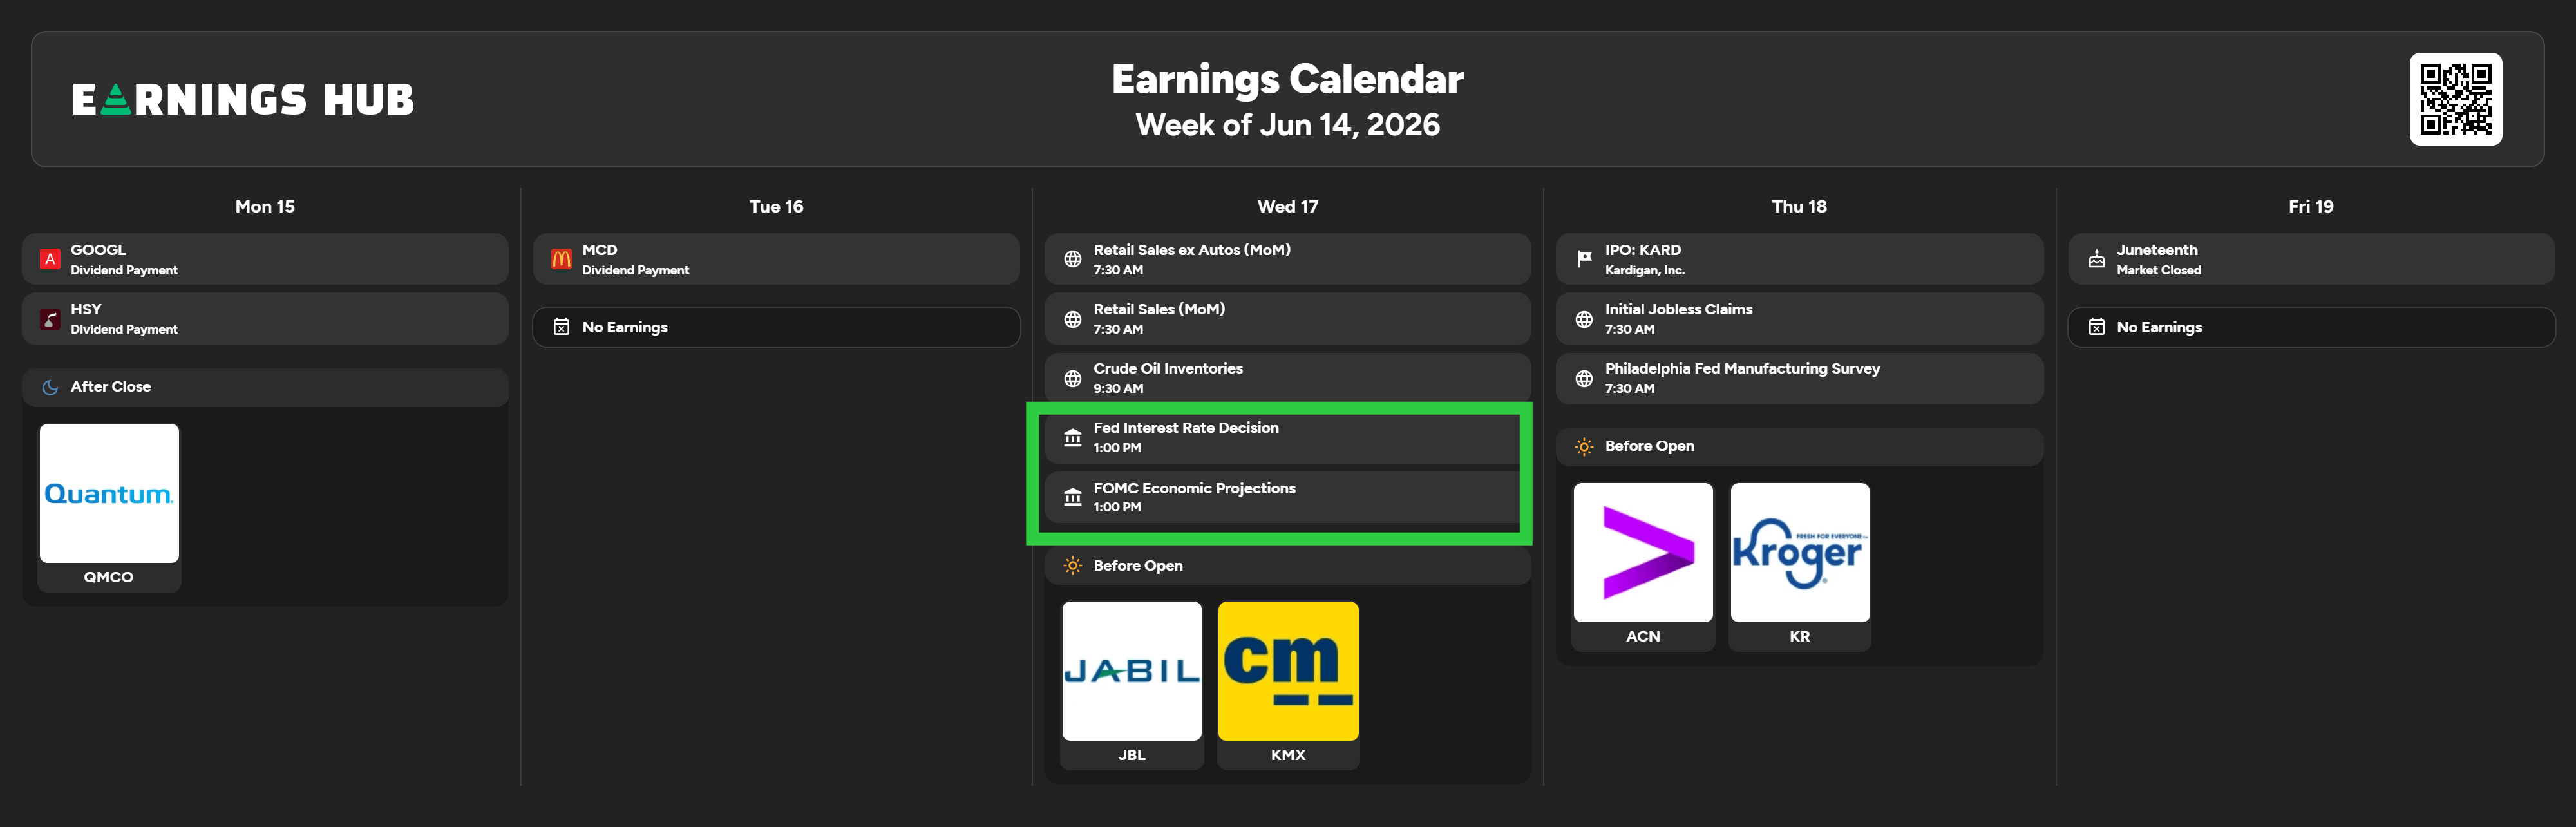
This is a four-day week. Friday, June 19, is Juneteenth, and the market is closed.
Monday, June 15: Empire State Manufacturing and Industrial Production for May, both medium impact. SPX IV at this expiration is 12.40, implying ±0.92%.
Tuesday, June 16: Building Permits and Housing Starts for May, both medium impact. SPX IV is 13.80, implying ±1.25%.
Wednesday, June 17: Retail Sales for May will print at 7:30 AM, high impact, estimated +0.5%, with SPX IV at 15.39 and a ±1.61% expected move. Then the FOMC rate decision and the updated economic projections both land at 1:00 PM. The market gets a read on the consumer in the morning and the Fed’s full dot plot in the afternoon, in negative gamma, sitting on the flip. Whichever way it breaks, dealers amplify it.
Thursday, June 18: Initial Jobless Claims for the week ending 6/13, estimated 229K against a prior of 229K, plus the Philadelphia Fed Survey. SPX IV is 15.52, the peak of the near-term curve, implying ±1.82%. The curve tops out the day after the Fed and the day before the long weekend.
The heavier vol cluster sits two weeks out on June 25, when Core PCE, GDP, and the PCE Price Index all print high-impact in the same session, carrying a ±2.61% cumulative move and a put/call volume ratio of 1.73. That is hedging demand building into month-end. I think we are going to see a short-term top in inflation, and I expect the headline CPI print on July 14th will show a deceleration below 4%. The week in front of us is a Fed week, and the term structure puts the reaction window Wednesday afternoon into Thursday.
EARNINGS
Pretty boring week for earnings.
Monday, June 15: Quantum (QMCO) after the close.
Wednesday, June 17: Jabil JBL 0.00%↑ and CarMax KMX 0.00%↑ before the open. KMX is the one to watch. It reports into Retail Sales the same morning and gives a direct read on big-ticket consumer demand right before the Fed decision. If the consumer is cracking, CarMax and the retail number will say it in the same four hours.
Thursday, June 18: Accenture ACN 0.00%↑ and Kroger KR 0.00%↑ before the open, with the Kardigan (KARD) IPO pricing. ACN is the cleanest read of the week on enterprise IT and consulting demand. In a macro tape, a guidance cut there does not stay contained to Accenture.
MOMENTUM PULSE CHECK
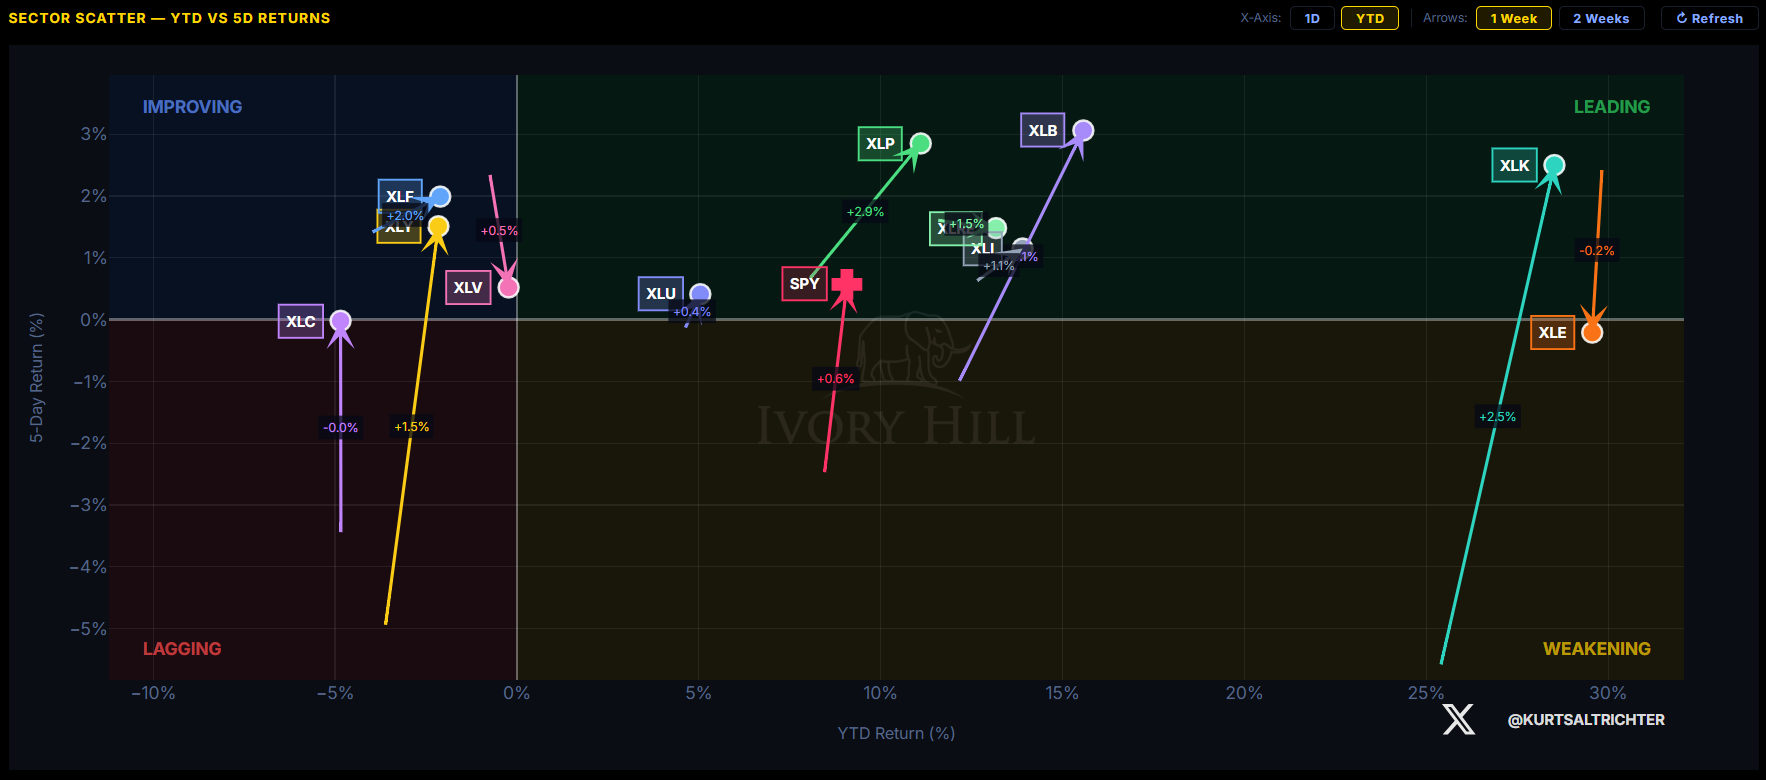
Technology XLK 0.00%↑ ran the full round-trip in reverse. One week ago, it was the single worst sector on the board, sitting alone in the bottom-left corner after a 6.7% single-day drop. This week, it is back in the Leading quadrant, up 2.5% over five days at the top of the YTD range near 28%. The sector that led the decline led the recovery.
It did not do it alone. Consumer Staples XLP 0.00%↑ gained 2.9% and Materials XLB 0.00%↑ 3.0% over five days, both Leading. Financials XLF 0.00%↑ rose 2.0% and moved into Improving. The only laggards were Communications XLC 0.00%↑ at roughly flat and Energy XLE 0.00%↑ , the year’s top sector near 30% YTD, which stalled at -0.2% on the week. SPY finished up 0.6% over the five sessions. Both offense and defense participated in the bounce.
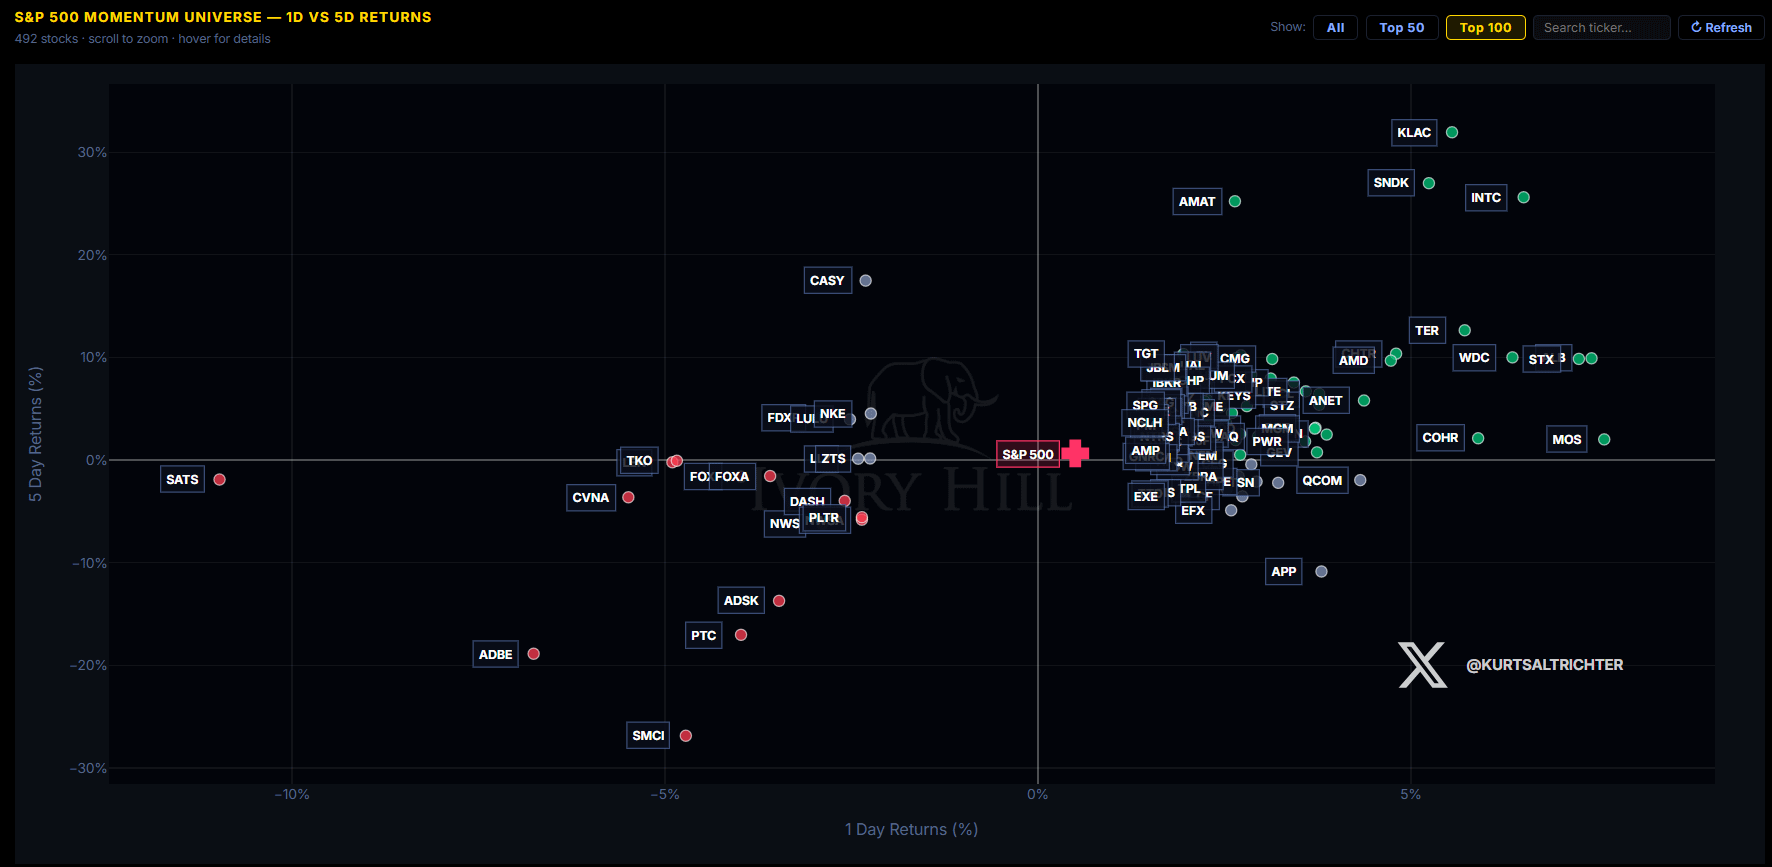
The semiconductors took back the leaderboard they surrendered last week. KLAC 0.00%↑ ran +30% over five days, Applied Materials +25%, Intel +24%, SanDisk +26%. Teradyne, Western Digital, Seagate, and AMD 0.00%↑ all posted high single to low double-digit five-day gains. The names that printed the worst returns into Friday’s prior selloff printed the best returns out of it.
The break last week was in software. SMCI 0.00%↑ was the single worst name at roughly -27% over five days. Adobe fell about 19% after reporting on Thursday. PTC 0.00%↑ dropped 17% and Autodesk 15%. The money rotated out of software and back into hardware. Two weeks ago, it ran from semis to soap. This week, it ran from software back to silicon. The leadership is volatile and rotating quickly, which is what a high-correlation tape does to a concentrated index.
MARKET STRUCTURE: THE ANCHOR POINT
SPX closed Friday at 7,431. The gamma flip sits at 7,432. The market is operating one point below the line in negative gamma. One point.
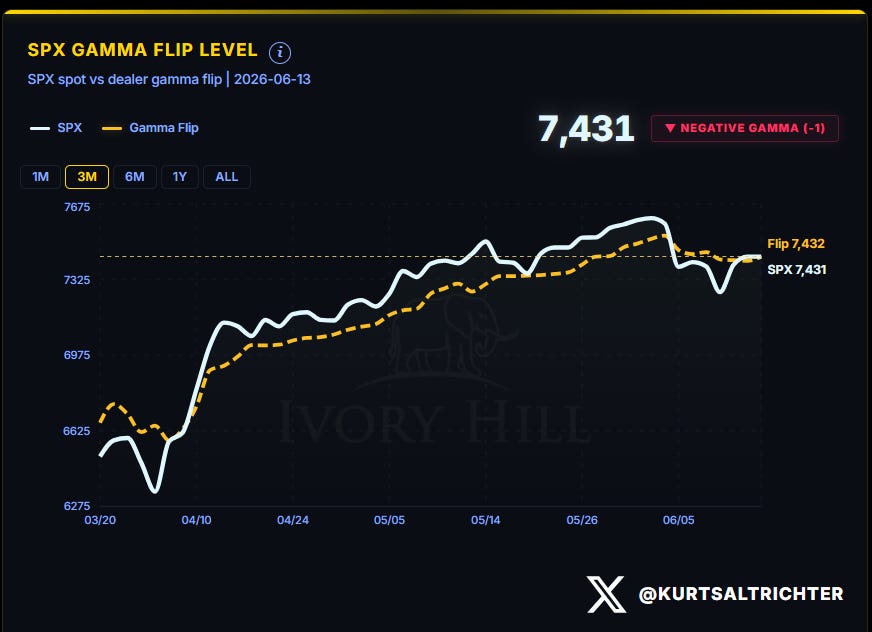
For 8 weeks, this line was support, dealers long gamma, buying weakness, and selling strength, and the index rode it from 6,275 to 7,580. In the last report, the line broke and became resistant. Last week, the market climbed all the way back to it, poked above it intraday Friday, and closed right underneath.
Until the S&P 500 closes back above 7,432 and holds it, dealers are short gamma, and every move gets amplified. Wednesday’s drop to 7,267 and the two-day rip back to the flip are both that mechanic at work. The market did not calm down last week. It moved hard in both directions and netted out at the line, as expected in a negative-gamma environment.
WEEKLY EXPECTED MOVE
This week’s expected move runs from an upside of 7,577 (+1.96%) to a downside of 7,286 (-1.95%), with a 2-sigma floor at 7,141. The bands widened from last week as more uncertainty entered the market.
VOLATILITY REGIME
Wednesday’s CPI drop helped push 1-month above 3-month. The inversion that protected the tape for the entire 8-week run is gone, and the realized vol signal downgraded from Bullish to Neutral on Friday.
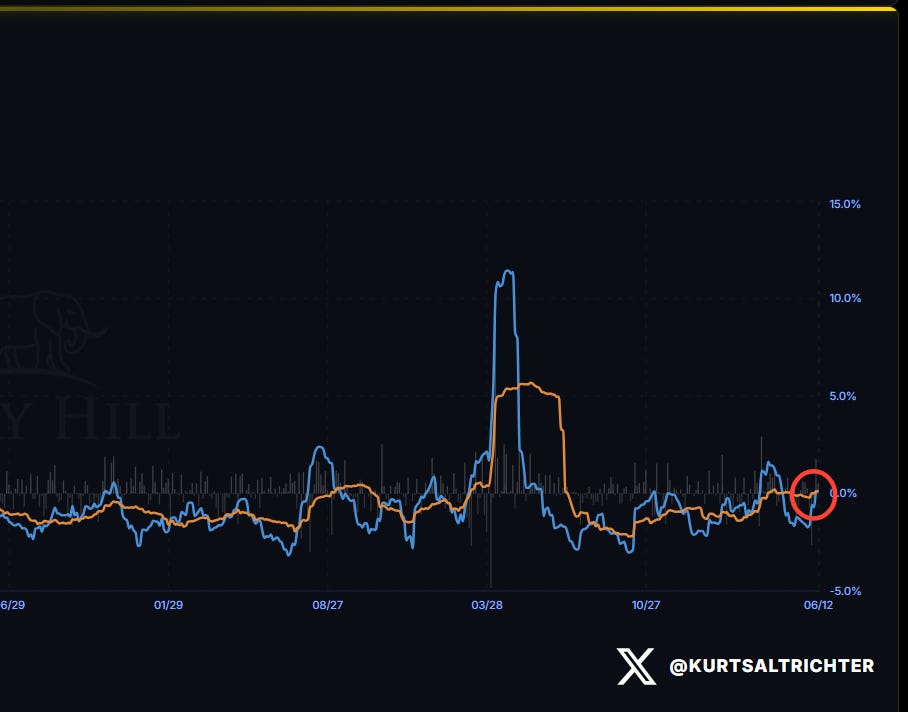
The cross is one day old, and the spread is four hundredths of a point, so this is the threshold, not a blowout, which is a good sign.
SYSTEMATIC FUND FLOWS
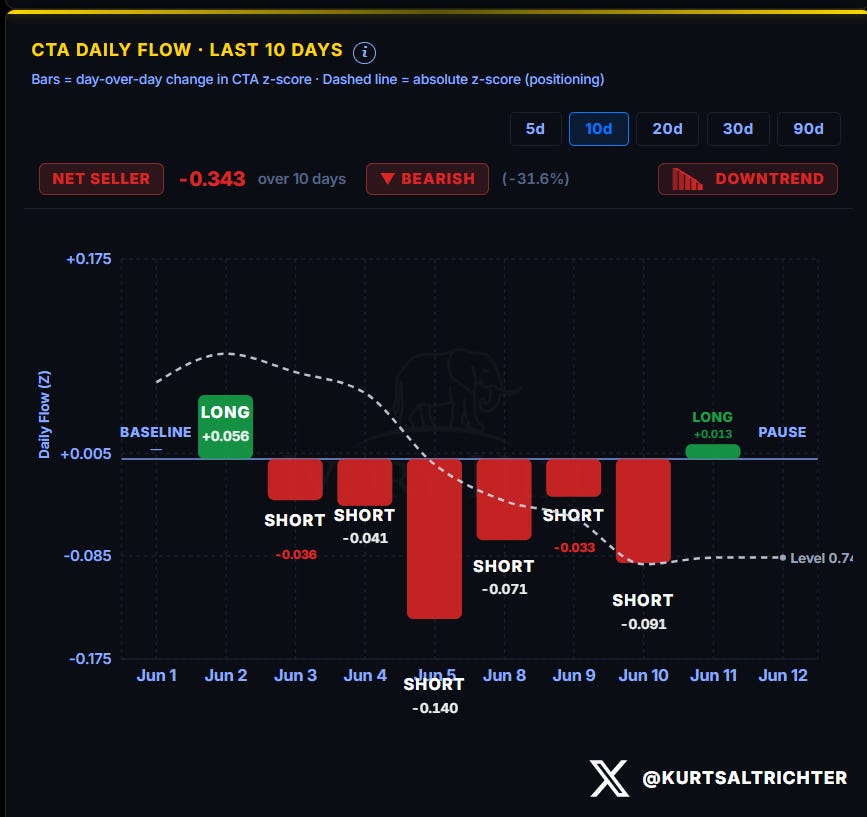
CTAs are net sellers on the z-score over the trailing ten days, Bearish, in a downtrend. The daily prints matter more than the ten-day total here.
Vol-control is louder and slower to turn. Net seller of $12.3 billion over ten days, Bearish, downtrend. The single -$10.1 billion sell I flagged last week was the Friday before. Last week, they sold another $4.5 billion on the CPI print Wednesday and $1.1 billion Thursday, then paused Friday with a token +$0.2 billion. The absolute allocation level kept grinding lower, now near $190 billion, down from $198.4 billion a week ago.
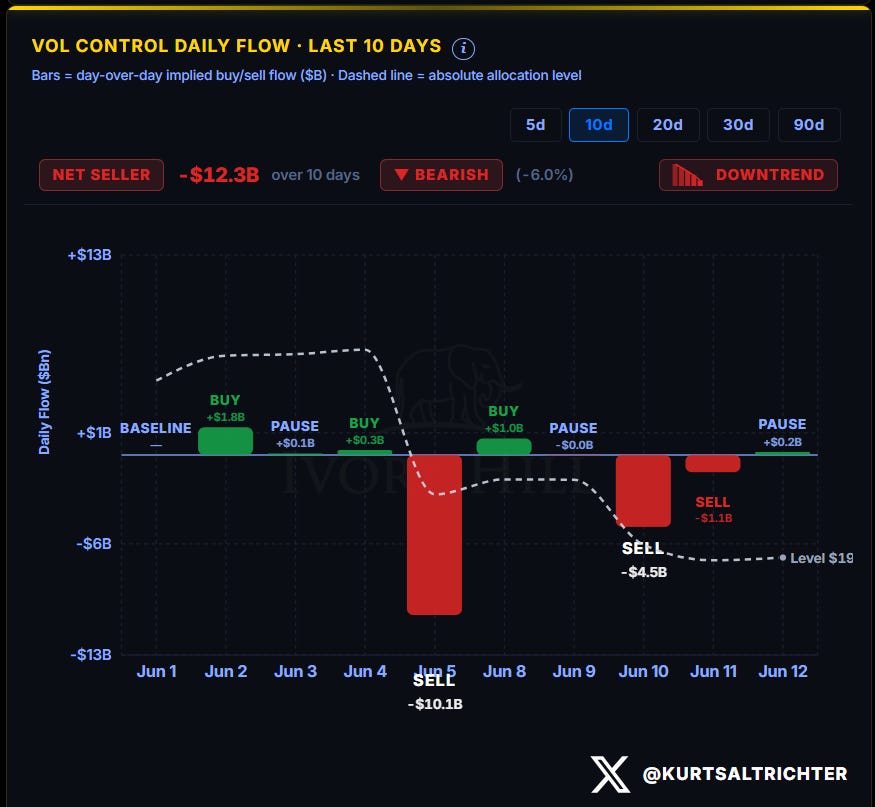
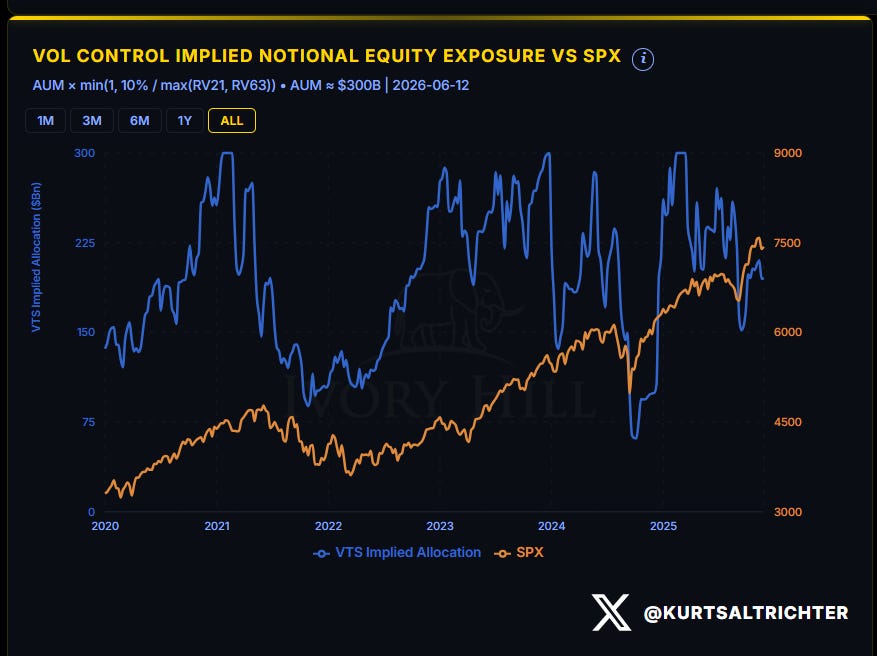
Vol-control stopped selling. The deleveraging formula keeps the foot off the gas as long as 1-month realized vol stays elevated, and 1-month just crossed above 3-month, so the mechanical bid does not return until vol comes back in. CTAs turned first because they trade trends. Vol-control turns last because it trades vol, and vol is the signal that just deteriorated.
SYSTEMATIC POSITIONING INDEX
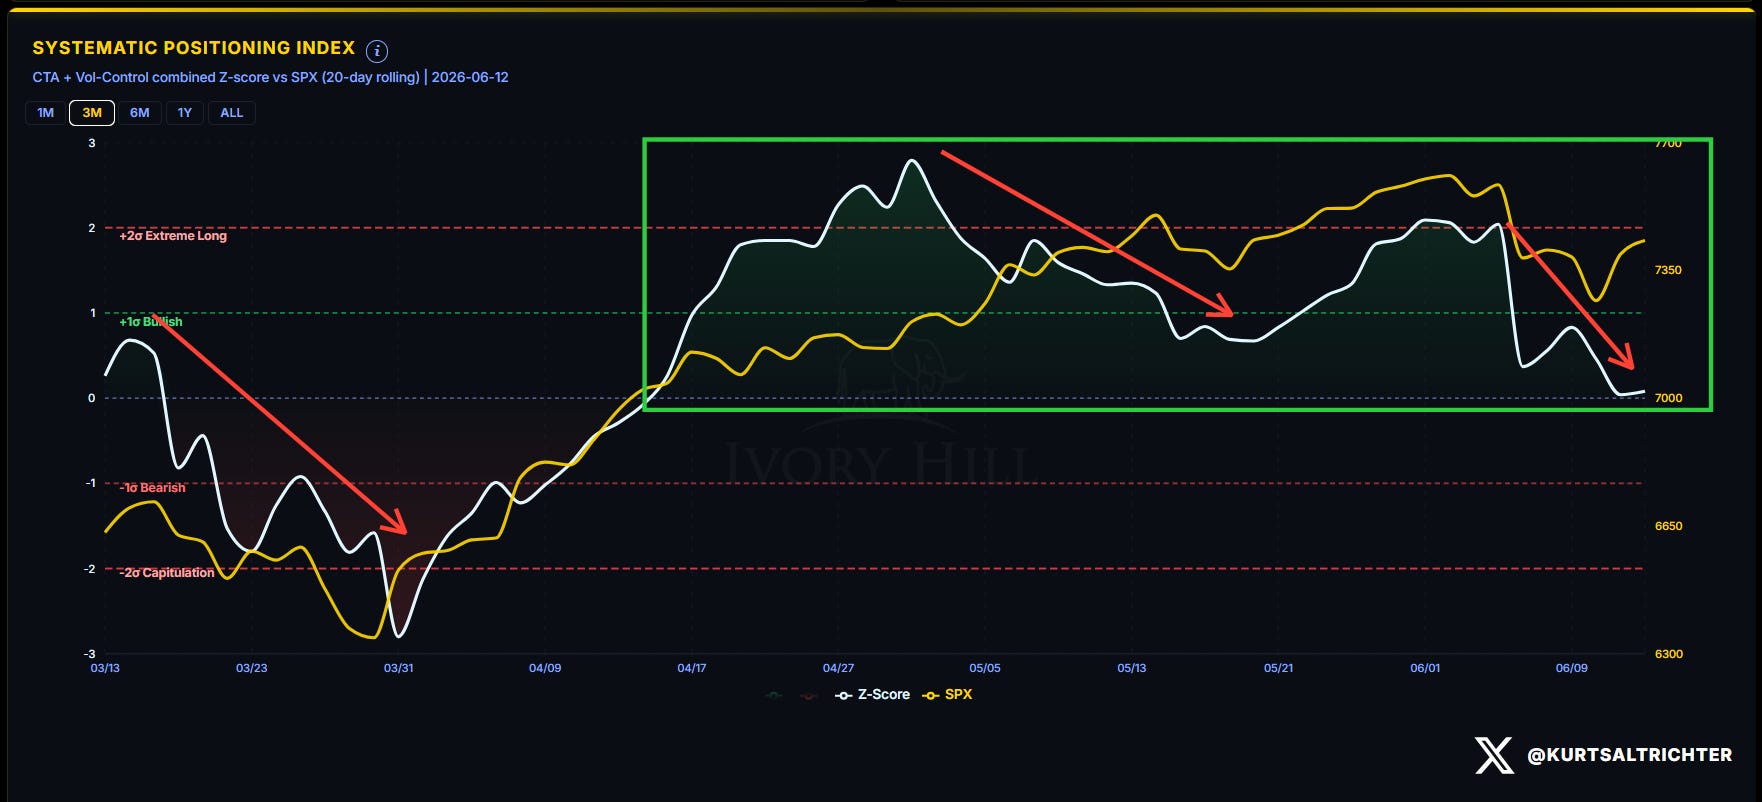
The combined z-score collapsed from +2 sigma at the start of June (Extreme Long) all the way back to roughly zero. The crowded systematic long that powered the run is now unwinding. Positioning is neutral, not extreme.
This removes the fuel I have been flagging for weeks. When the index was pinned at +2 sigma, the downside risk was a mechanical waterfall if momentum stalled. Momentum stalled, the waterfall came, and the de-grossing is largely done. This is the one piece of the report that argues the worst of the selling pressure has already cleared.
MARKET BREADTH
60.6% of S&P 500 members are above their 200-day moving average as of Friday’s close. Optimism.
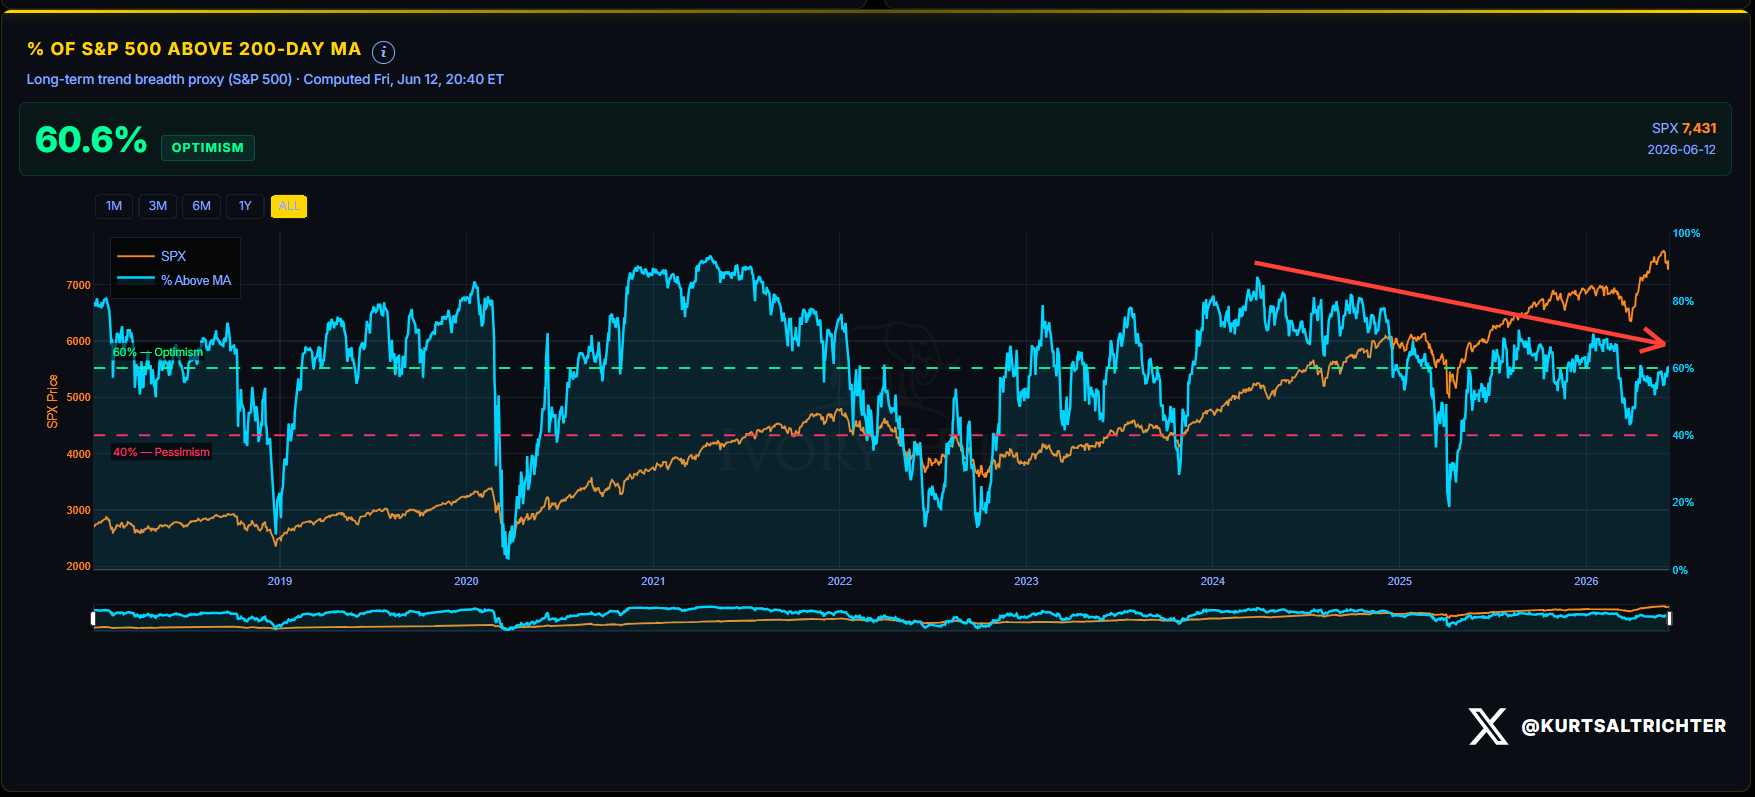
The line that matters for a regime shift is 40%, and breadth is nowhere near it. This remains a price and volatility event, not a breadth event. Breadth is arguing that the structural damage is contained at the index level and has not spread to the broader market.
DEALER GAMMA DASHBOARD AND COMPOSITE REGIME
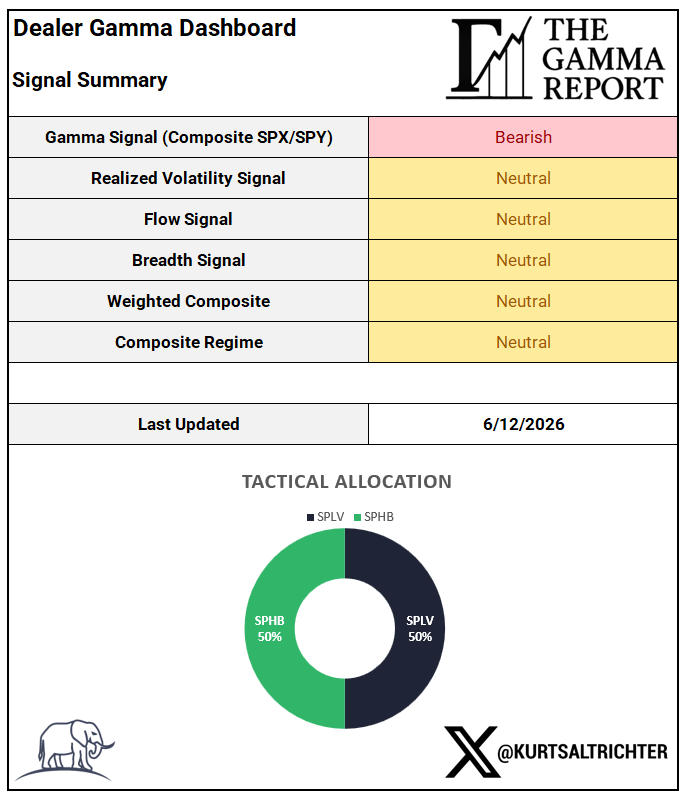
Gamma remains Bearish; price is below the flip. Realized Volatility downgraded from Bullish to Neutral as the 1-month crossed above the 3-month. Flow upgraded from Bearish to Neutral as CTAs exhausted their selling and turned. Breadth stays Neutral, though it is accelerating into Optimism. The Weighted Composite holds Neutral. The Composite Regime holds Neutral.
The model did not flinch this week. The RV deterioration would have pushed the composite toward Risk-Off on its own.
The regime shifts to Risk-Off from here if one of three develops:
breadth breaks below 40%, which is far off and moving the wrong way for the bears;
1-month RV holds above 3-month on a sustained basis, which just started and is the live risk; or the systematic flows re-deepen, which would require vol-control to resume selling and CTAs to roll back over.
The flows are improving. The single domino still standing is realized vol, and it is balanced on the edge.
TACTICAL ALLOCATION PERFORMANCE
The weekly portfolio recovered to 24.16% YTD, while the S&P 500 gained 0.72 points to 9.15%. The daily portfolio sits at 14.26%. Both sleeves are still off their high watermark for the year.
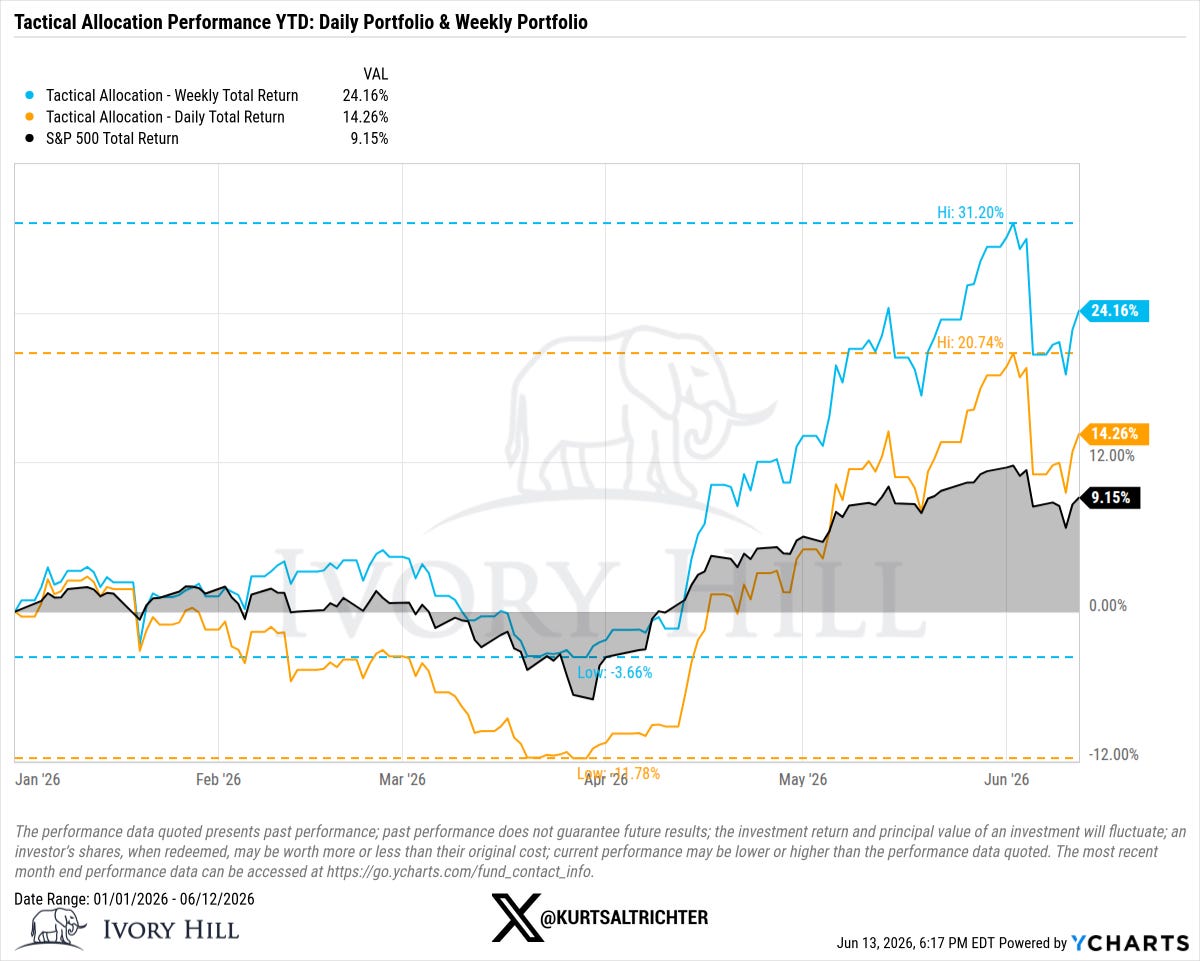
The defensive rotation did not cost much on the bounce because the model still holds 50% SPHB 0.00%↑ , and SPHB 0.00%↑ caught the semiconductor-led recovery. SPLV anchored the other half through the chop. The model went neutral two weeks ago, the market bounced this week, and the weekly portfolio still outpaced the index on the recovery because high beta cut both ways, and this last week was the way up. The model is fully invested in equities at all times and holds no cash. Direct comparisons of returns to the index do not capture its purpose as a market-structure barometer of equity beta.
FOMC Wednesday is the next test, and it lands with the market sitting one point under the flip. A reclaim and hold above 7,432 puts dealers back in positive gamma and reopens the path back to Risk-On. A rejection here, with the realized vol signal already neutralized, leaves the composite one downgrade from Risk-Off. The market spent this entire week fighting back to the decision line and stopped one point short of crossing it. Wednesday afternoon, in negative gamma, the Fed gets to break the tie, and dealers amplify whichever way it breaks.
And remember - The one fact pertaining to all conditions is that they will change.
Feel free to use me as a sounding board.
Follow me on X for more updates.
Best regards,
Schedule a call with me by clicking HERE
Kurt S. Altrichter, CRPS®
Wealth Advisor | President
Disclosure
The Gamma Report is published by Ivory Hill, LLC. All opinions and views expressed in this report reflect our analysis as of the date of publication and are subject to change without notice. The information contained herein is for informational and educational purposes only and should not be considered specific investment advice or a recommendation to buy or sell any security.
The data, models, and tactical allocations discussed in this report are designed to illustrate market structure and positioning trends and may differ from portfolio decisions made by Ivory Hill, LLC or its affiliates. Investing involves risk, including the possible loss of principal. Past performance is not indicative of future results.
Ivory Hill, LLC, and its members, officers, directors, and employees expressly disclaim any and all liability for actions taken based on the information contained in this report.