

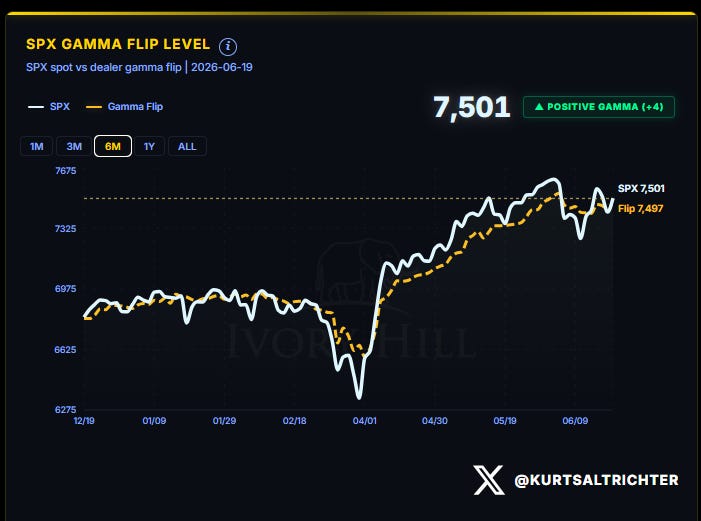
Positive gamma is back. The S&P 500 closed Thursday at 7,501, four points above the gamma flip line at 7,497. Above that line, dealers are forced to buy dips and sell rips, which tends to lower the volatility in the market. Below the line, they do the opposite, amplifying volatility in both directions. We are back on the stable side for the first time in three weeks. It is a pretty small margin, so this is a tape where headline risk could put the tape below the gamma flip line.
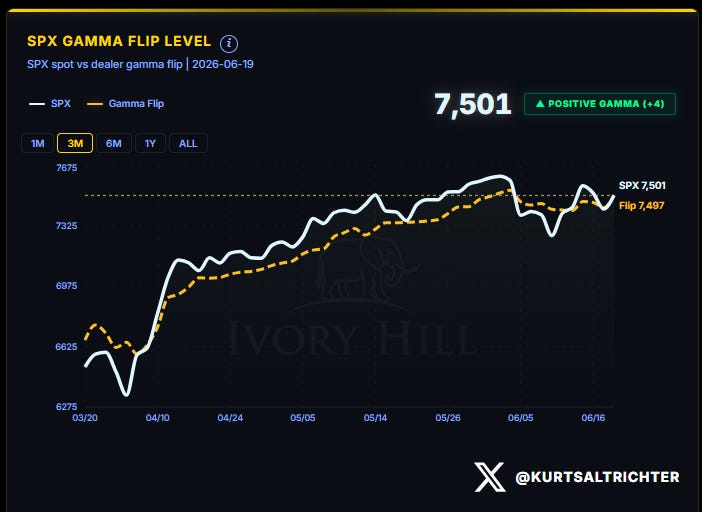
In last week’s report, I said to reclaim 7,432, and dealers flip back to long gamma, which reopens the path higher. The market did exactly that.
Getting there was a dog fight. The index gapped to 7,554 Monday, sold the Fed down to 7,420 Wednesday and back under the flip, then ripped to 7,501 Thursday. Up 0.94% on the week, all of it a two-way fight.
Warsh ran his first meeting on Wednesday. The Fed held rates at 3.50 to 3.75 on a unanimous vote, but the forecasts turned hawkish. The Fed now expects its next move to be a hike, not a cut, and raised its inflation forecast to 3.6%. Stocks sold off in response, the dollar caught a bid, and gold kept falling. I still think inflation tops out near-term and the July 14 CPI prints under 4%.
ASSET PERFORMANCE
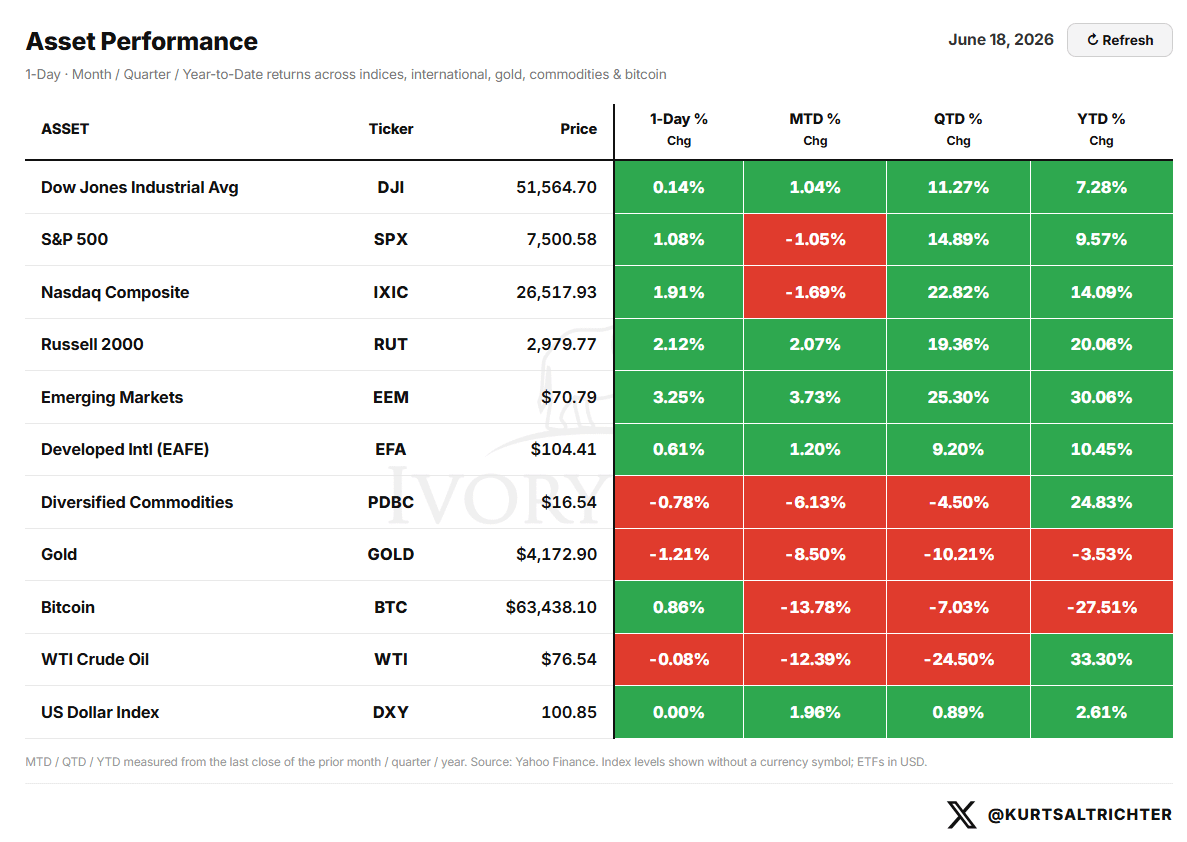
June is still red for the S&P 500 (-1.05%) and the Nasdaq (-1.69%). Tech took the early-month hit and is still climbing out.
WTI Crude Oil fell to $76.54, down 24.5% on the quarter. It was +47.82% on the year in last week’s report and sits at +33.30%. The year’s best trade is unwinding fast, and you can see it in XLE sliding into the Weakening corner of the rotation map further below. Keep an eye on this as we could easily see another spike to $100 on a #TumpTapeBomb headline. Gold turned negative for the year at -3.53%. Bitcoin is still the worst major at -27.51%.
IMPLIED CORRELATION: THE DISPERSION SIGNAL
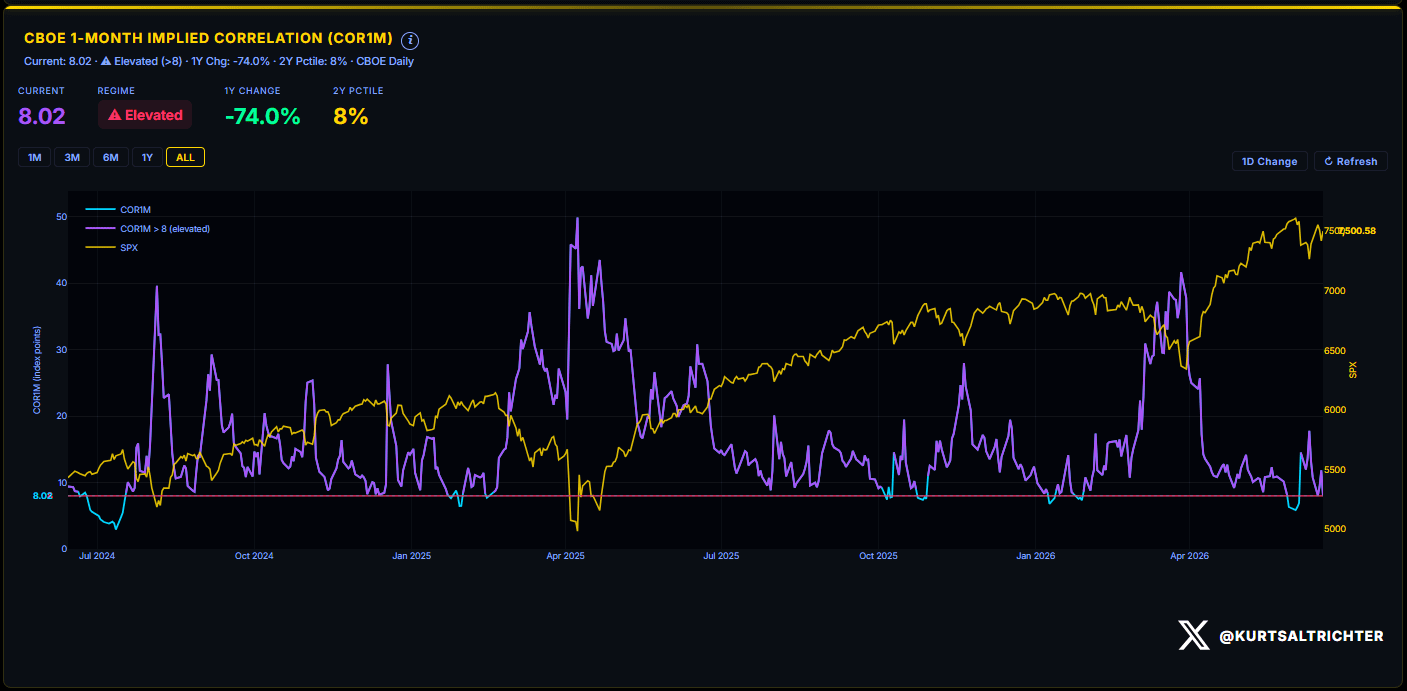
One-month implied correlation sits at 8.02. This index measures how tightly S&P 500 stocks move together. Above 8, stocks trade as one herd, and only the index direction counts. Below 8, they separate and trade on their own merits. Last week’s report had it at 10.74, and I said the herd trade holds until COR1M closes under 8. It is almost there. Underneath the index, names are already splitting, semis ripping while IT services break down.
THE ECONOMIC CALENDAR AND VOL TERM STRUCTURE
The options market is pricing a quiet front half of the week, then more movement into month-end. The near-term expected move is ±68 points.
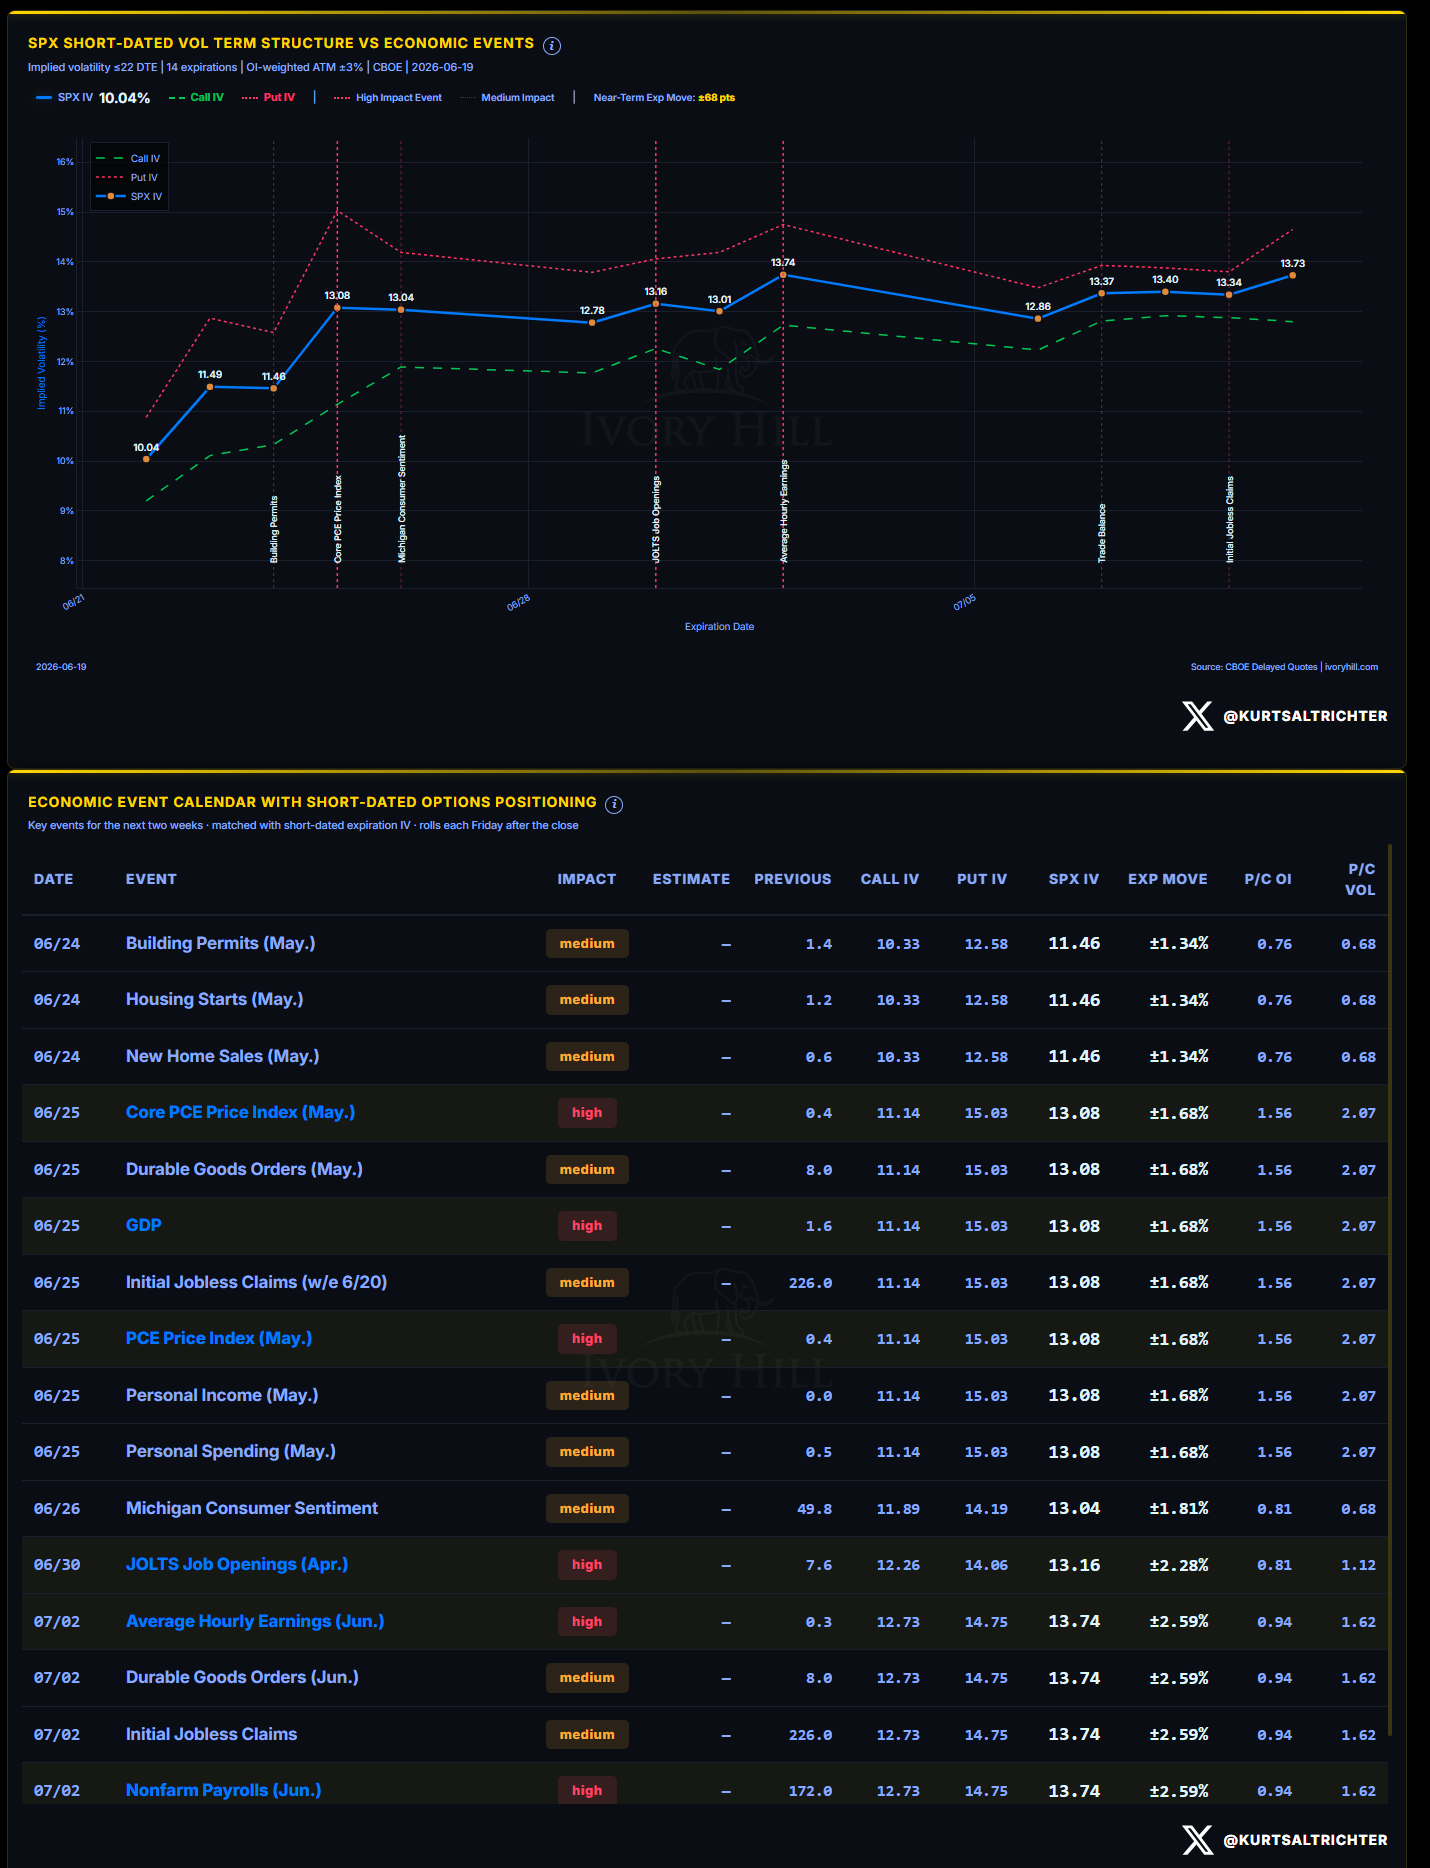
Thursday, June 25, is the day to watch. Core PCE, the PCE index, and GDP all drop on the same day, with the options market pricing a ±1.68% move. Core PCE is the Fed’s preferred inflation gauge, and the Fed just told you it is worried about it. A hot number here, into a Fed that already raised its forecast to 3.6%, and the market will reprice rather quickly. The bigger event sits July 2: payrolls, priced at ±2.59%, the day before the holiday weekend.
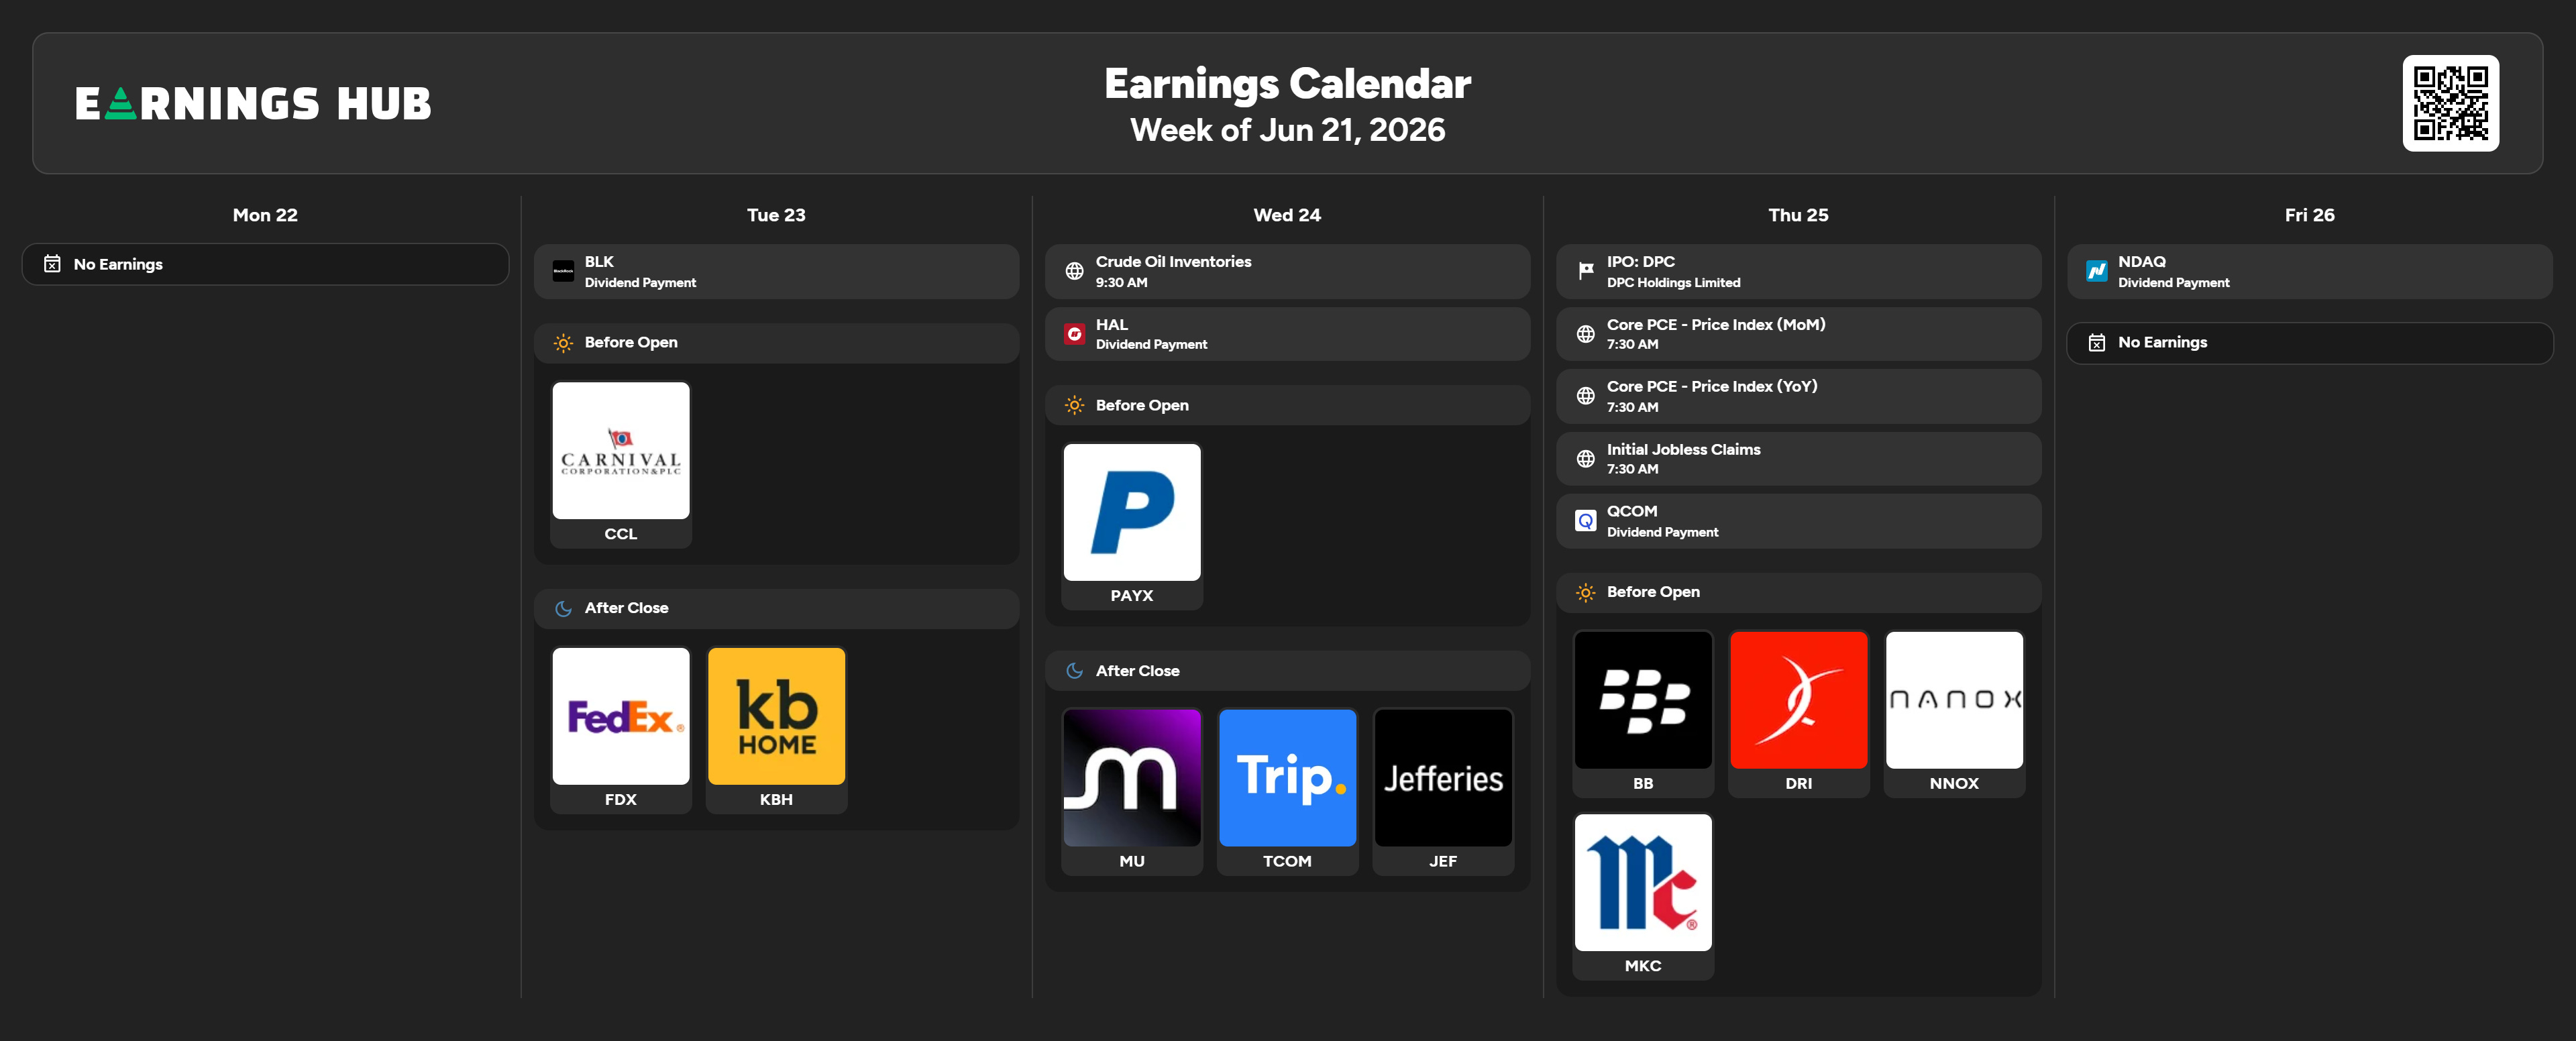
EARNINGS
Light earnings week. Micron MU 0.00%↑ on Wednesday after the close is the print that can move the tape. It reports straight into the semiconductor names that just regained leadership, so a weak outlook from Micron hits the exact stocks that are carrying the index right now. FedEx FDX 0.00%↑ Tuesday is the read on freight and the broader economy. The rest is noise.
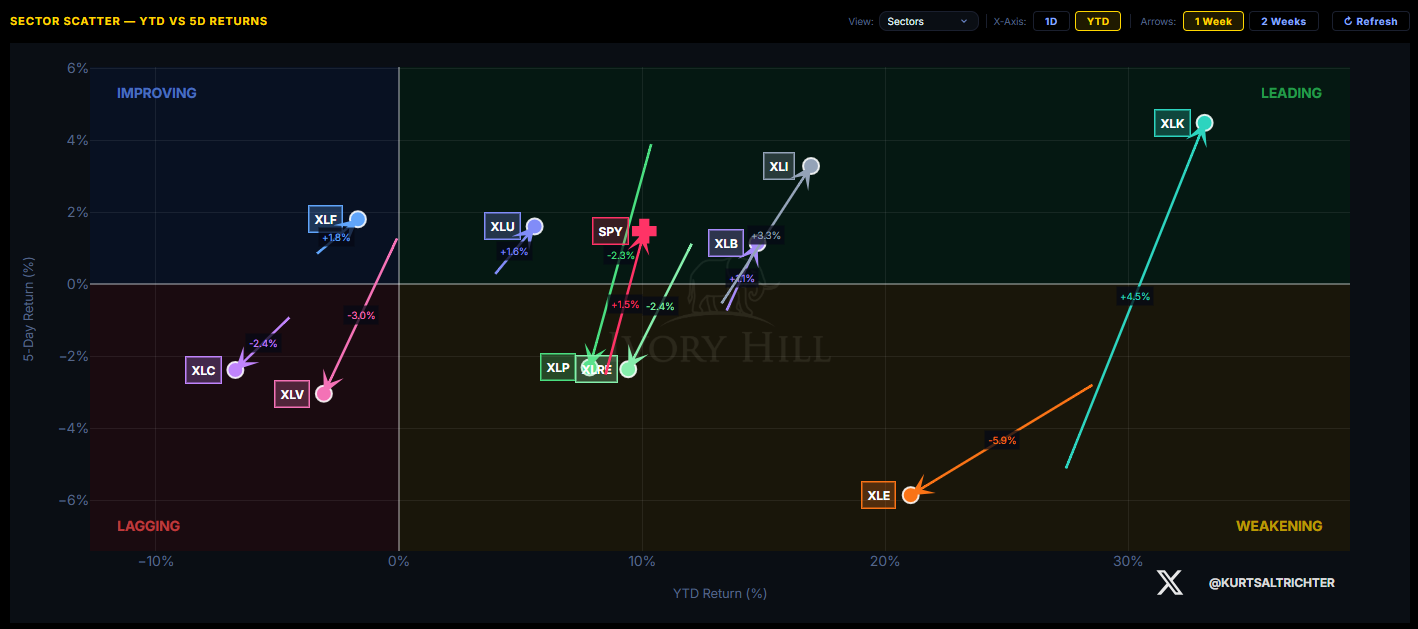
MOMENTUM PULSE CHECK
Technology and Industrials lead the rotation, at nearly 30% and 15% year-to-date. Energy is rolling over: still the top sector near 20% YTD, but down 6% on the week and sliding into the Weakening zone, the same story WTI is telling. Communications and Health Care are the laggards.
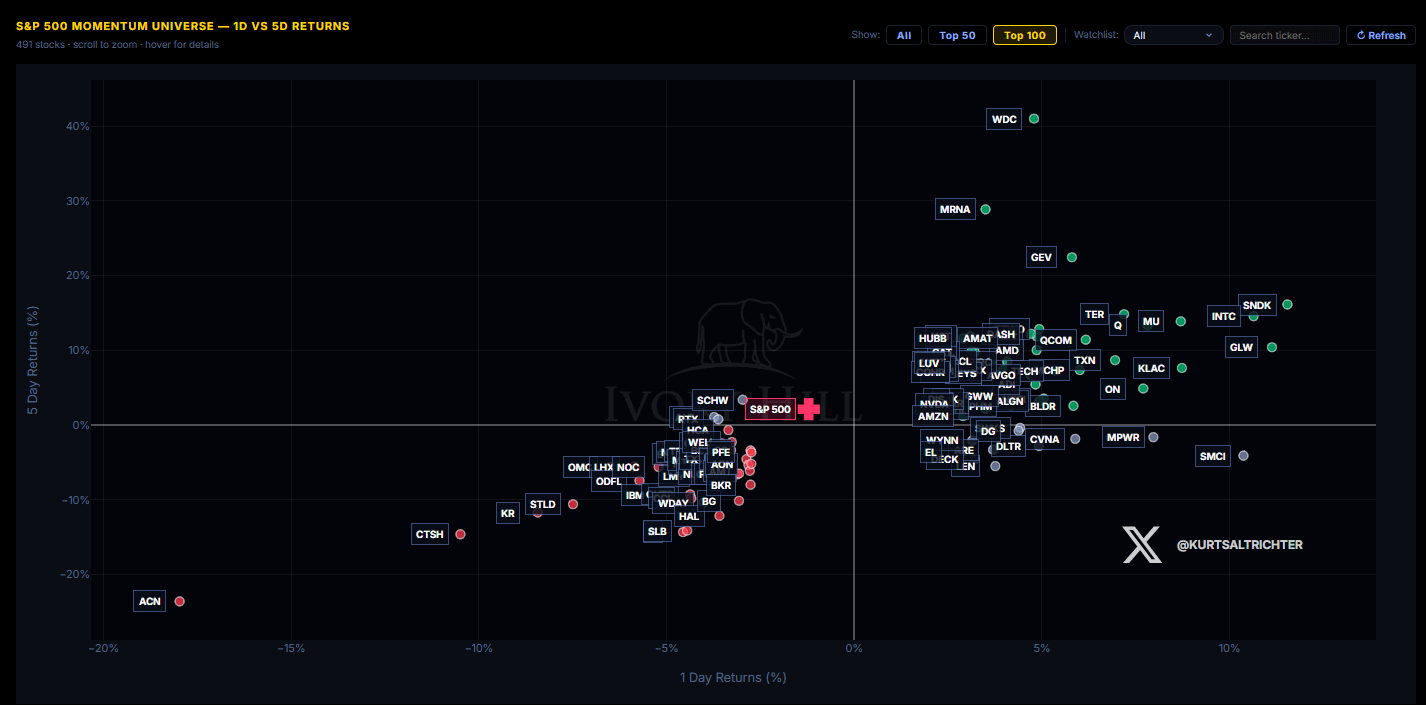
Hardware owns the leaderboard. Western Digital ran +40% over five days, with Micron, Intel, SanDisk, KLAC, Applied Materials, and Qualcomm all up double digits. Accenture is the worst name on the screen, down 18% on the day and down 25% on the week after it cut its outlook. In last week’s report, I flagged Accenture as the cleanest read on enterprise tech spending and warned that a cut there would not stay contained to one stock. Cognizant, its closest peer, got hit right alongside it. Hardware rips, services break. That is what happens when correlation falls, and money flows start picking winners and losers instead of buying everything at once.
MARKET STRUCTURE: THE ANCHOR POINT
Spot 7,501, gamma flip 7,497, dealers net long gamma by four points. For eight weeks, this line acted as a floor, with dealers buying every dip, and the index climbed from 6,275 to 7,580 on that support. Then it broke and turned into a ceiling. Last week, the market fought back through it and held, barely. Now dealers are buying weakness again, which puts a cushion under the tape as long as price holds above 7,497.
The cushion is very thin, so any downside move can easily move us back into negative gamma.
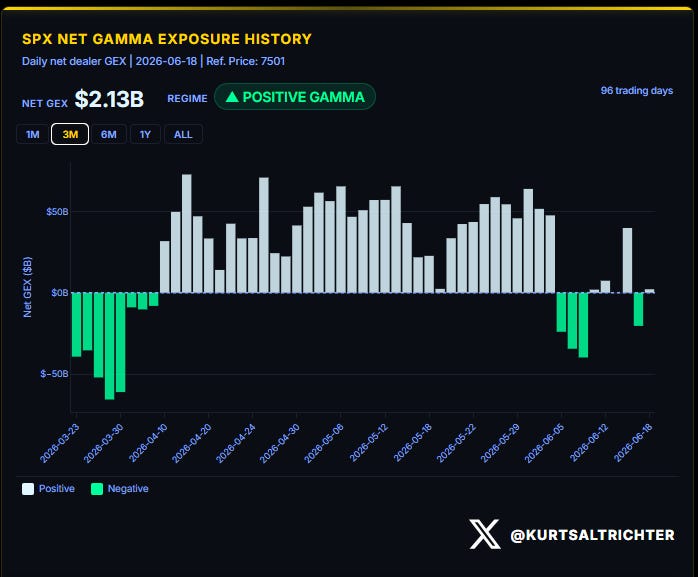
June quad-witch settled Thursday. Quad-witch is the quarterly expiration where index, stocks, and futures options all expire at once.
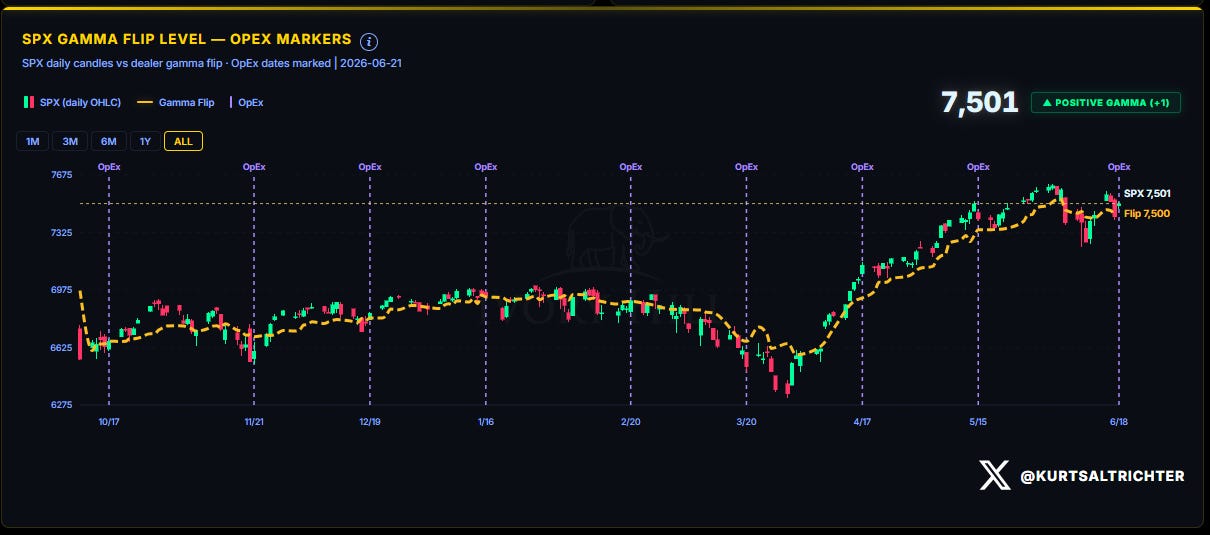
A large block of the gamma that was cushioning the market rolled off in a single print. Warsh’s first Fed meeting and the OpEx landing in the same 4-day window, with dealers already short gamma and no cushion underneath. Both events had an impact, and the SPX still closed in positive gamma. The downside risk is the window right after the OpEx. Today. The gamma that pinned down the price has disappeared into thin air on Tuesday, dealer positioning lightens, and data and history show that the Monday and Tuesday after a quad-witch tend to see sharper moves.
WEEKLY EXPECTED MOVE
This week, the options market is pricing a range of 7,675 on the upside (+2.33%) and 7,326 on the downside (-2.33%), with an outer floor at 7,151. IV locked at 12.9%.
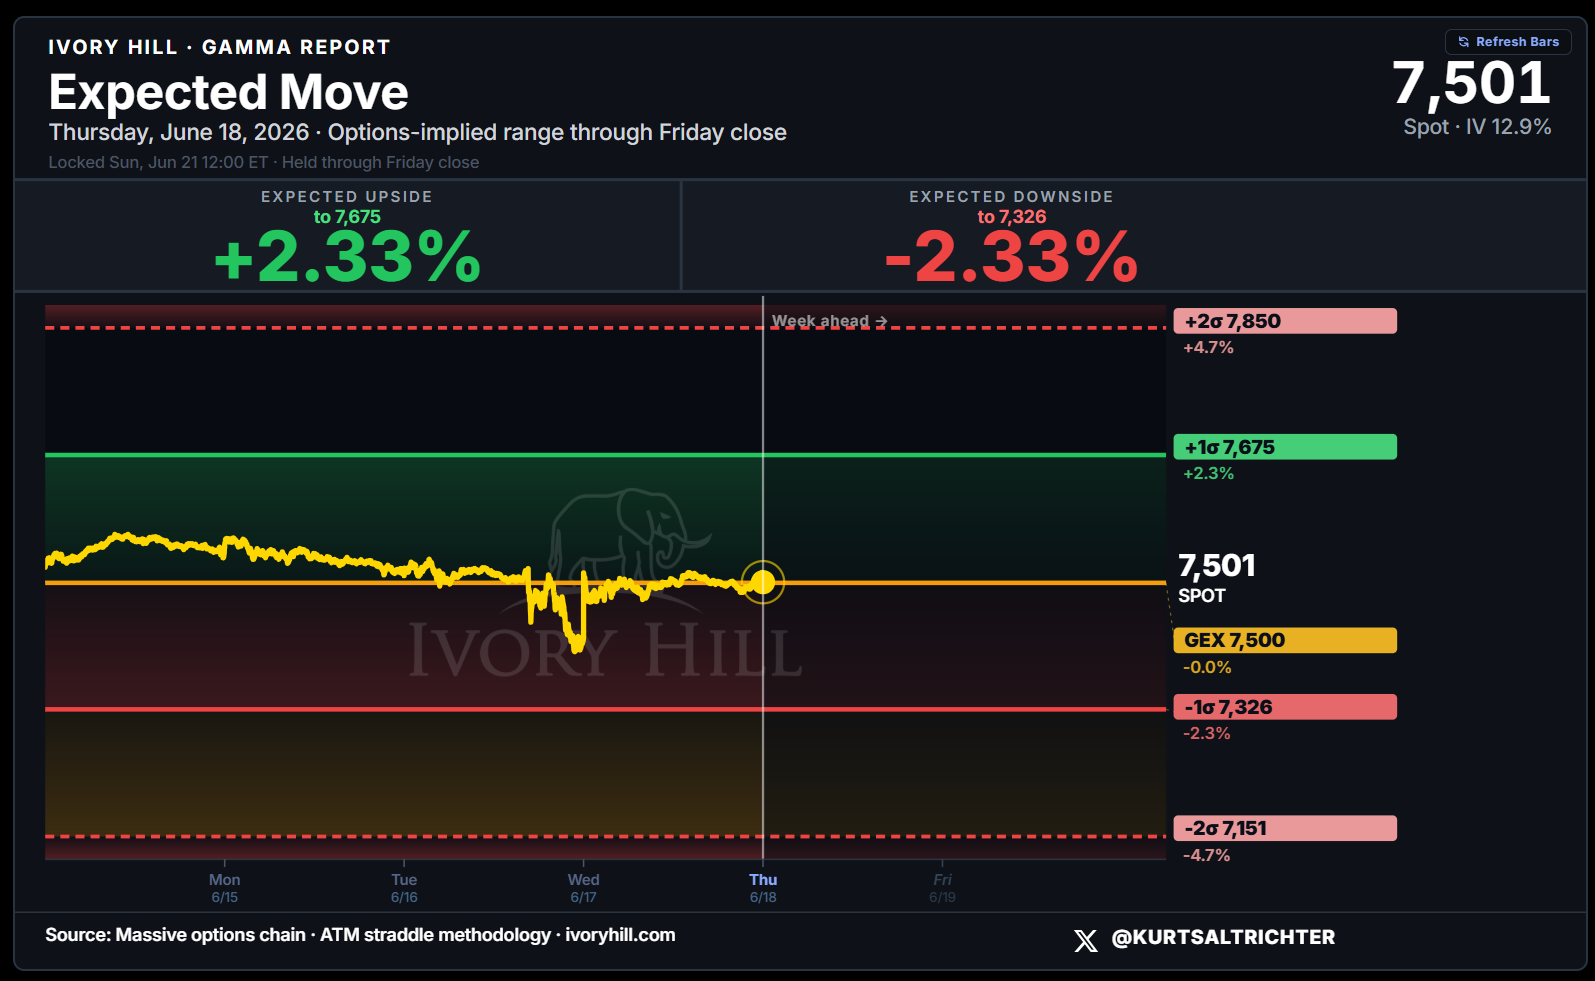
Watching the three-week trend in the expected move can be helpful. The downside band has stepped up for three weeks running: 7,243, 7,286, and 7,326. Higher lows, so the floor under the market is still rising, but the climb is flattening, up 40 points this week after 43 last week. The bigger move is the range itself blowing out: ±1.90%, then ±1.96%, then ±2.33%, a jump roughly six times last week’s step. The options market is pricing a far wider spread in the week ahead. The floor is barely rising while the size of the expected swings is expanding. First support is the flip at 7,497, then 7,326. Upside target 7,675.
VOLATILITY REGIME
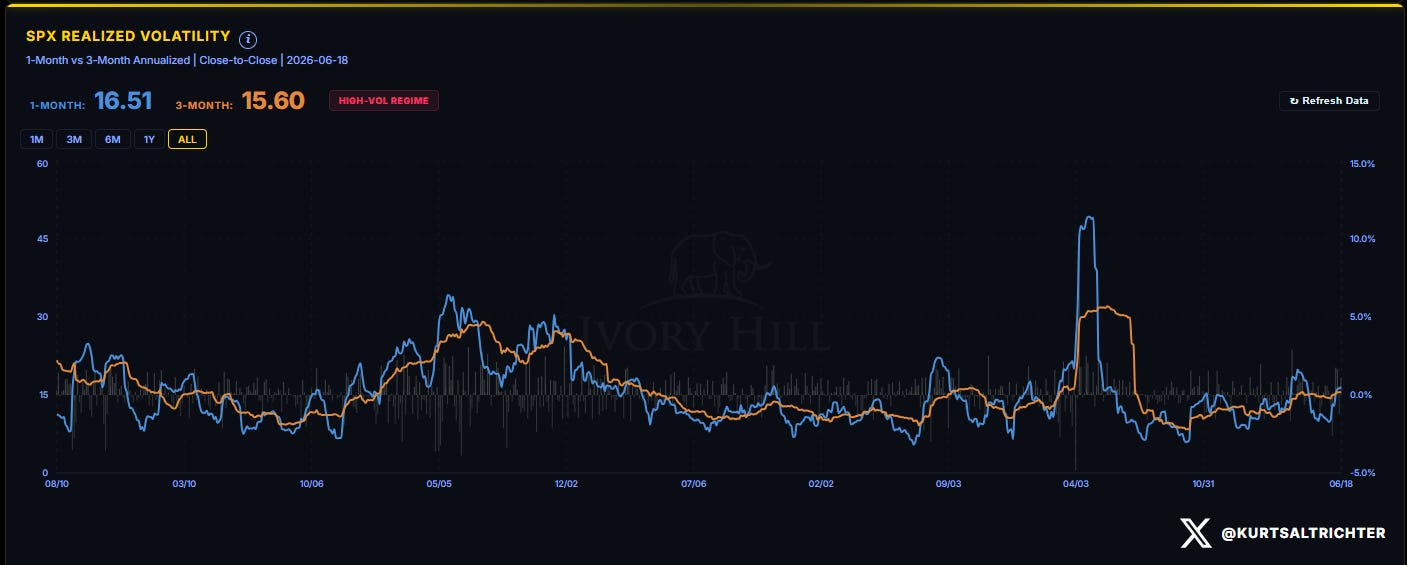
One-month realized vol is above three-month realized vol, and when this happens, it is an inversion, meaning the market has been moving more violently over the last month than over the last quarter. This is the one signal still arguing against the bounce. Gamma says the tape is steady, realized vol says it is not, and the expiration just removed the offset.
SYSTEMATIC FUND FLOWS
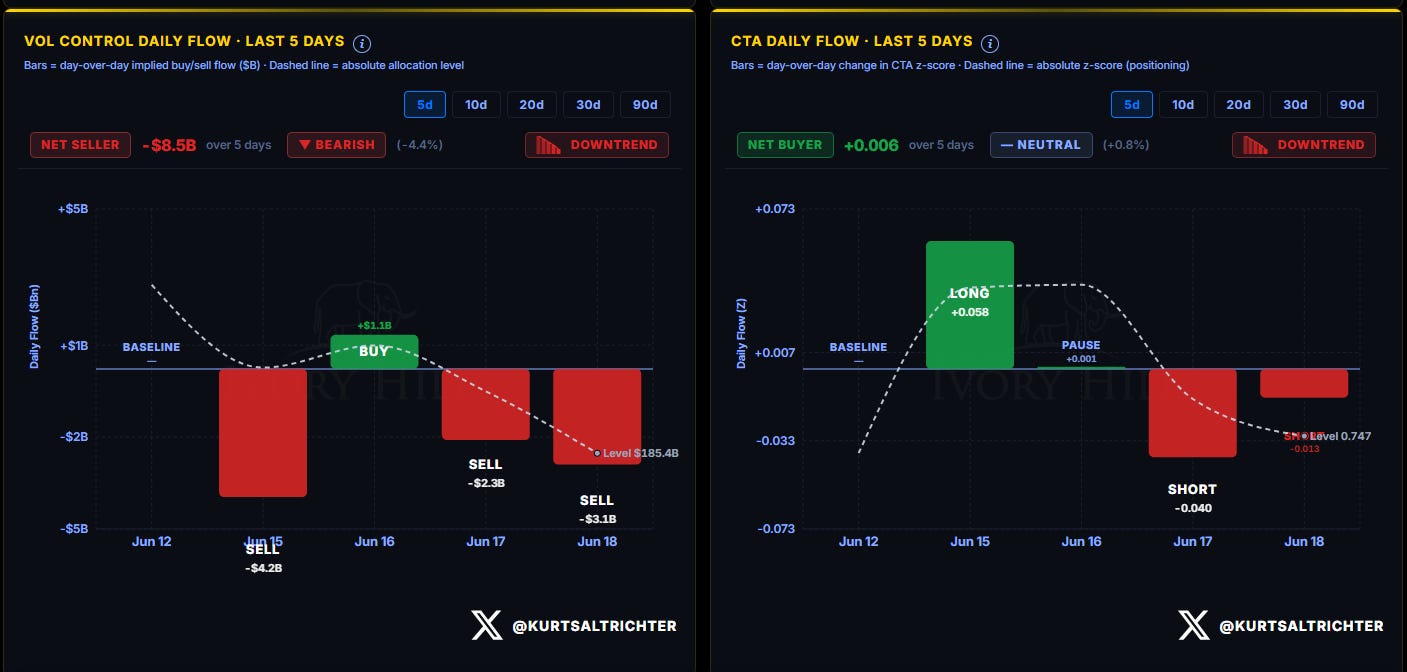
CTAs flipped to buyers, +0.006 over five days, after selling all of the prior week. These are trend-following funds, so they buy as the trend turns up, and it turned up when the price reclaimed the gamma flip line. Vol-control funds are still selling, -$8.5B on the week, with their equity allocation grinding down to $185.4B. These funds cut exposure when volatility rises, and since realized vol is still elevated, they keep selling until it comes down.
SYSTEMATIC POSITIONING INDEX
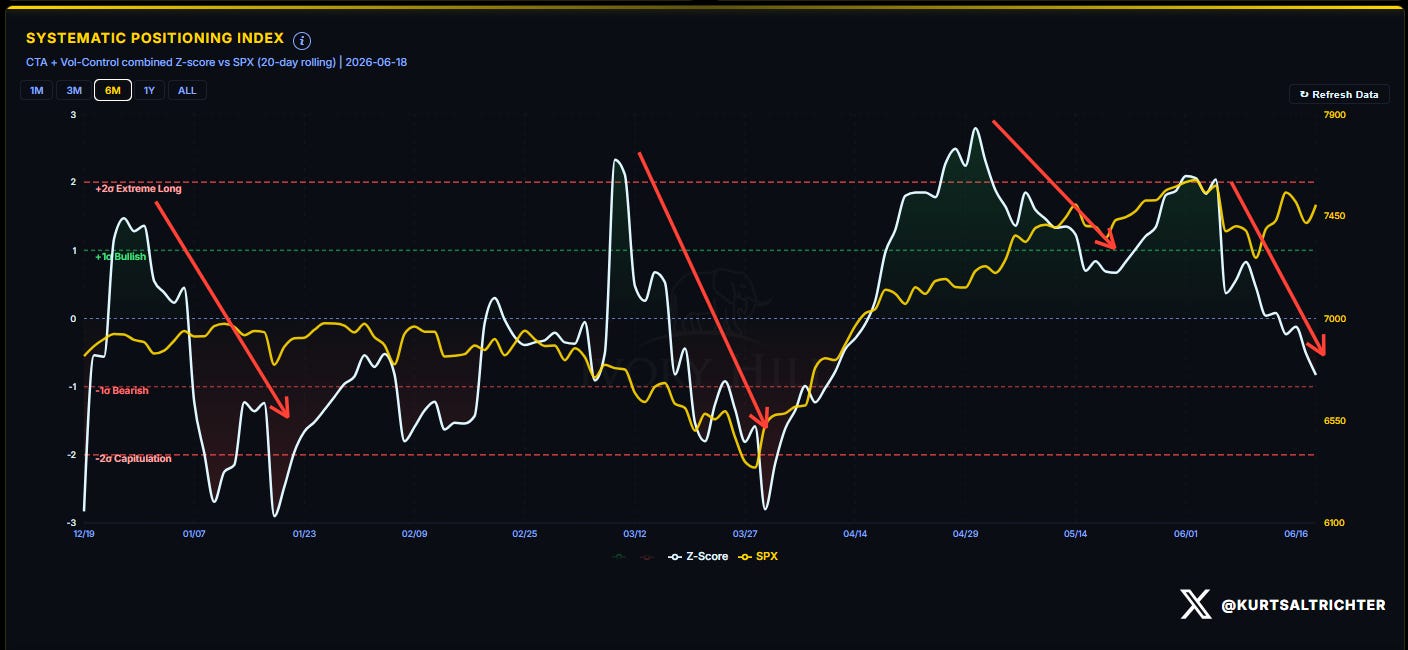
The combined positioning score is now below zero, near -0.9. This tracks how heavily the systematic funds are positioned. It ran at an extreme long in early June and has now flipped to a small net short. The crowded long trade that powered the run off 6,275 is fully unwound. The forced selling I warned about for weeks already happened, which means the fuel for another leg down is largely spent.
MARKET BREADTH
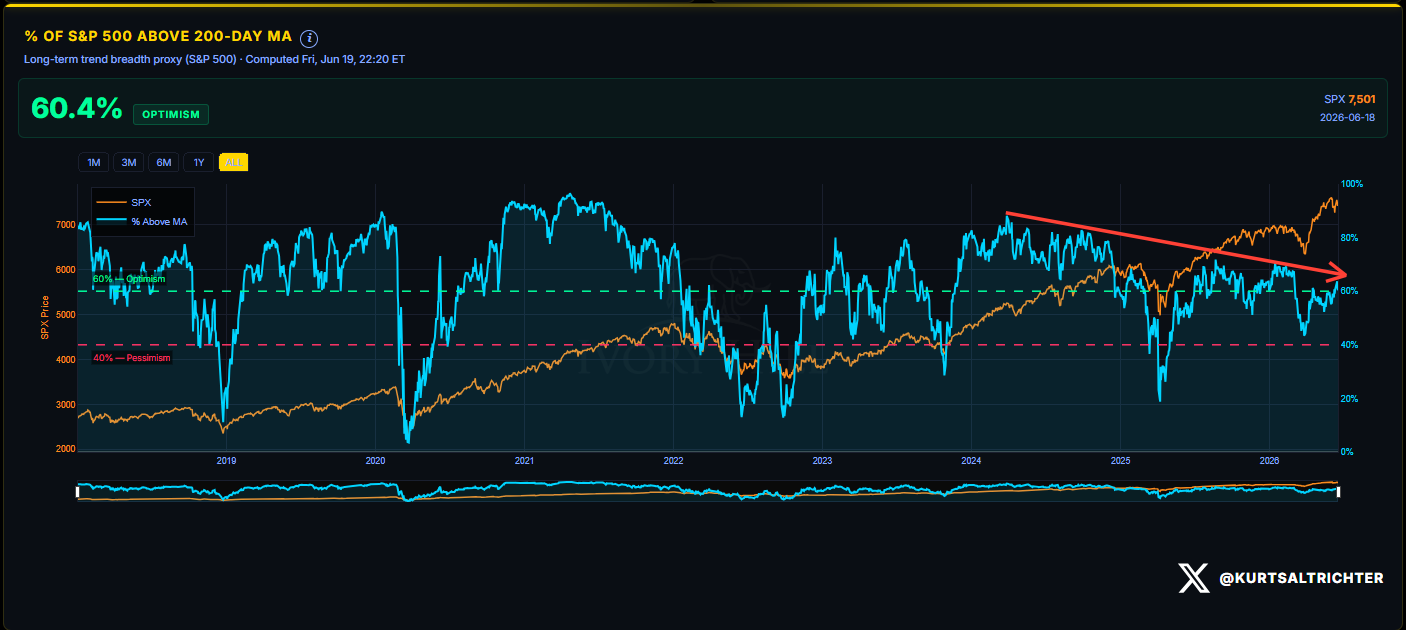
60.4% of the S&P 500 trades above its 200-day average, flat from last week, still in Optimism. Breadth measures how many stocks are participating in the move. The level that signals a true regime breakdown is 40%, and we are nowhere close. The damage stayed at the index and mega-cap level and never spread to the “average” stock.
DEALER GAMMA DASHBOARD AND COMPOSITE REGIME
Gamma flipped to Bullish, Breadth is Bullish, Realized Vol is Neutral, Flow is Bearish. The blended score reads Neutral, but the regime prints Risk-On because the gamma reclaim and breadth outweigh the drag from vol and flow. Last week’s report sat at Neutral, with 50% SPLV and 50% SPHB. With Friday closed for the holiday, the model rebalanced on Thursday and moved to 75% SPHB and 25% SPXL, fully risk-on.
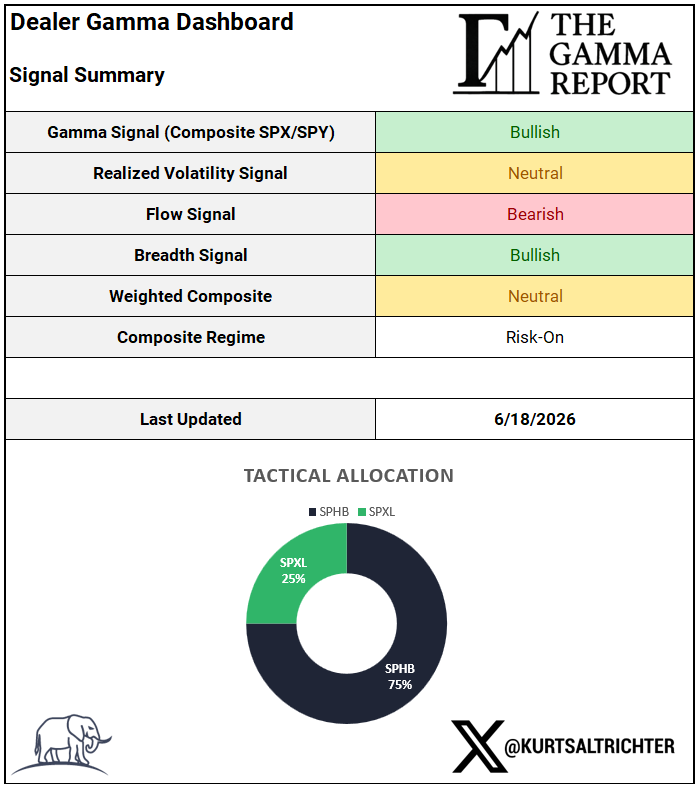
The tactical allocation will flip back to Risk-Off (defensive) on a close under 7,497, or systematic selling accelerates. Breadth is not the threat. Realized vol is. Same single domino as last week’s report, still standing.
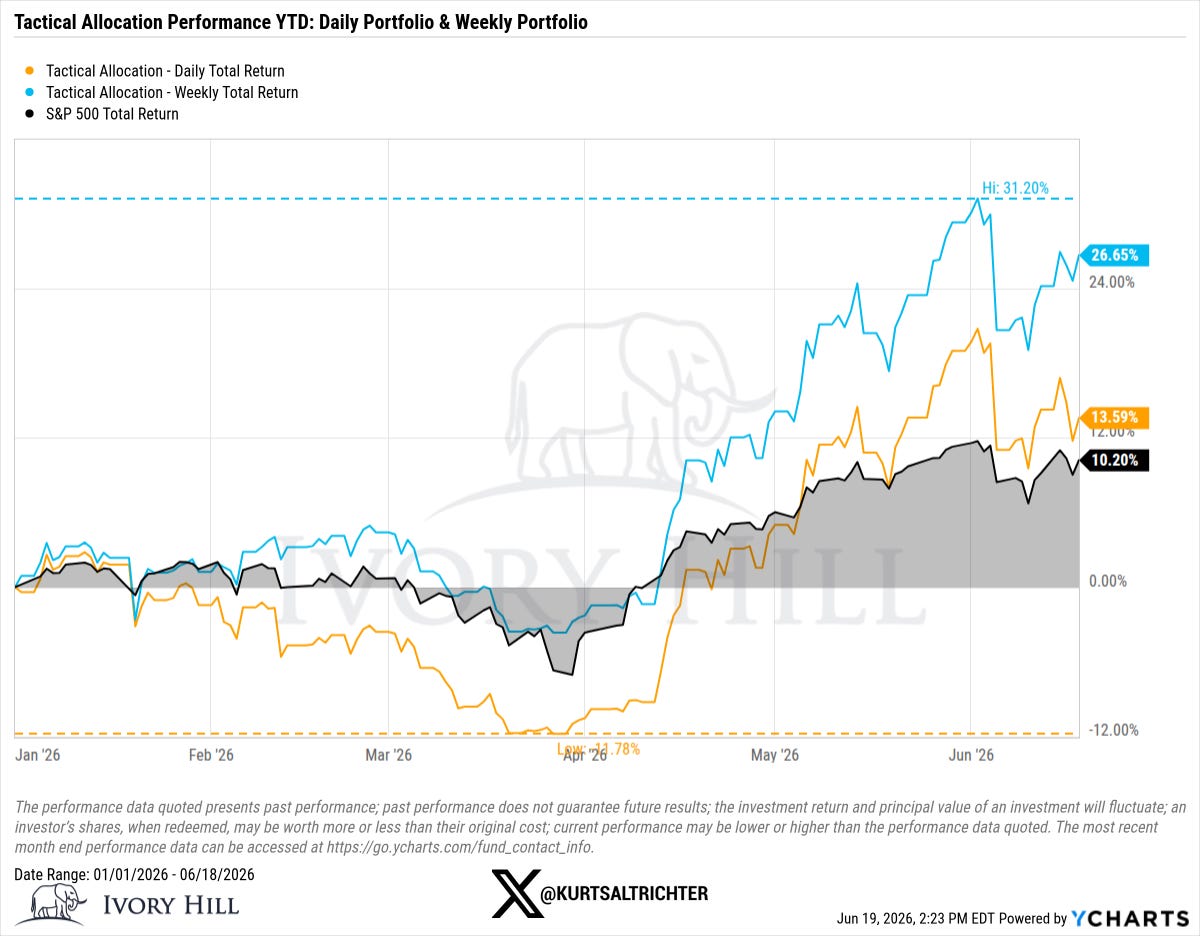
TACTICAL ALLOCATION PERFORMANCE
Weekly portfolio 26.65% on the year, S&P 500 10.20%, daily portfolio 13.59%.
The gamma that cushioned this tape for two months rolled off on Thursday, and we will not know whether the market can stand without it until this week kicks off. The flip line is back at 7,497, but holding it now means doing it without the cushion that just rolled off during OpEx. Thursday’s PCE is the catalyst most likely to force the answer. A hot core PCE into a thinned-out, post-expiration tape, with the Fed already projecting 3.6% inflation, is what drops the price back under the flip line fast. Hold 7,497 and 7,675 opens up. Lose it, and dealers are short gamma again with 7,326 on the next floor.
And remember - The one fact pertaining to all conditions is that they will change.
Feel free to use me as a sounding board.
Follow me on X for more updates.
Best regards,
Schedule a call with me by clicking HERE
Kurt S. Altrichter, CRPS®
Wealth Advisor | President
Disclosure
The Gamma Report is published by Ivory Hill, LLC. All opinions and views expressed in this report reflect our analysis as of the date of publication and are subject to change without notice. The information contained herein is for informational and educational purposes only and should not be considered specific investment advice or a recommendation to buy or sell any security.
The data, models, and tactical allocations discussed in this report are designed to illustrate market structure and positioning trends and may differ from portfolio decisions made by Ivory Hill, LLC or its affiliates. Investing involves risk, including the possible loss of principal. Past performance is not indicative of future results.
Ivory Hill, LLC, and its members, officers, directors, and employees expressly disclaim any and all liability for actions taken based on the information contained in this report.