
Gamma Report 6/29/2026
Welcome to the thirty-eighth issue of the Gamma Report

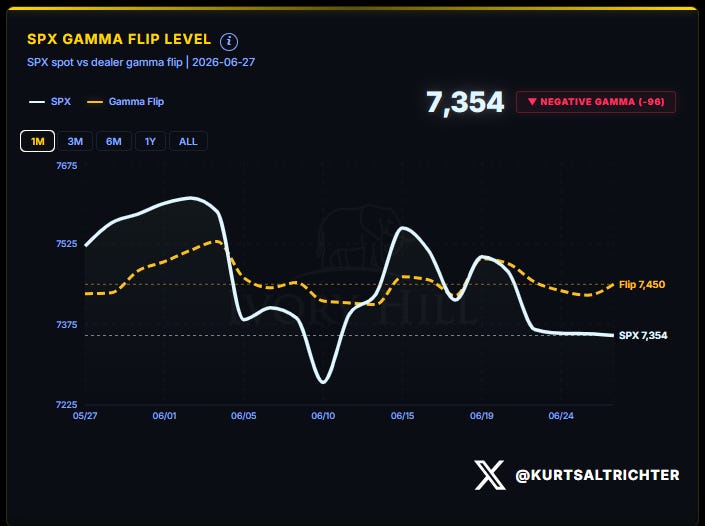
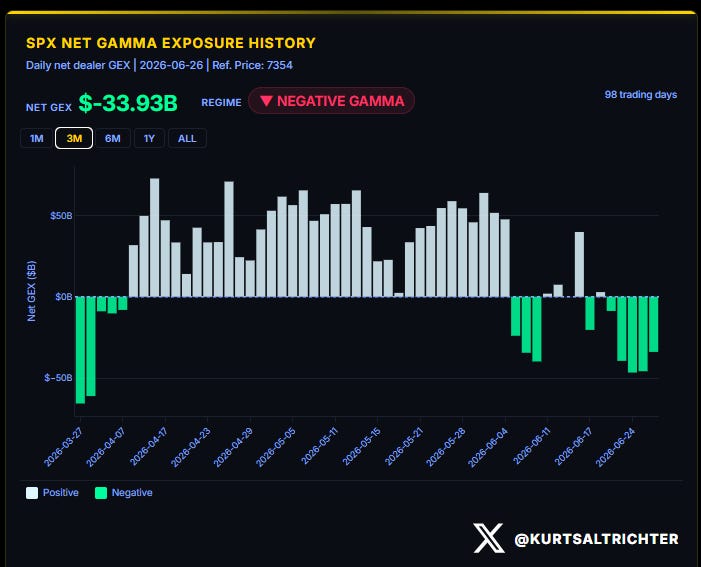
Negative gamma is back, and the margin is not thin this time. The S&P 500 closed Friday at 7,354, ninety-six points below the gamma flip at 7,450. Below that line, dealers sell weakness and buy strength, which amplifies every move in both directions. The cushion that protected this tape for two months is gone, and it has been gone for a full week.
Last week, I told you the 4-point cushion was paper-thin and that the days after a quad-witch tend to get violent once the pinning gamma rolls off. The market opened Monday, the 22nd, at 7,473, fell straight through the flip line, and never looked back. It lost ground every single session and closed the week 96 points underwater.
ASSET PERFORMANCE
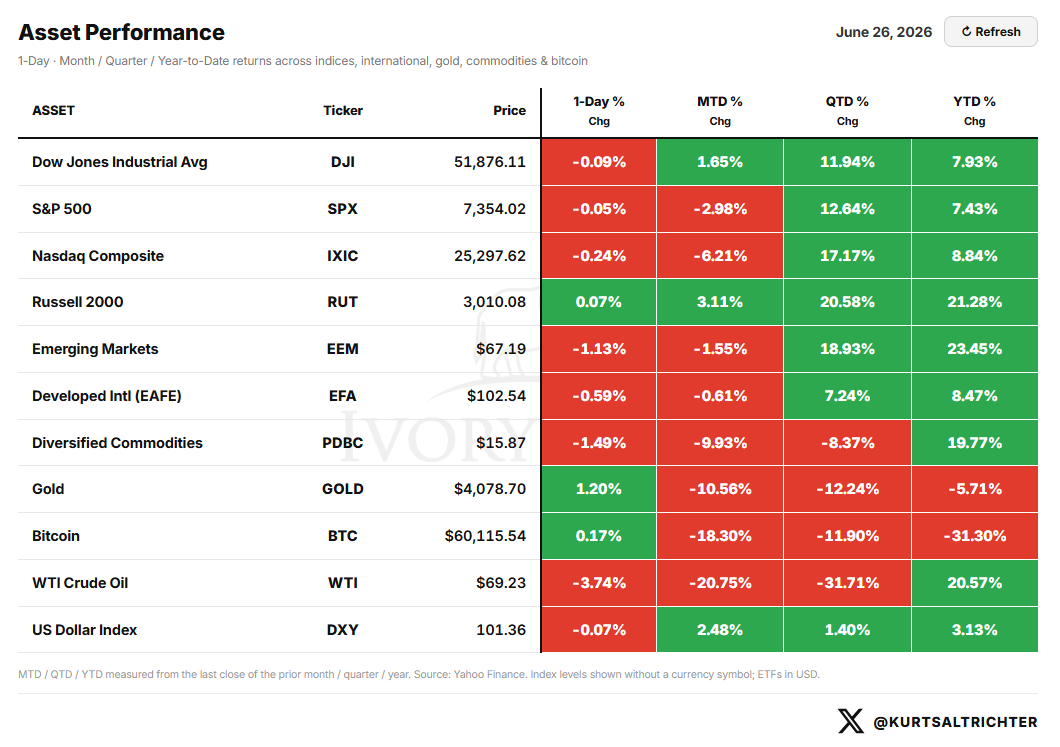
The Nasdaq is down 6.21% month-to-date, and the S&P 500 is down 2.98%, with nearly all of that damage in semiconductors. The Russell 2000 is the standout, up 21.28% on the year and the best major index of 2026. WTI Crude fell below $70 to $69.23, dropping its year-to-date gain from +33.30% last week to +20.57% as the #TrumpTapeBomb premium drains out. Bitcoin is still the worst major at -31.30%.
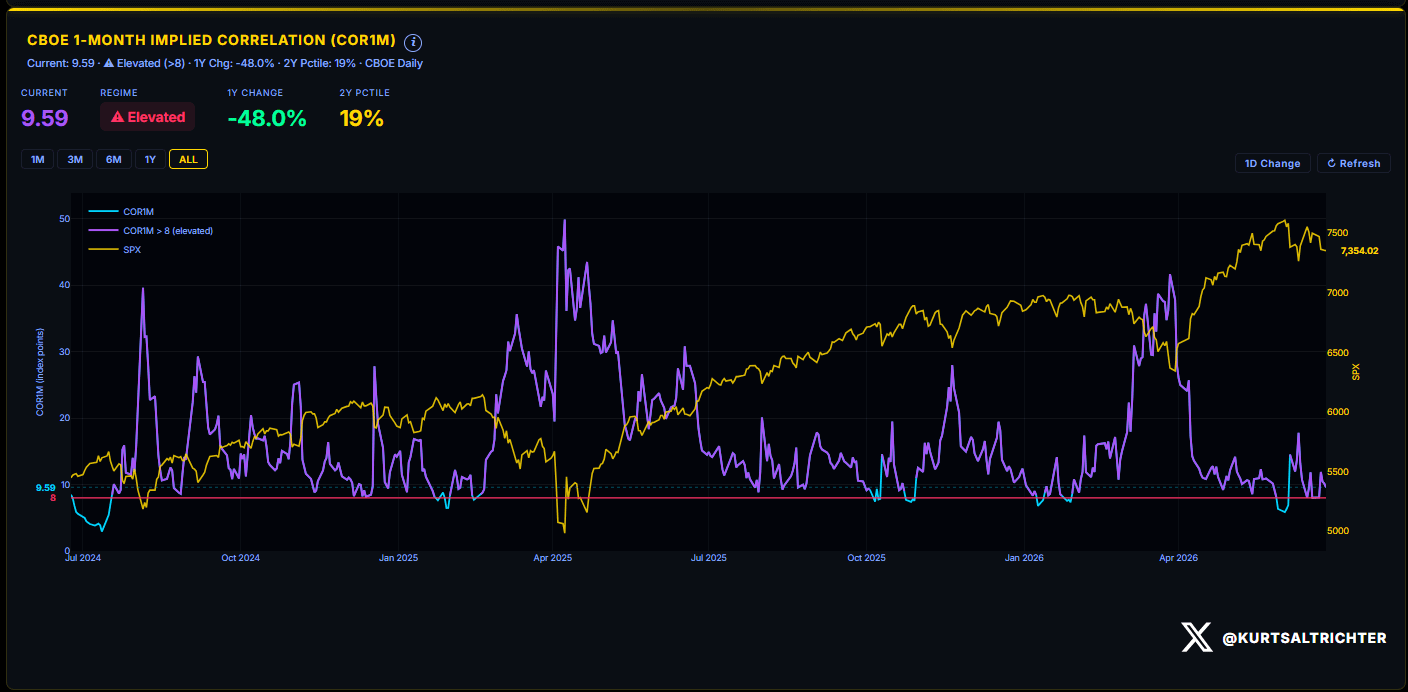
IMPLIED CORRELATION: THE DISPERSION SIGNAL
One-month implied correlation jumped back to 9.59, above the 8 line. This index measures how tightly S&P 500 stocks move together. Above 8, the herd trades as one and only index direction counts. Last week, it sat at 8.02 with names beginning to split. The selloff slammed that door shut. When the index drops, and correlation climbs together, that is everything getting dumped at once, not money picking winners and losers.
When the index drops, and correlation climbs together, that is everything getting dumped at once, not money picking winners and losers.
THE ECONOMIC CALENDAR AND VOL TERM STRUCTURE
Thursday, July 2, is the whole week. Nonfarm Payrolls, Average Hourly Earnings, and the Unemployment Rate all hit the same morning, with the options market pricing a ±1.74% move on that expiration. Payrolls land the day before a closed holiday Friday, into a tape already short gamma with nothing underneath it.
A hot wage number, into a Fed that just lifted its inflation forecast to 3.6%, is what forces the next leg down. Prior payrolls ran 172k. JOLTS on Tuesday sets the tone.
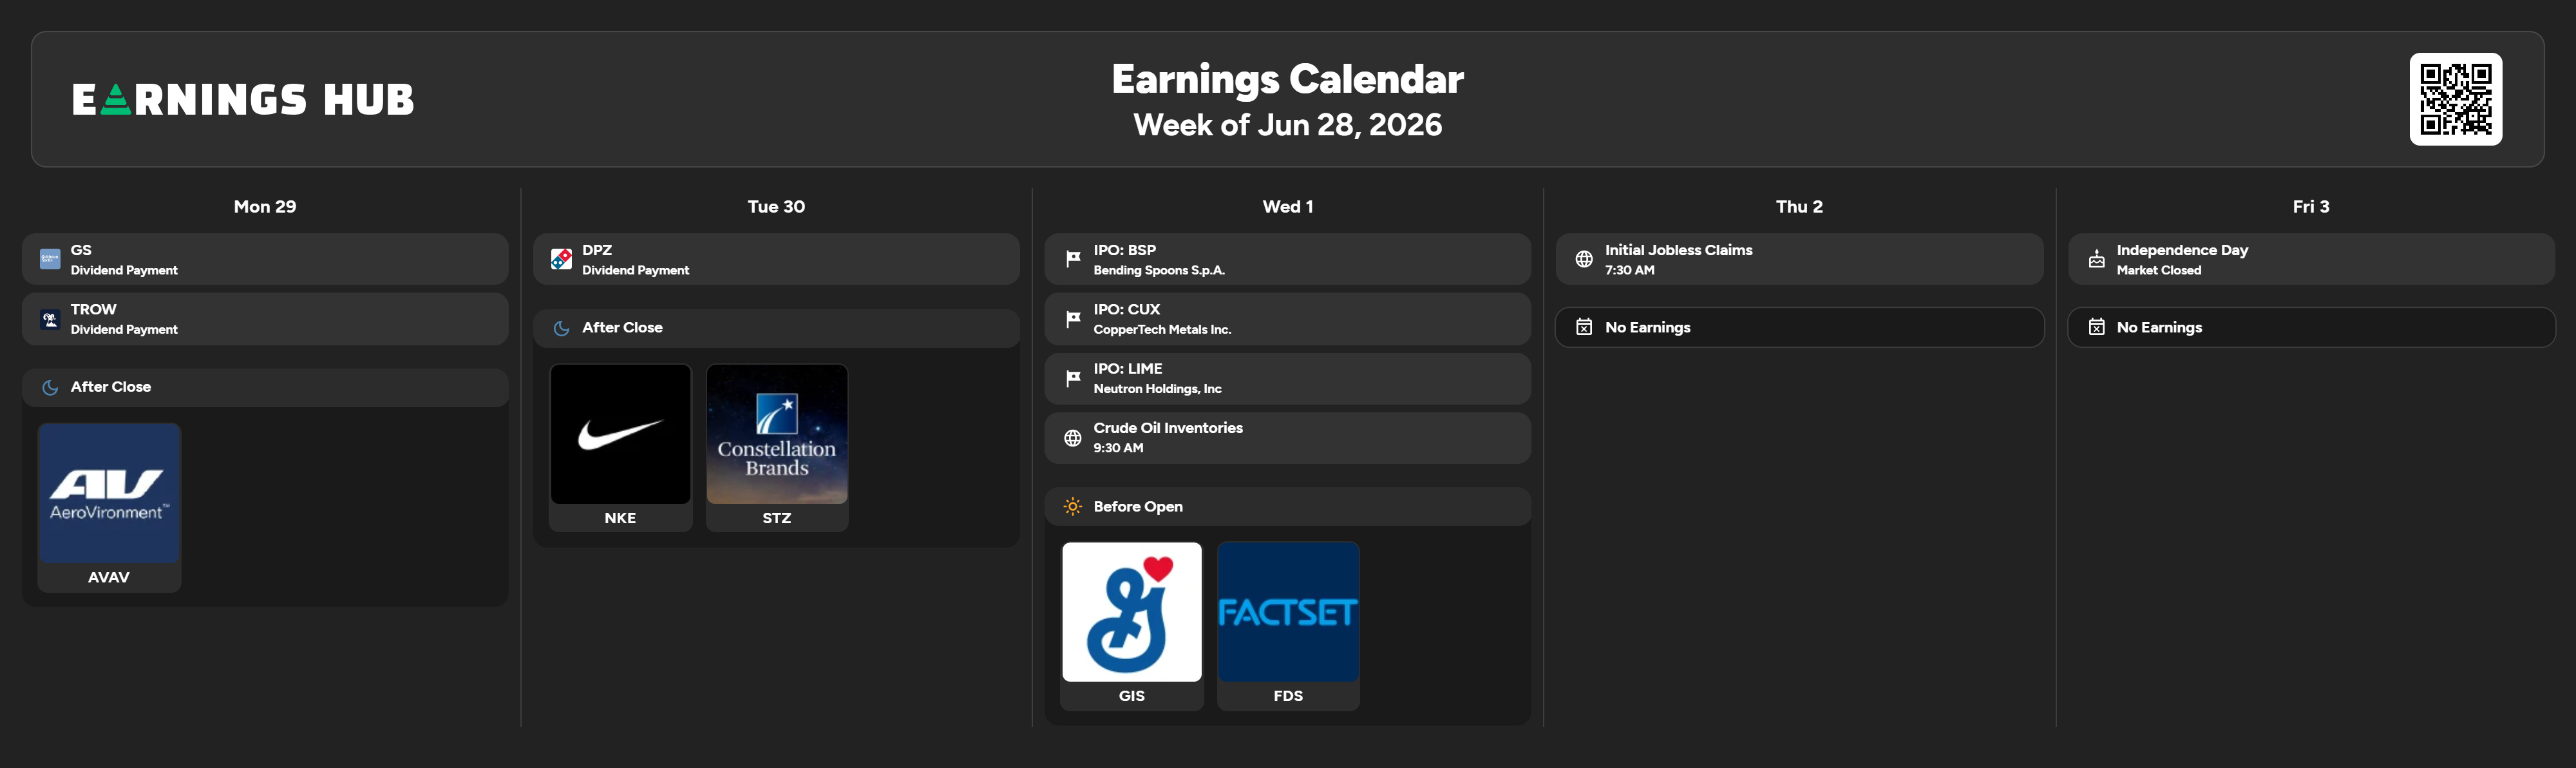
EARNINGS
Quiet, holiday-shortened week. Nike NKE 0.00%↑ and Constellation Brands STZ 0.00%↑ report Tuesday after the close, and Nike is the cleanest read on the consumer and China demand. General Mills GIS 0.00%↑ and FactSet FDS 0.00%↑ follow on Wednesday before the open. None of it will move the market. If the market moves on headlines, it will trade off payrolls and dealer positioning.
MOMENTUM PULSE CHECK
Leadership flipped to defense. Health Care XLV 0.00%↑ ran +7.8% on the week and jumped out of the Lagging corner into Improving. Real Estate XLRE 0.00%↑ added 4.0%. Technology XLK 0.00%↑ did the opposite, still up near 27% on the year but down 5.3% on the week and sliding deep into Weakening. The exact sector that drove this rally is the one breaking down now.
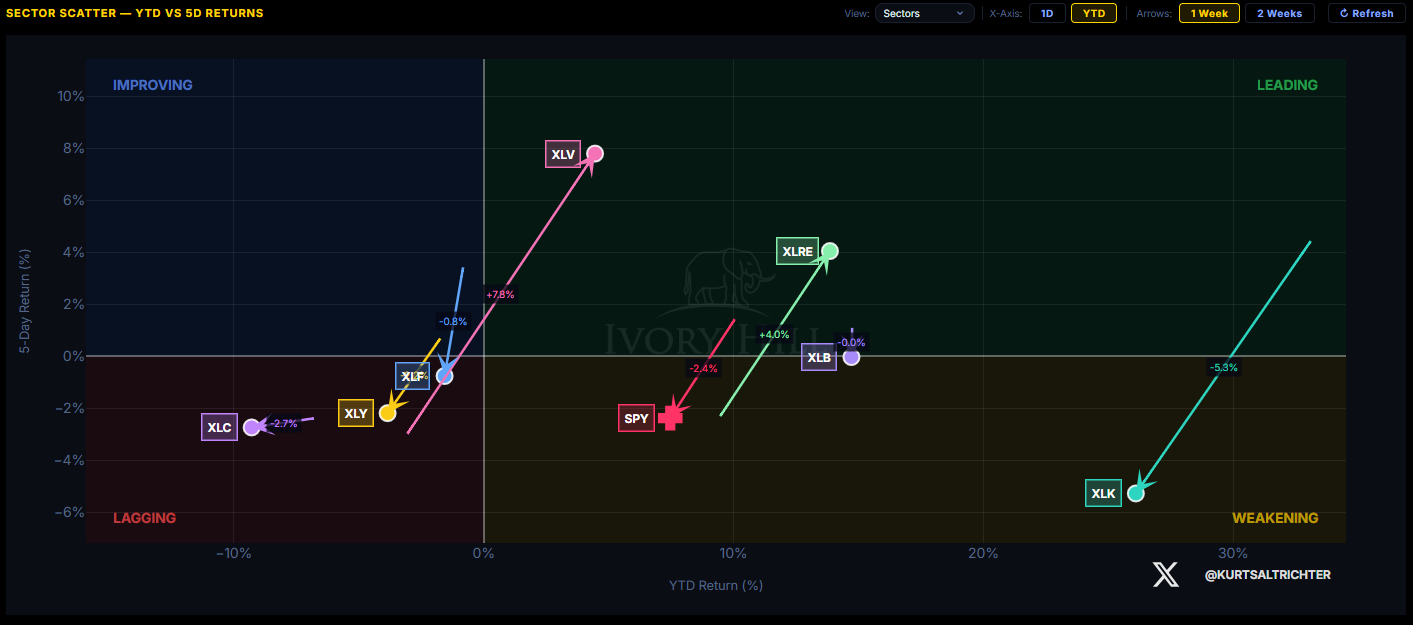
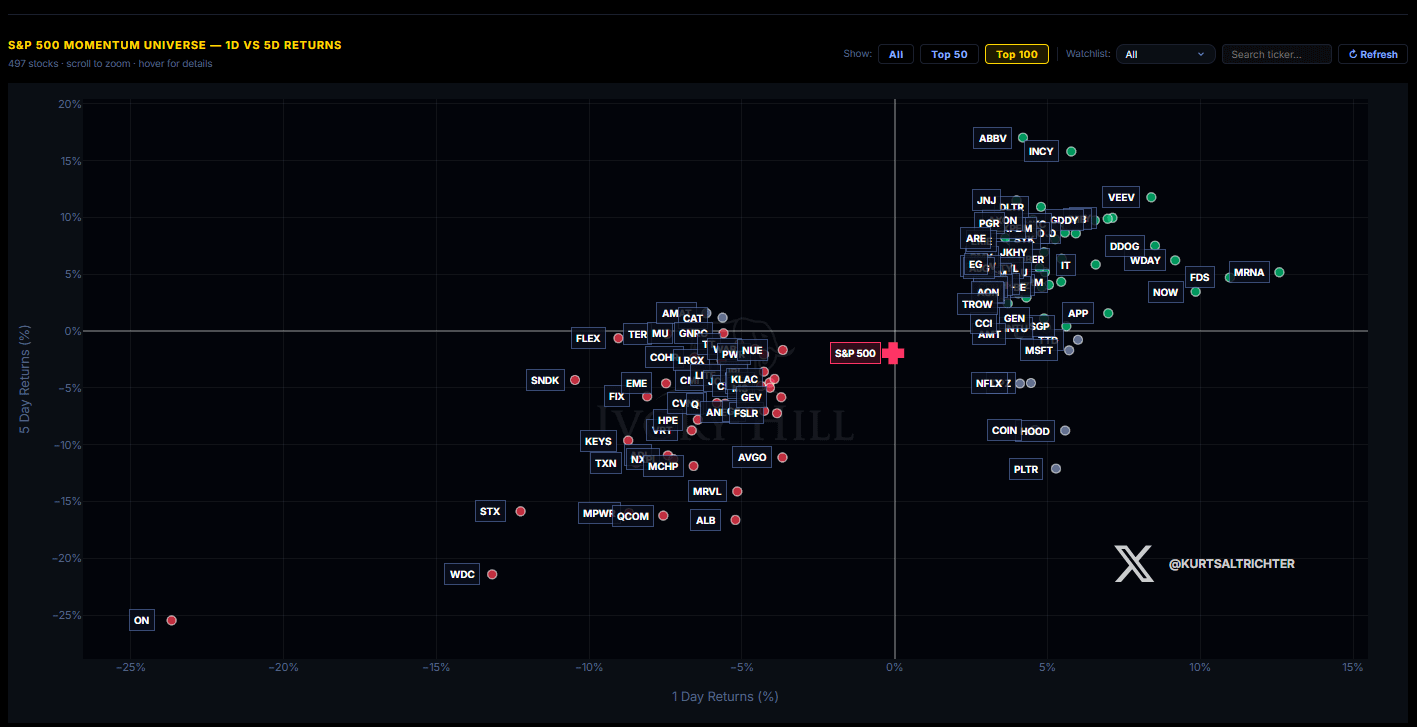
The pain is concentrated in the semis that led. ON Semiconductor is the single worst name on the screen, down roughly 23% on the day. Western Digital ran +40% the week before and handed all of it back, down 20% over five days. Marvell, Qualcomm, Texas Instruments, and Microchip are all double-digit losers on the week. The semiconductor complex I flagged as regaining leadership last week broke this week. Health Care owns the green side of the board, with AbbVie, Incyte, J&J, and Moderna all higher. Capital is rotating out of semis and into defensives, which is precisely the move you make when you expect more downside.
Capital is rotating out of semis and into defensives, which is precisely the move you make when you expect more downside.
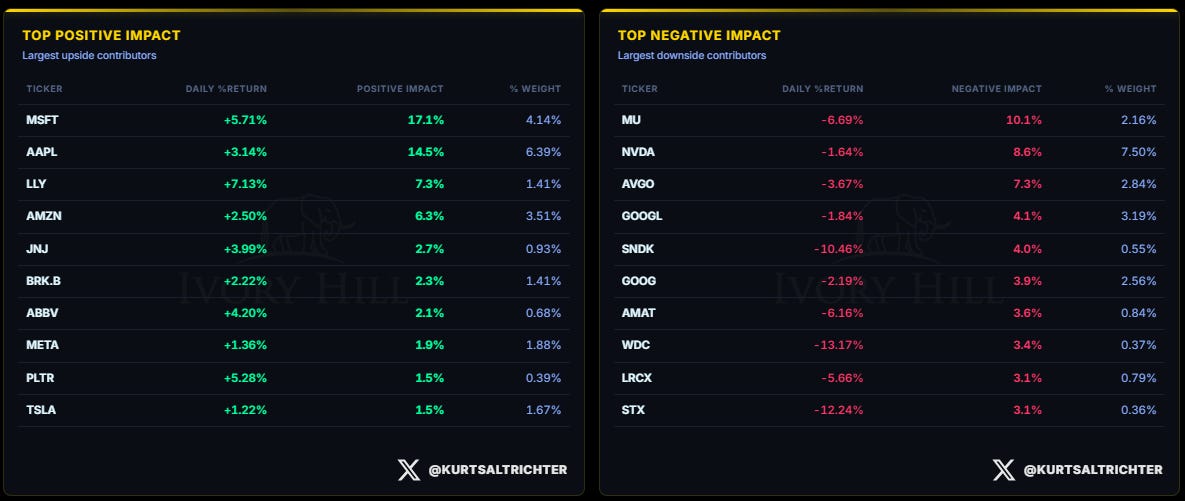
Here are the stocks with the most impact on Friday’s close.
MARKET STRUCTURE: THE ANCHOR POINT
Every rally into 7,450 now gets sold, and every dip gets sold harder.
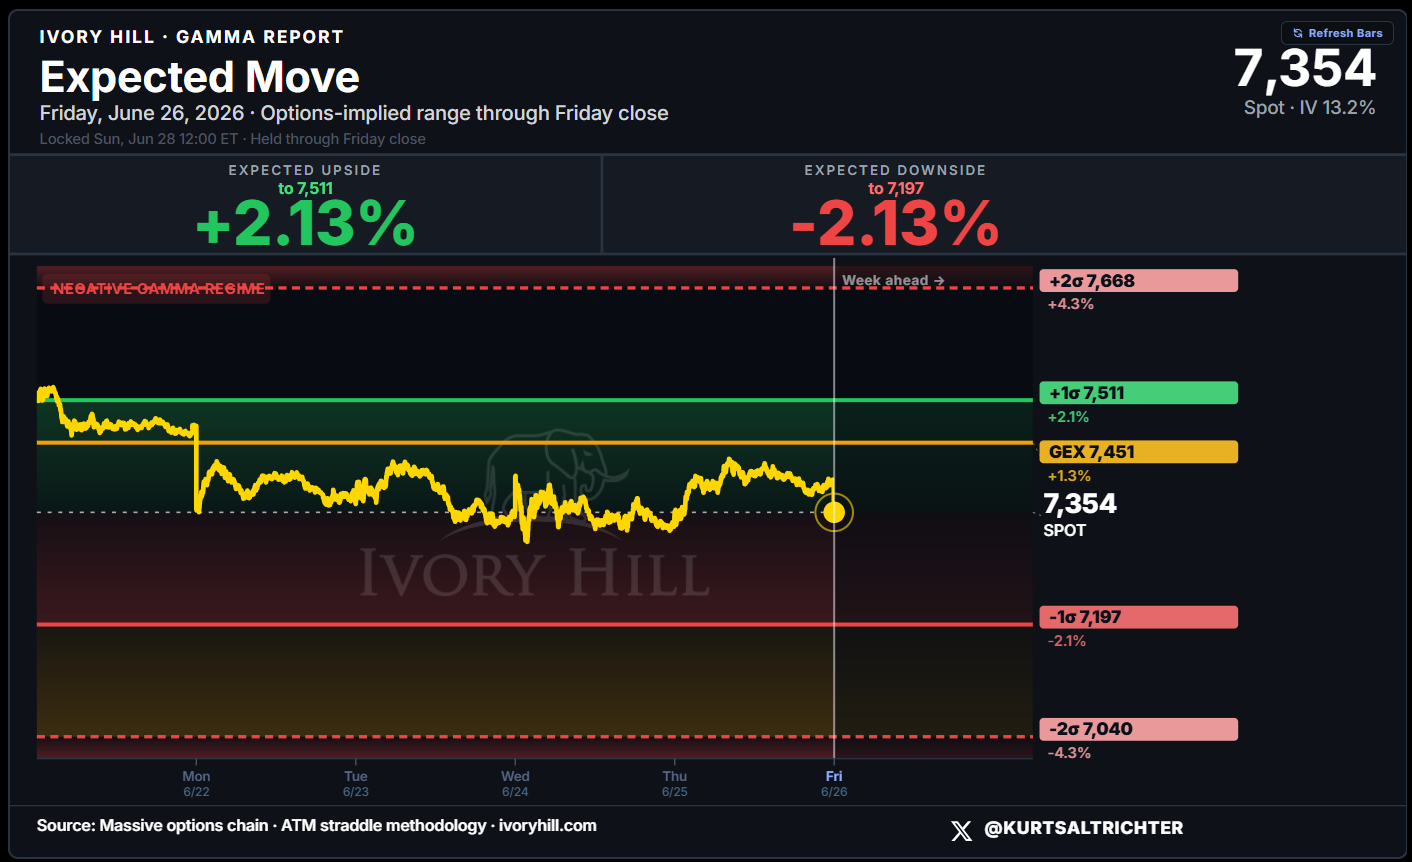
WEEKLY EXPECTED MOVE
The options market is pricing a symmetric range this week: +2.13% to 7,511 on the upside, -2.13% to 7,197 on the downside, with an outer floor at 7,040. GEX sits at 7,450.
We have a lower low in the expected move. For three straight weeks, the floor moved higher: 7,243, then 7,286, then 7,326. Each week, the market refused to price a lower low, and I read that rising floor as support holding underneath the tape.
Here is why this matters: below is the expected move from last week’s report. The market used it as a clear area of support for the entire week.
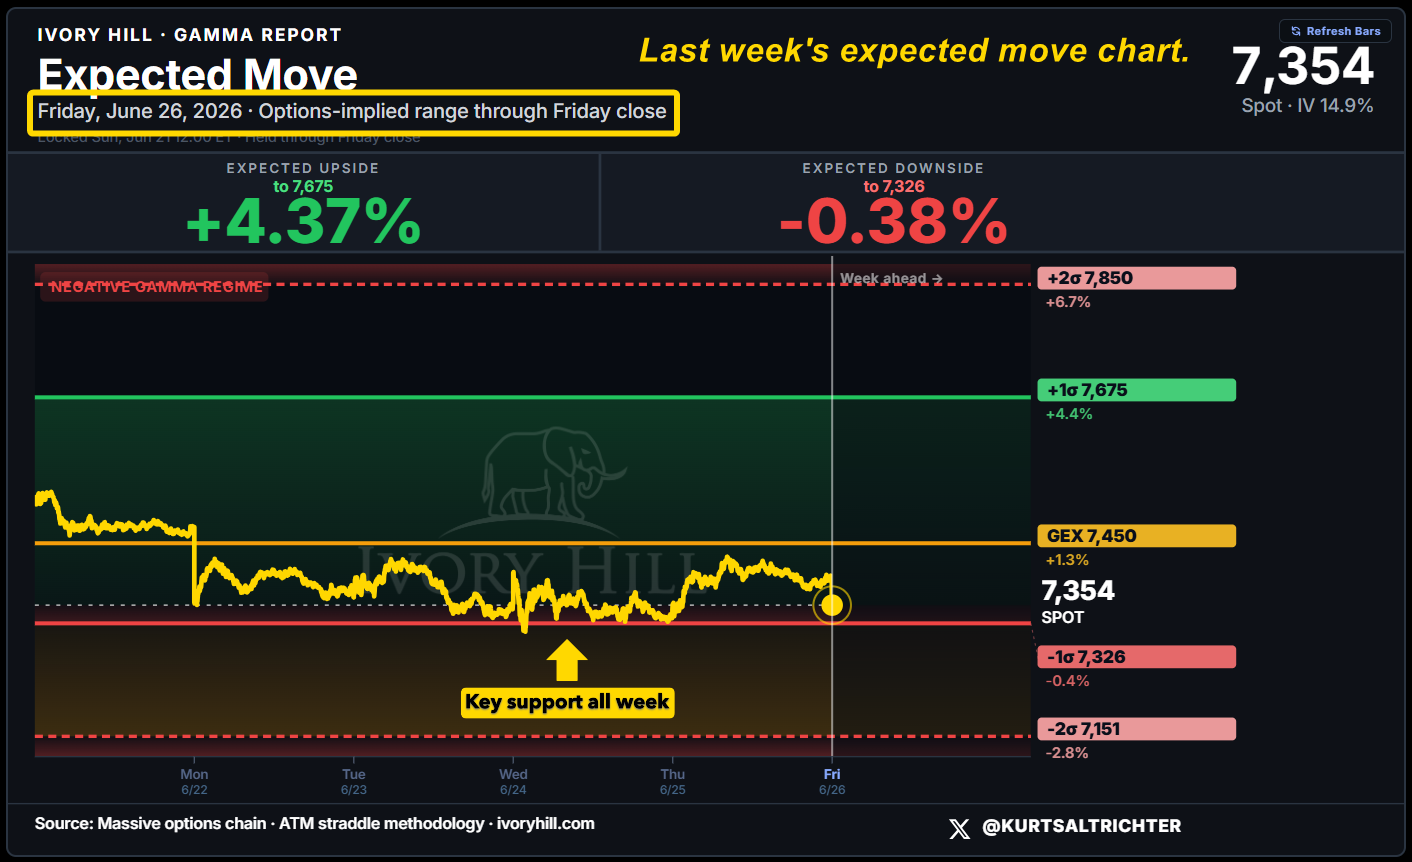
This week, it broke. The band reset to 7,197, 129 points below last week’s 7,326, the first lower low in over a month. The range also turned symmetric after weeks of leaning to the upside, which is the options market pricing a drop as the equal risk. First resistance is the flip at 7,450. Lose 7,197 and 7,040 is next.
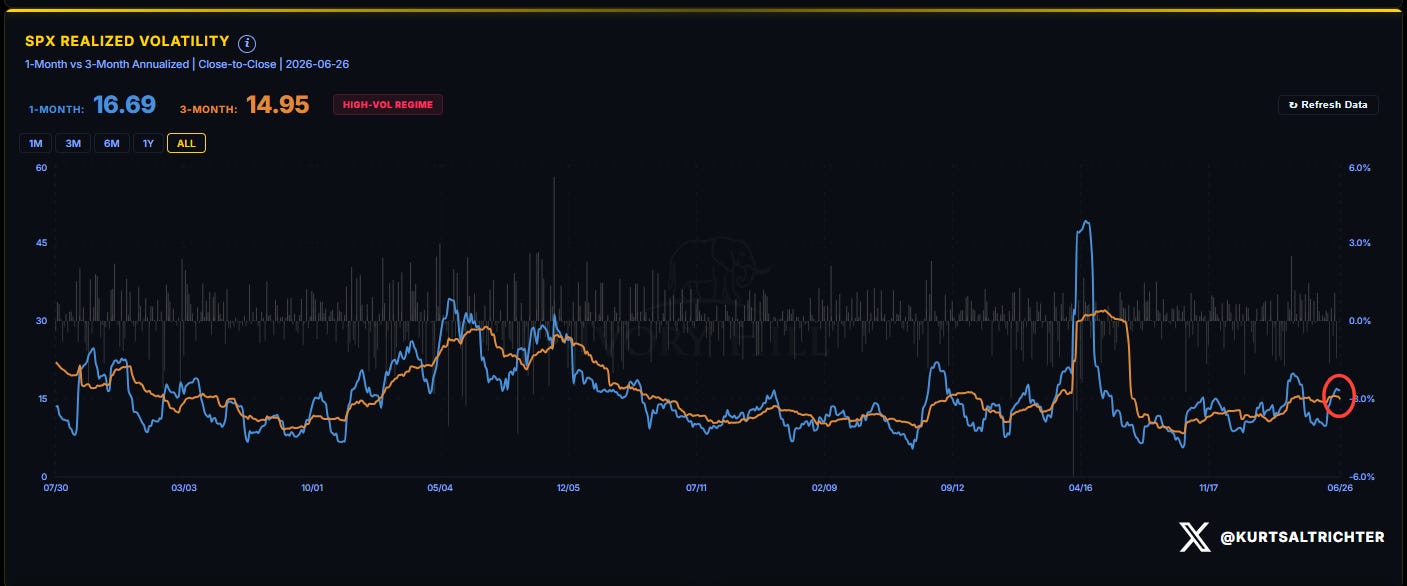
VOLATILITY REGIME
One-month realized vol is running above three-month realized vol, a high-vol regime in inversion, which means the tape has moved more violently over the past month than over the past quarter. This was the only signal arguing against last week’s bounce, and it was right. Now that the price is under the flip line, realized vol and gamma point in the same direction for the first time in weeks.
SYSTEMATIC FUND FLOWS
Both systematic cohorts are selling, and they are selling in the same direction. CTAs printed short on six of the last seven sessions as the trend rolled over with the lost flip line. Vol-control funds dumped $10.8 billion over ten days, the largest single-day sell landing on June 23, the Monday, the flip line was violated. These funds cut exposure as volatility rises, and with realized vol still elevated, they keep selling until it falls. That removes the mechanical buyer that supported the entire spring rally.
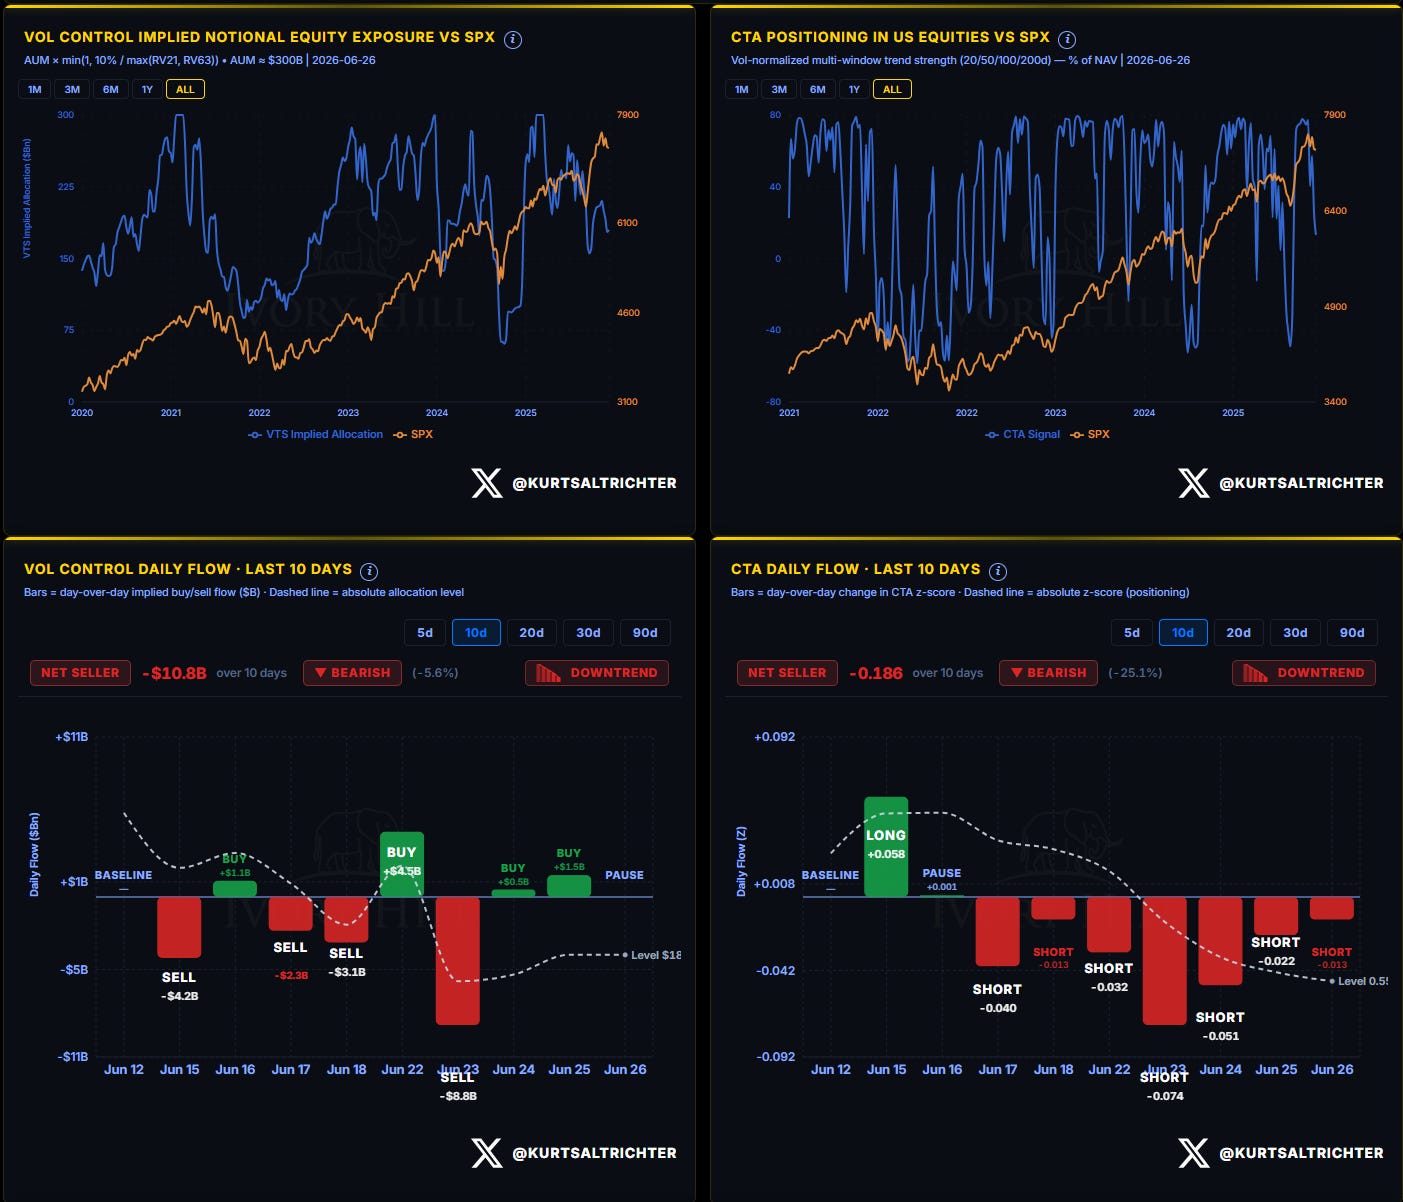
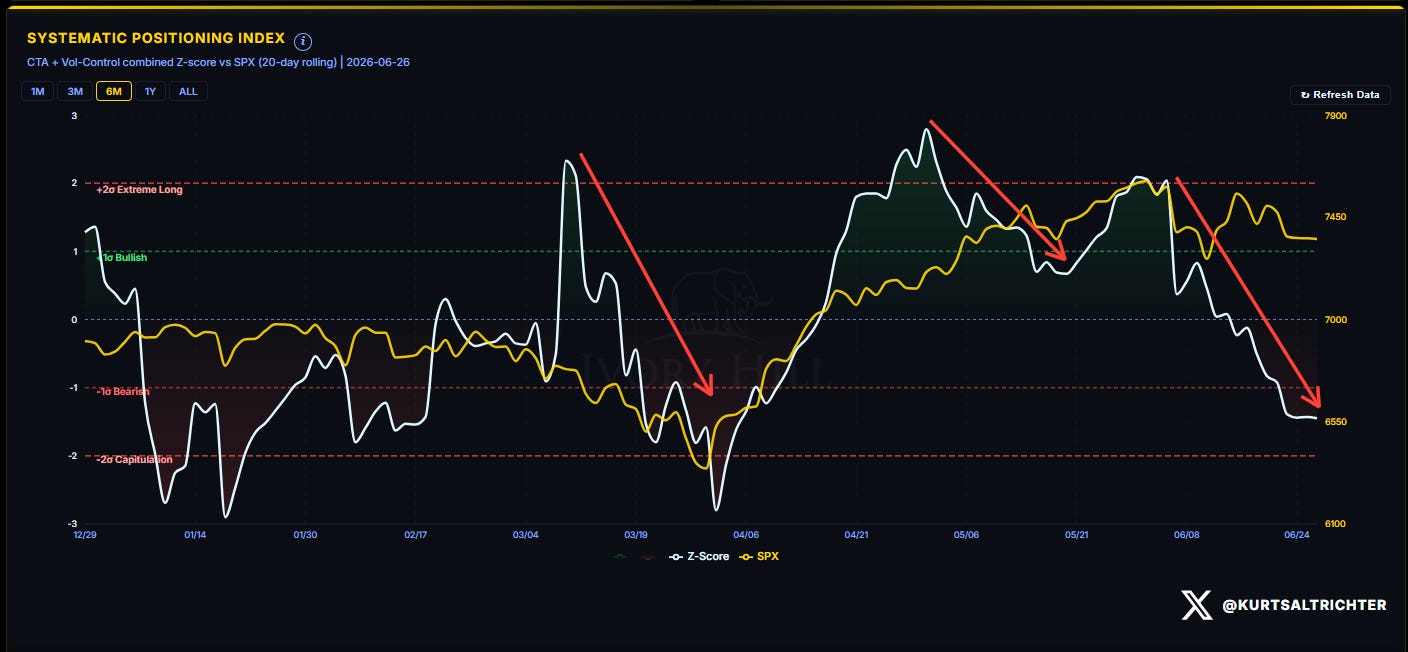
SYSTEMATIC POSITIONING INDEX
The combined positioning score fell to roughly -1.3, below the -1σ Bearish line, after running near +2σ Extreme Long in mid-May. The crowded long is getting fully unwound and has flipped to a net short. That cuts both ways. The forced selling that drove the unwind is getting close to over with, but the crowd is now positioned short heading into payrolls, so a soft number gives these funds room to cover and squeeze the tape higher.
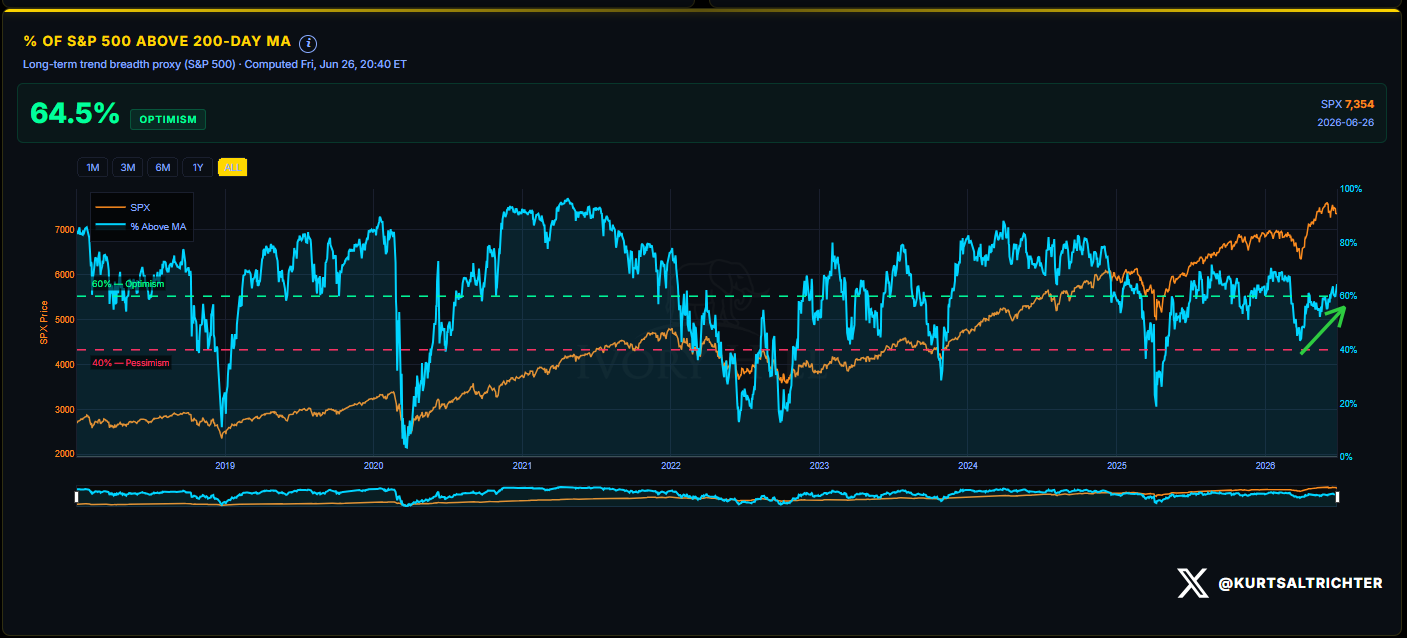
MARKET BREADTH
64.5% of the S&P 500 trades above its 200-day average, up from 60.4% last week, still in Optimism. Breadth climbed while the index fell, which tells you the selling never left semiconductors and never reached the average stock. The level that signals a true regime breakdown is 40%, and we are nowhere close. As long as breadth holds, this is a rotation and a positioning unwind, not a top.
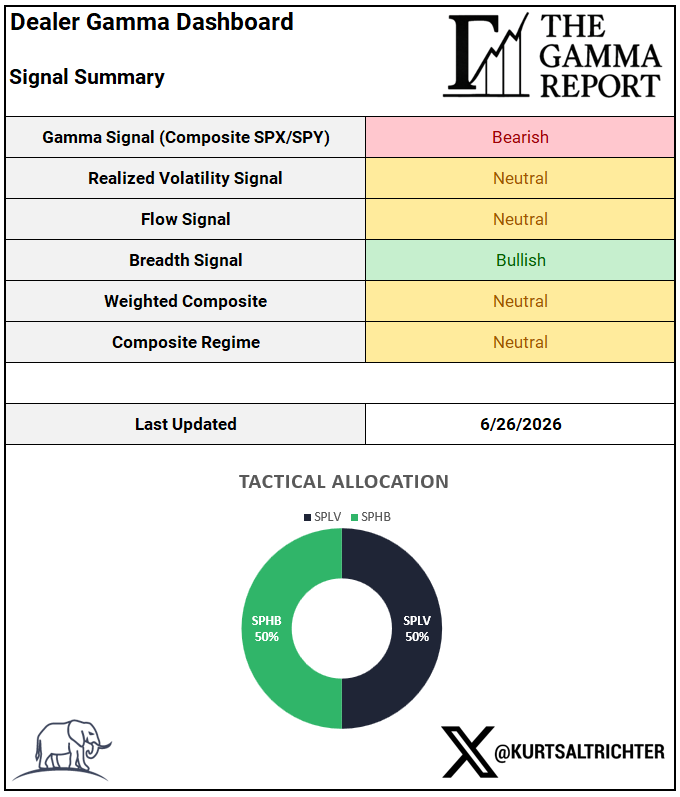
DEALER GAMMA DASHBOARD AND COMPOSITE REGIME
Gamma flipped to Bearish, Flow and Realized Vol are Neutral, Breadth is Bullish. The composite prints Neutral, with breadth strength offsetting the gamma break instead of overriding it. Last week the model ran fully offensive at 75% SPHB and 25% SPXL. It pulled the leveraged SPXL sleeve and rebalanced to 50% SPLV and 50% SPHB the moment price lost the flip. It turns defensive on a sustained break below 7,197 or if breadth rolls under 40%, and turns back offensive on a close back above 7,450 that holds.
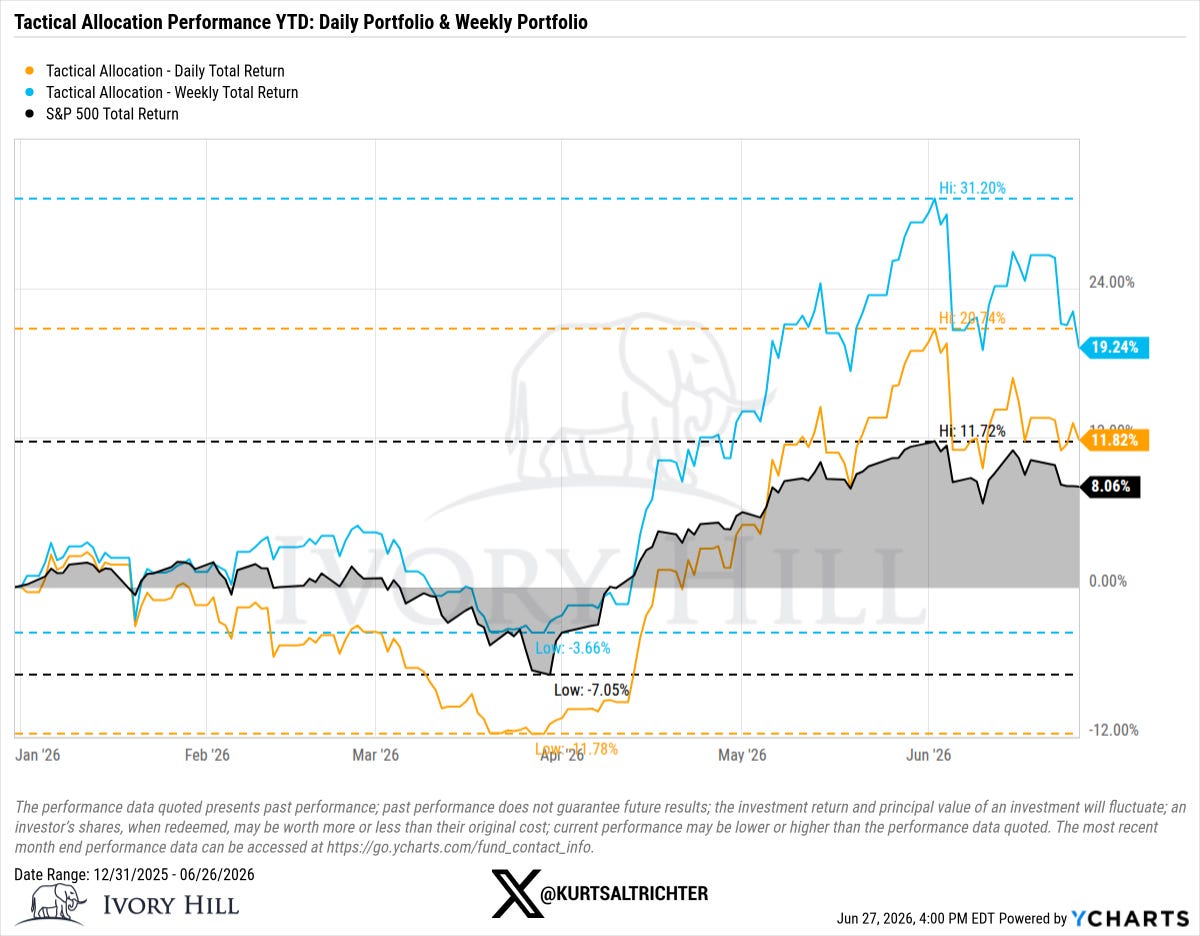
TACTICAL ALLOCATION PERFORMANCE
Weekly portfolio 19.24% on the year, daily portfolio 11.82%, S&P 500 8.06%. The weekly strategy proxy gave back ground from its 31.20% high and still beats the index by more than eleven points.
The flip at 7,450 is a ceiling, the downside floor just reset 129 points lower, and systematics are selling into it. Breadth at 64.5% is the only thing keeping this a rotation instead of a top. Thursday’s payrolls, dropping into a short-gamma tape thinned out by the holiday, decides the next 200 points. A soft print and the shorts cover back toward 7,450. A hot print and 7,197 breaks fast, with 7,040 underneath. Watch the flip and watch the floor.
And remember - The one fact pertaining to all conditions is that they will change.
Feel free to use me as a sounding board.
Follow me on X for more updates.
Best regards,
Schedule a call with me by clicking HERE
Kurt S. Altrichter, CRPS®
Wealth Advisor | President
Disclosure
The Gamma Report is published by Ivory Hill, LLC. All opinions and views expressed in this report reflect our analysis as of the date of publication and are subject to change without notice. The information contained herein is for informational and educational purposes only and should not be considered specific investment advice or a recommendation to buy or sell any security.
The data, models, and tactical allocations discussed in this report are designed to illustrate market structure and positioning trends and may differ from portfolio decisions made by Ivory Hill, LLC or its affiliates. Investing involves risk, including the possible loss of principal. Past performance is not indicative of future results.
Ivory Hill, LLC, and its members, officers, directors, and employees expressly disclaim any and all liability for actions taken based on the information contained in this report.