

The S&P 500 closed Friday at 7,383.74, down 2.64% on the day and down 2.59% on the week. NFP was the catalyst. Last week I wrote that a close below 7,458 flips the regime and that Friday’s payroll print could be the live test. It was. The model moved to neutral for the first time in eight weeks.
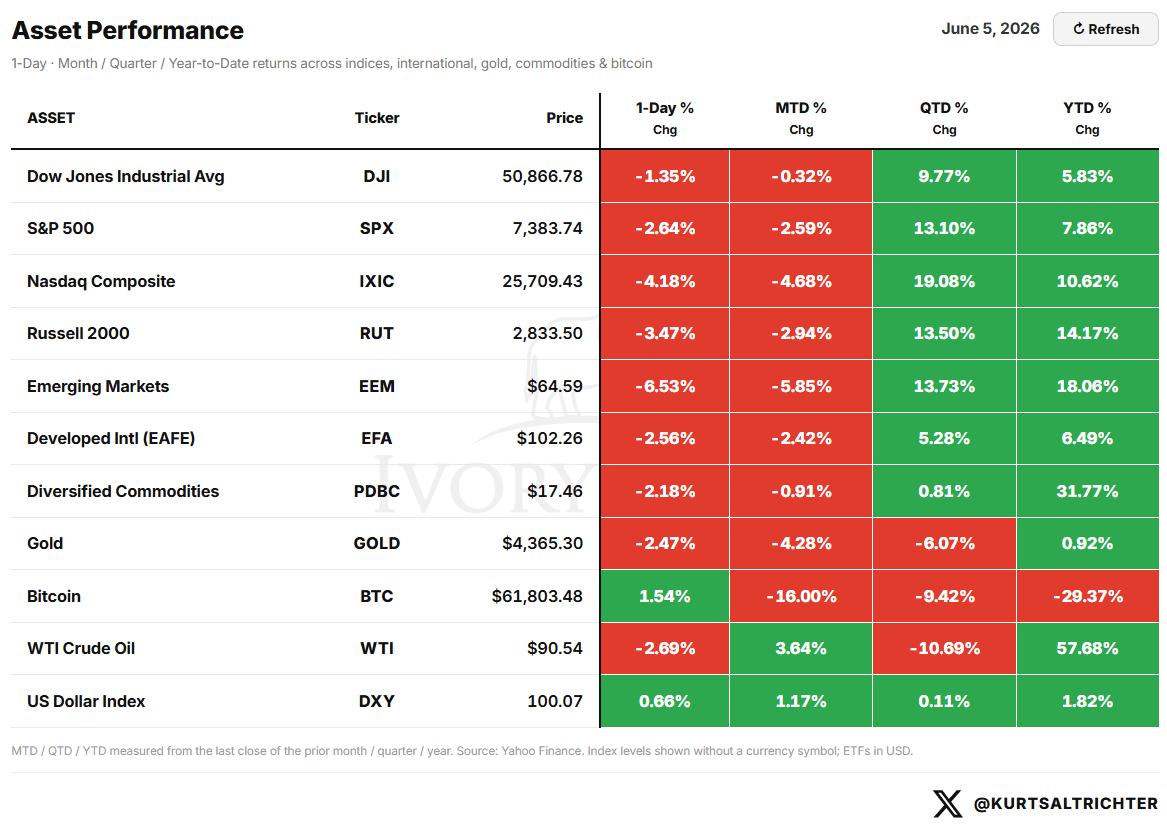
One up day belonged to Bitcoin, up 1.54% on Friday, while everything else sold off. Nasdaq took the worst of it, down 4.18% on the day. Emerging Markets dropped 6.53%. Russell 2000 off 3.47%. The S&P 500 lost 2.64%. WTI Crude is still the year’s standout at +57.68% YTD. Gold gave back 2.47% on the day but remains slightly positive for the year. Friday’s price action was risk-off, the first sign that something is breaking under the surface.
IMPLIED CORRELATION: THE DISPERSION SIGNAL
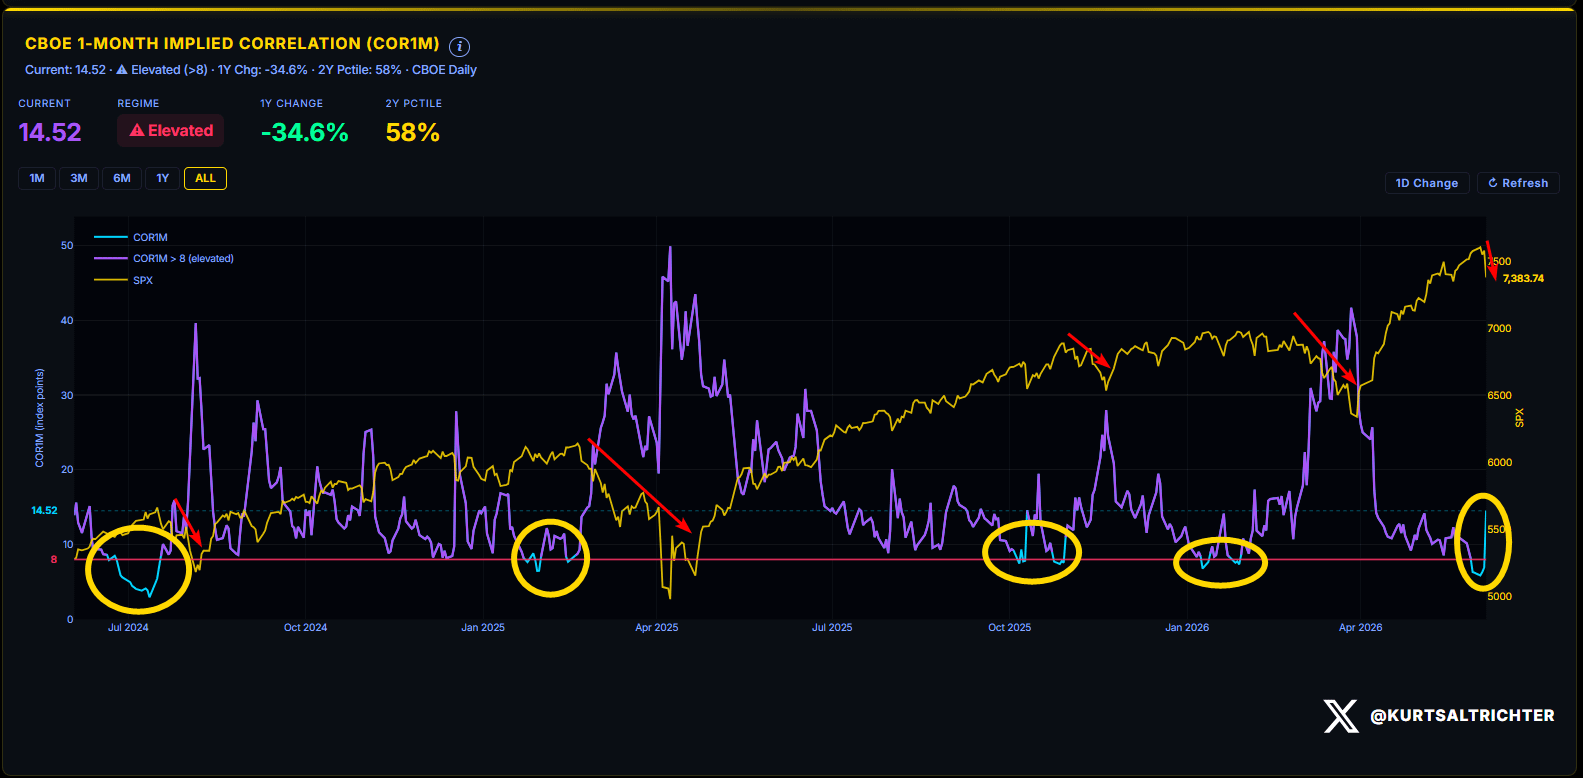
COR1M is at 14.52. Regime: Elevated. Down 34.6% year over year but sitting at the 58th percentile of the two-year range. One week ago, this chart was at 6.33 in the 3rd percentile. It more than doubled into Friday’s selloff.
Last week, I wrote that the signal to worry about is not low correlation; it is when the purple line starts moving back toward 8 with a high rate of change, because that means a macro surprise is about to override fundamentals. NFP was the macro surprise. Correlation broke 8 to the upside and kept going. Stocks stopped trading on their own and started moving together.
When correlation rises this quickly, the dispersion that protects the tape disappears.
The stock-picker’s market ended on Friday. For now, this is a macro tape.
THE ECONOMIC EVENT CALENDAR AND VOL TERM STRUCTURE
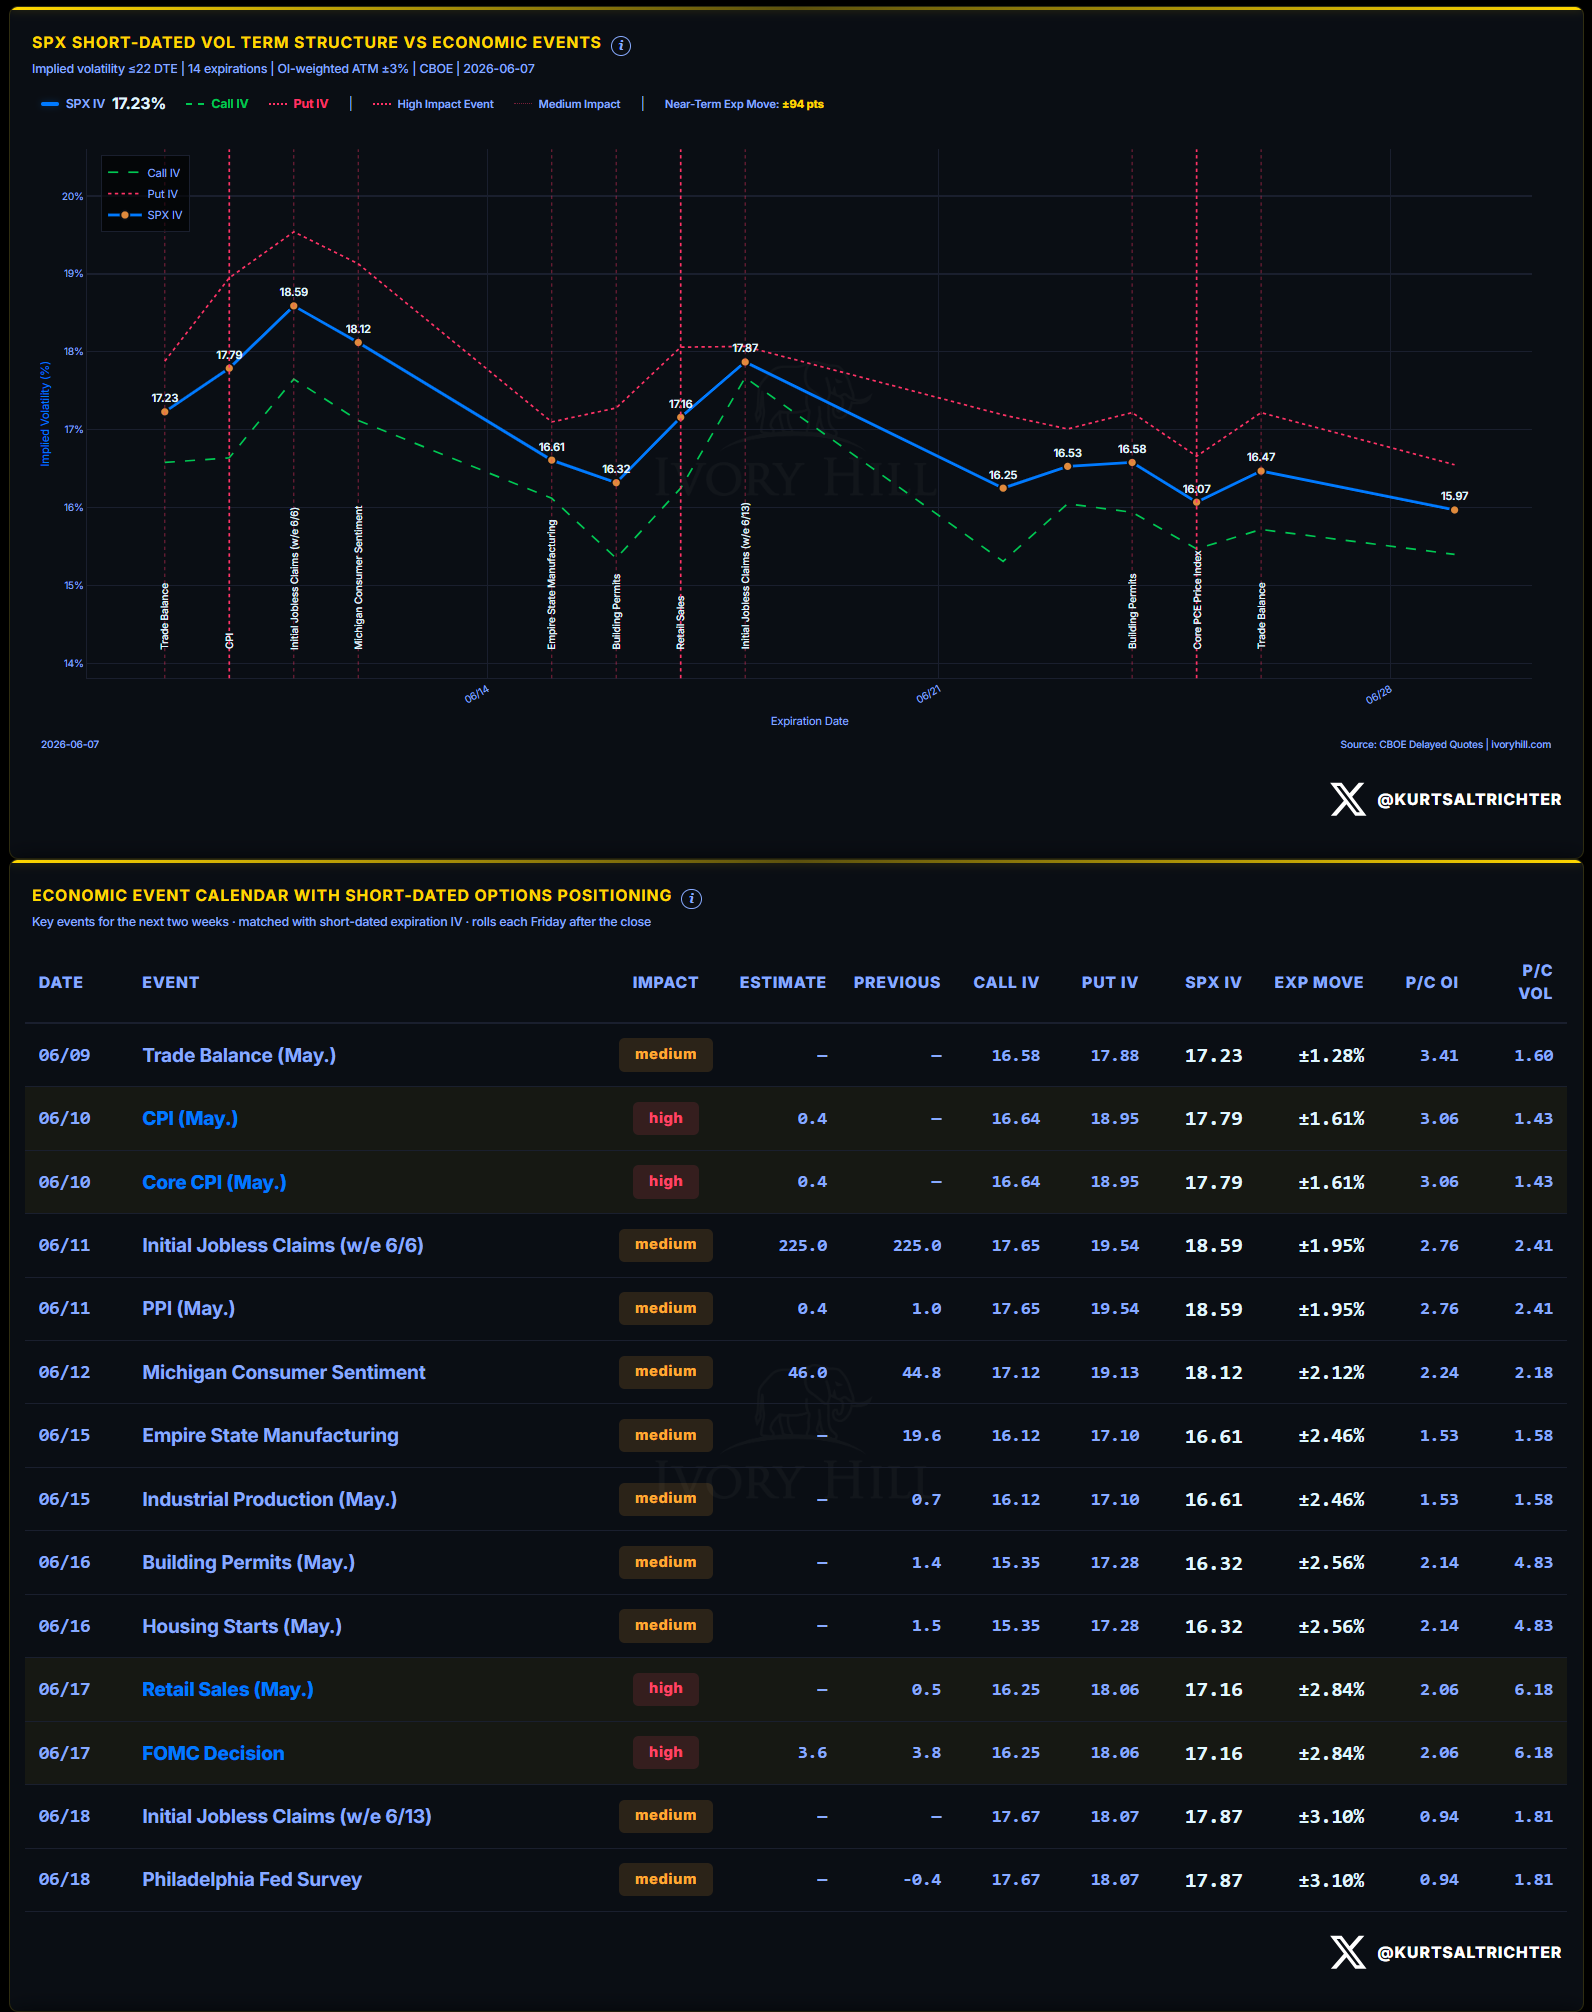
SPX IV at the front expiration is 17.23. The term structure slopes higher across the curve, with the heaviest premium sitting on Wednesday’s CPI and the 6/11 jobless claims and PPI cluster. The near-term expected move is ±94 points. The market is no longer treating this week as quiet.
Tuesday, June 9: Trade Balance for May, medium impact. SPX IV at this expiration is 17.23, implying ±1.28%.
Wednesday, June 10: CPI for May, estimated at 0.4% month-over-month, high impact. Core CPI estimated at 0.4%, high impact. SPX IV is 17.79, implying ±1.61%. NFP already did its damage. CPI is the second leg. I expect headline CPI to print north of 4%.
Thursday, June 11: Initial Jobless Claims for the week ending 6/6, estimated 225K versus a prior of 225K, medium impact. PPI for May is estimated at 0.4% versus a prior of 1.0%, medium impact. SPX IV is implying a ±1.95% move. This is the highest single-expiration IV reading on the near-term curve.
Friday, June 12: Michigan Consumer Sentiment, estimated at 46.0 versus a prior of 44.8, medium impact. SPX IV is 18.12, implying ±2.12%.
EARNINGS
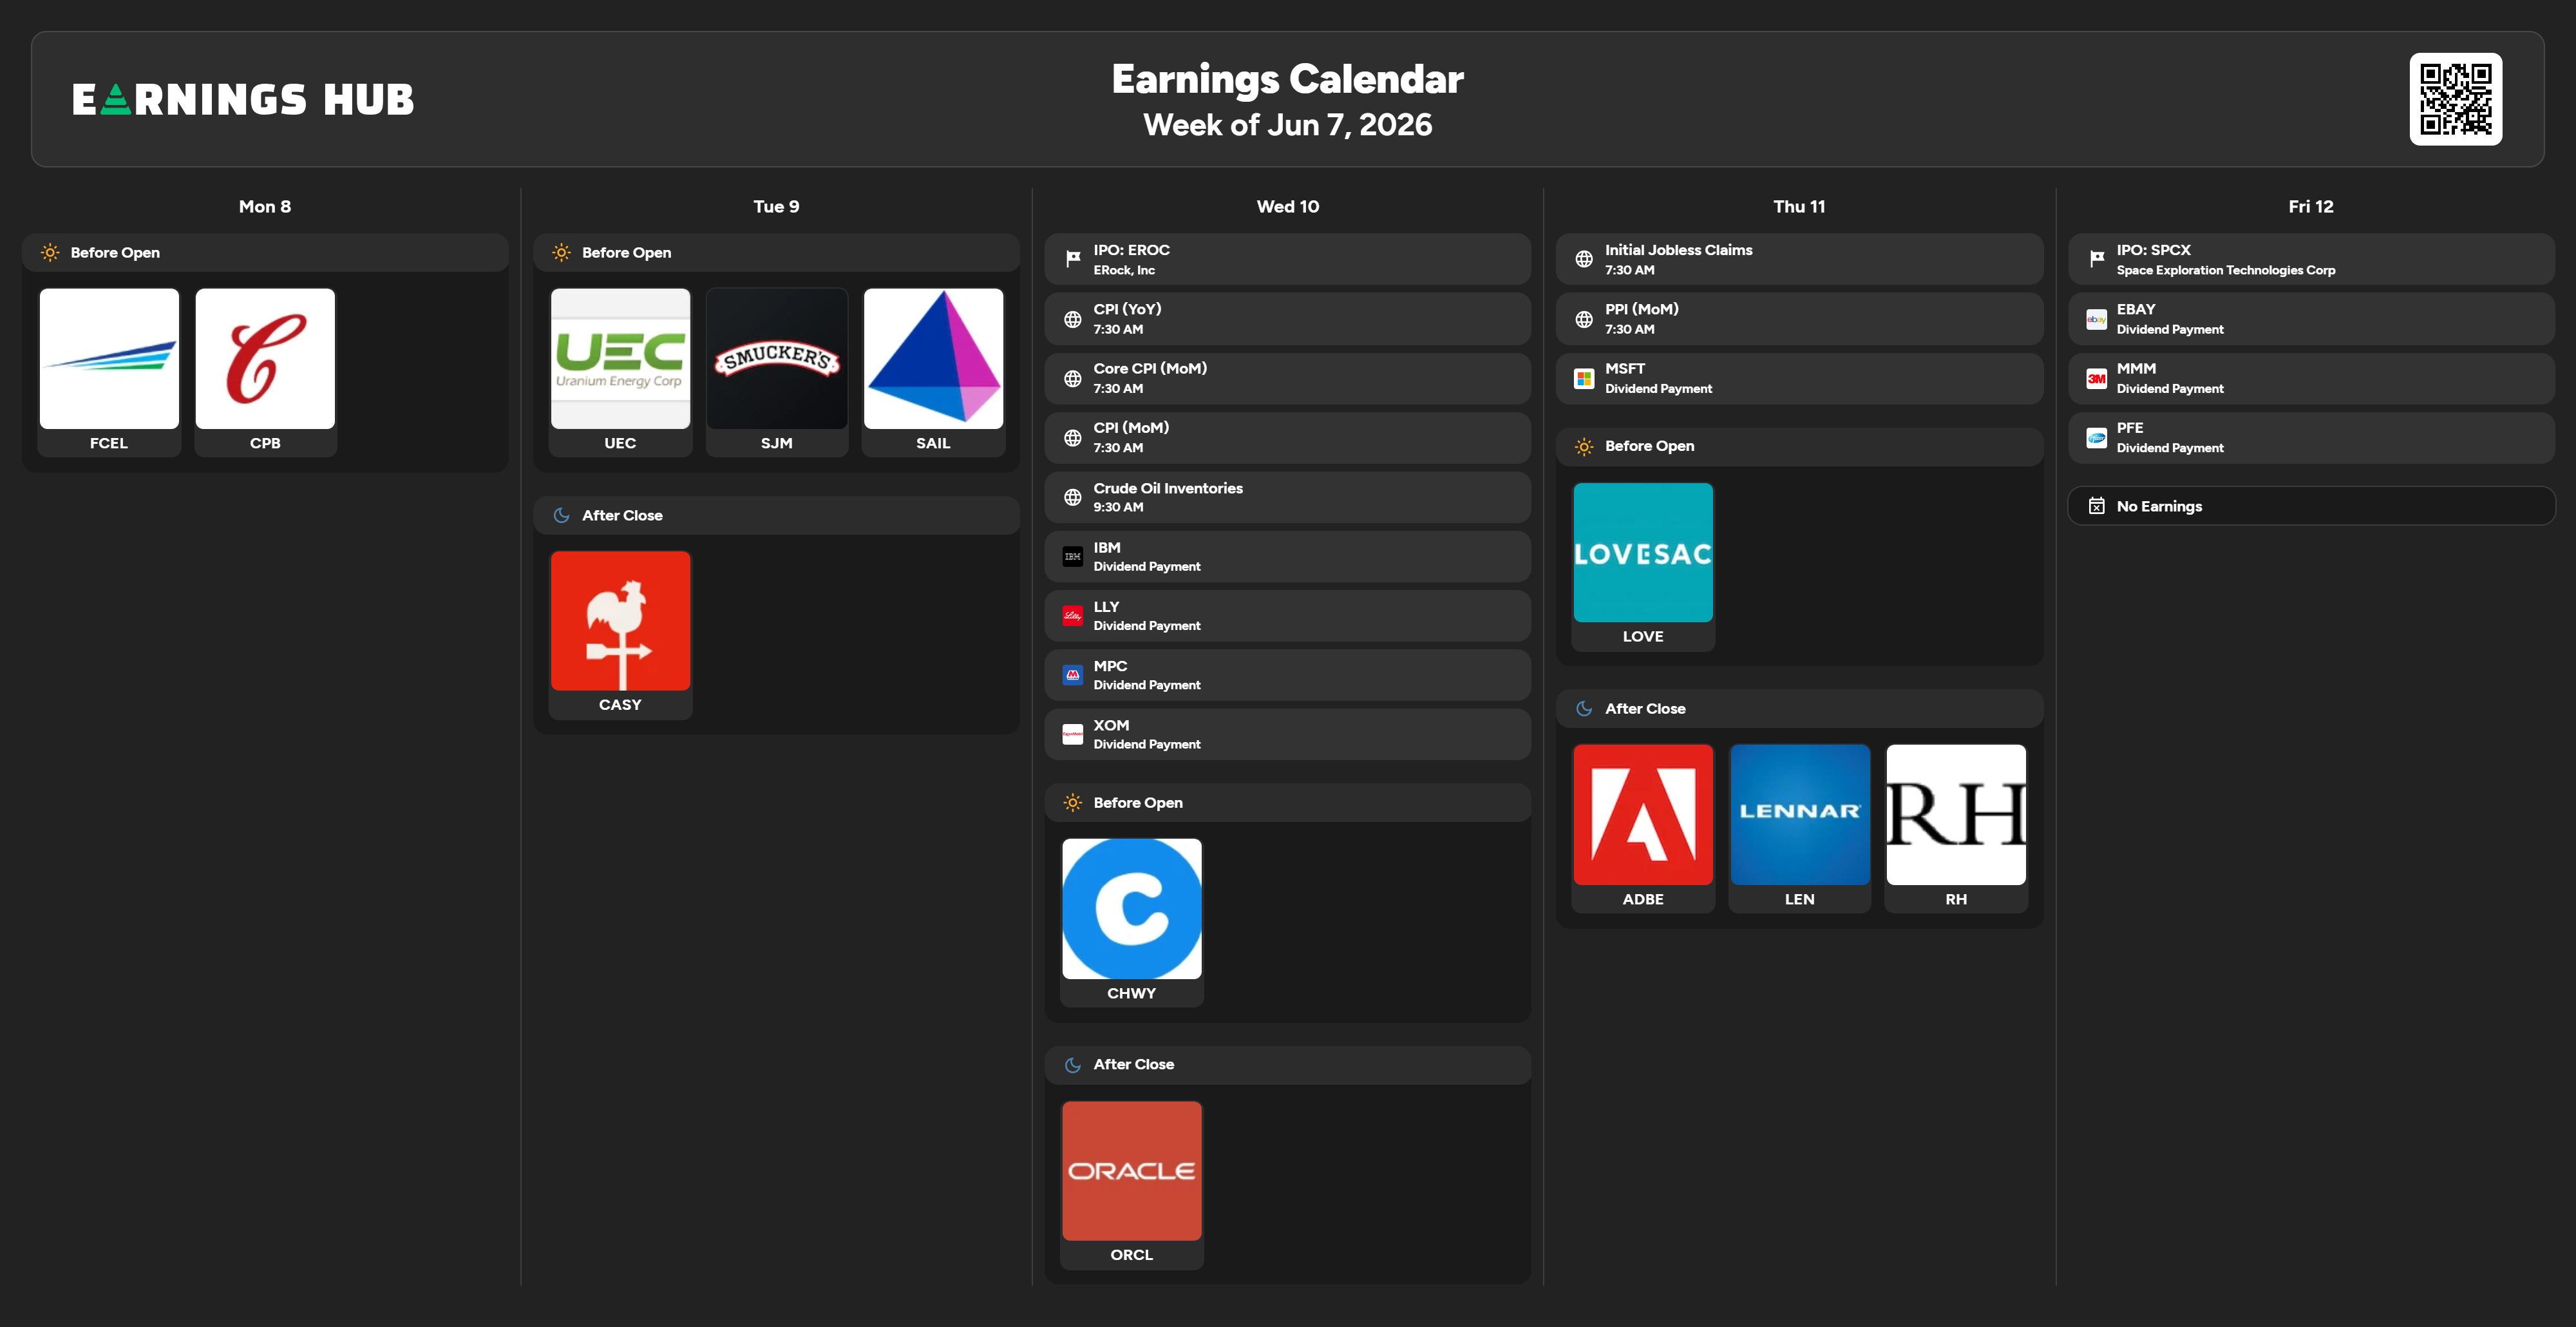
A light week with SpaceX IPO on Friday.
Monday, June 8: FuelCell Energy (FCEL) and Campbell’s (CPB) before the open.
Tuesday, June 9: Uranium Energy (UEC), J.M. Smucker (SJM), and SailPoint (SAIL) before the open. After the close: Casey’s General Stores (CASY).
Wednesday, June 10: Chewy (CHWY) before the open. After the close: Oracle (ORCL).
ORCL 0.00%↑ is the print to watch this week. Oracle’s cloud and AI infrastructure backlog has been one of the cleaner reads on hyperscaler capacity demand. It reports into a tape that just turned macro-correlated, which means the reaction gets amplified by the regime. A miss in this environment does not stay isolated to Oracle.
Thursday, June 11: Lovesac (LOVE) before the open. After the close: Adobe (ADBE), Lennar (LEN), and RH (RH).
ADBE 0.00%↑ is the software read of the week. Lennar and RH together are a direct line into housing demand and the high-end discretionary consumer heading into FOMC week.
Friday, June 12: No earnings. SpaceX IPO.
MOMENTUM PULSE CHECK
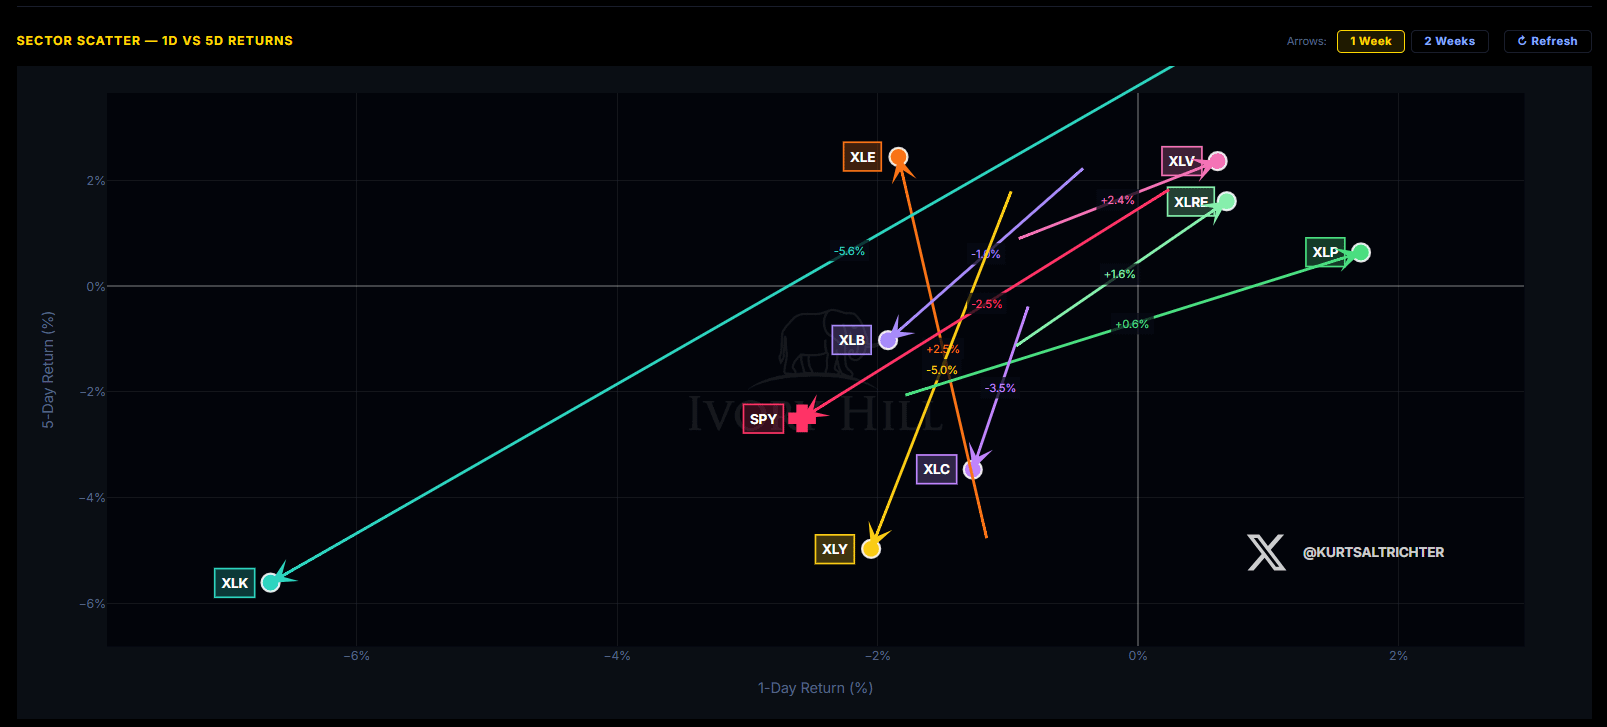
Technology (XLK) was the worst sector on the board, down roughly 6.7% on the day and 5.6% over five days, sitting alone in the bottom-left corner. One week ago, XLK was the lone sector in the upper-right quadrant, the leadership name reclaiming the tape at all-time highs. This week it is the single worst performer on both axes. That is the full round-trip of leadership in five sessions, and it is the cleanest picture of what a correlation spike does to a concentrated tape.
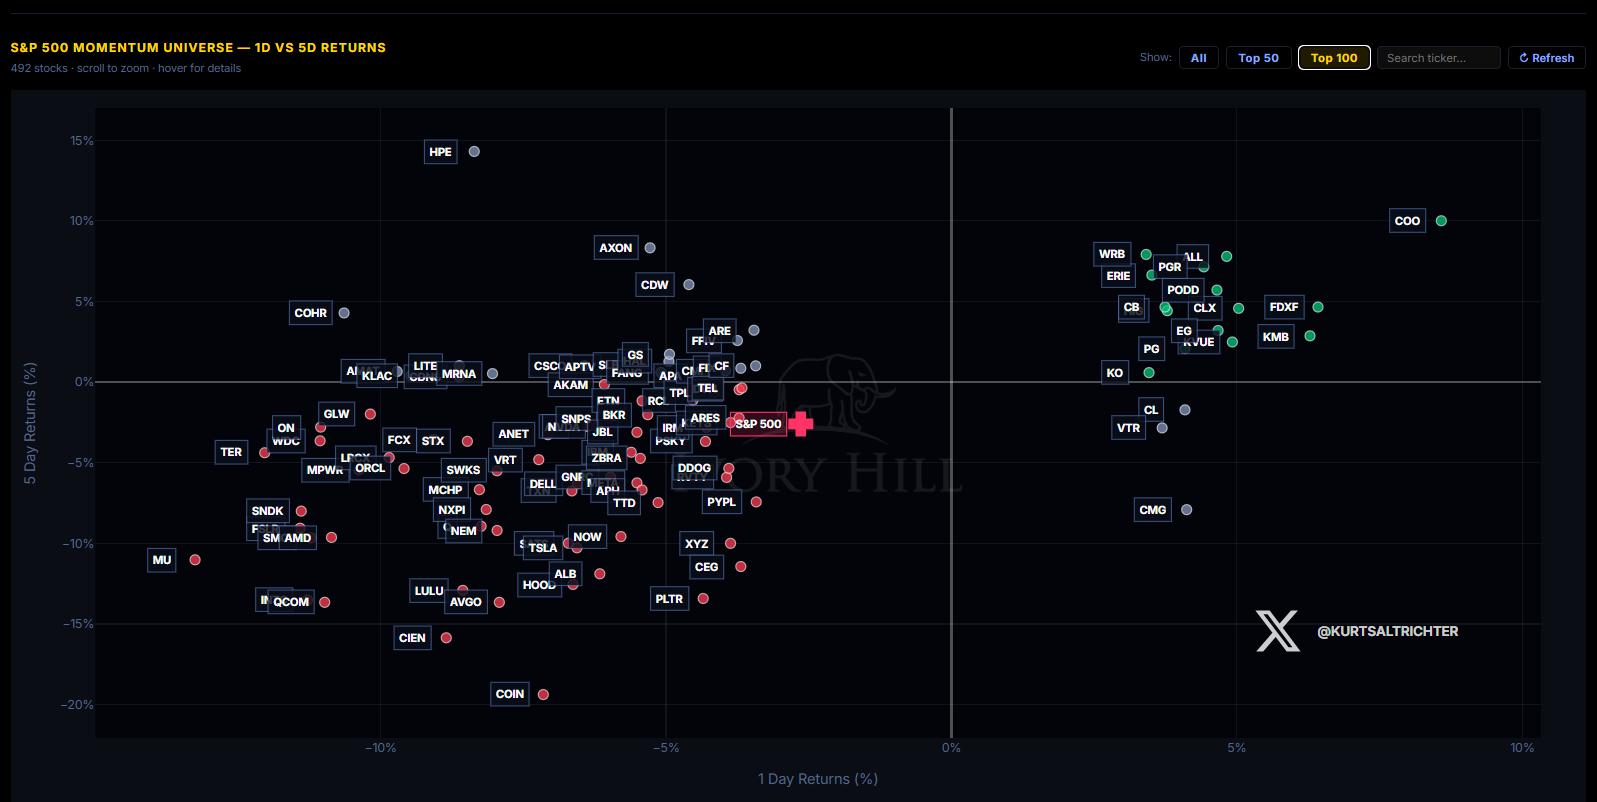
The momentum universe collapsed to the left side of the chart. Nearly every name printed a negative one-day return. The semiconductors took the worst of it: Micron (MU) down roughly 11%, Qualcomm (QCOM) down 13%, Broadcom (AVGO) down 13% over five days. Coinbase (COIN) was the single worst name at roughly -20%.
The only names holding the right side were defensives and insurers: Cooper Companies (COO), W.R. Berkley (WRB), Progressive (PGR), Allstate (ALL), Clorox (CLX), Kimberly-Clark (KMB), Procter & Gamble (PG), Coca-Cola (KO). When the money rotates from semis to soap, the tape is playing defense.
MARKET STRUCTURE: THE ANCHOR POINT
SPX closed Friday at 7,383.74. The gamma flip sits at 7,503. Dealers are operating 119 points below the flip in negative gamma territory.
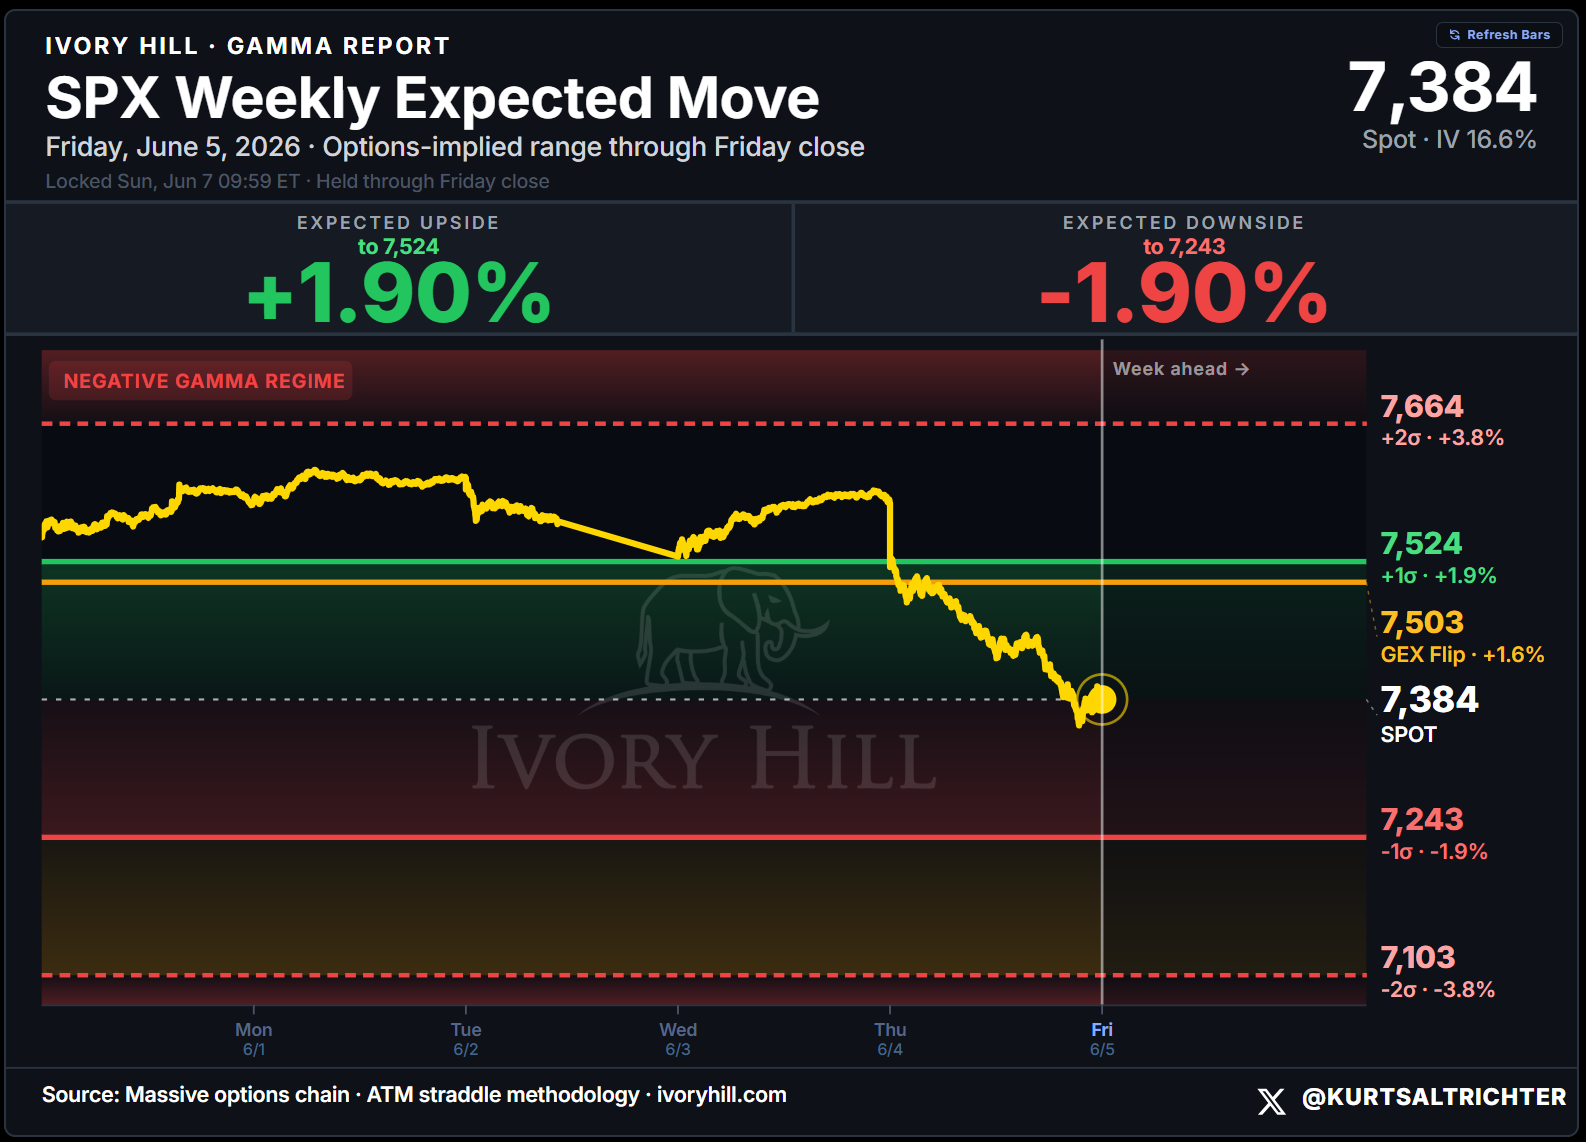
For eight weeks, dealers were long gamma, buying weakness and selling strength, giving us that smooth and Khushi up trend. That mechanical support is gone. In negative gamma, dealers hedge with the move. They sell into weakness and buy into strength, which amplifies volatility in both directions. Friday’s 2.64% single-day drop is what that looks like in practice.
I called this line for eight straight weeks as the structural anchor for the entire move from 6,275 to 7,580. The anchor held until Friday. Now the same line that supported the rally becomes resistance. The market has to climb back above 7,503 to put dealers back in positive gamma. Until it does, the path of least resistance runs with volatility.
This week’s expected move has an upside of 7,524 (+1.90%) and a downside of 7,243 (-1.90%). The GEX flip at 7,503 is the level that matters. A reclaim above it flips the regime back. A failure to reclaim, with CPI hitting on Wednesday, keeps the vol throttle going.
VOLATILITY REGIME
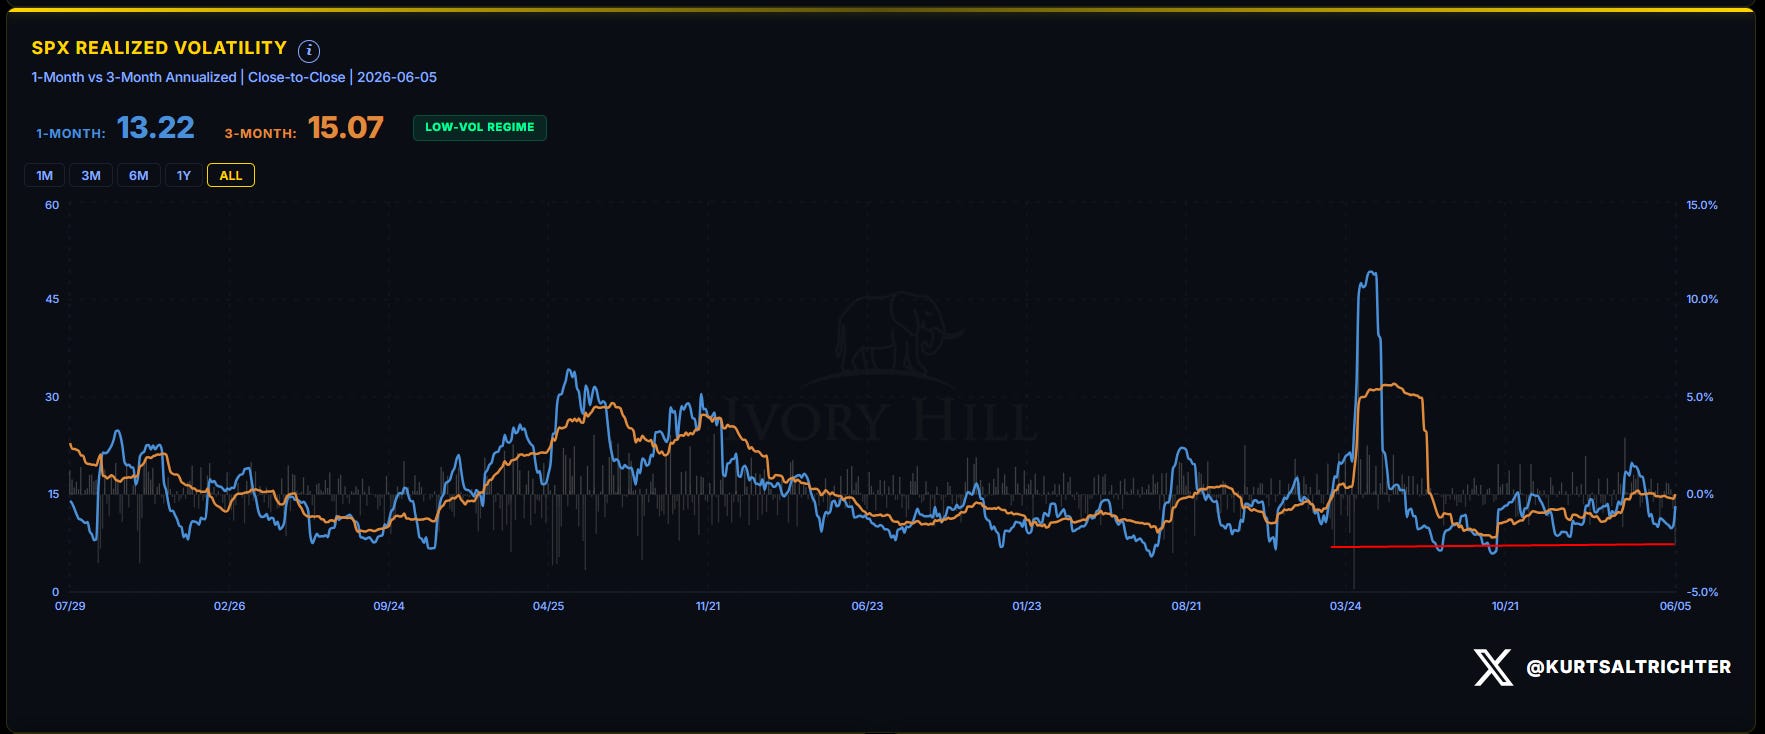
The spread between 1-month and 3-month stays inverted in the bullish direction at 1.85 points, down from 4.27 a week ago. The realized vol signal still reads Bullish because the absolute level remains low by historical standards. But this is the signal most at risk of flipping next. One more session like Friday, and the 1-month crosses above the 3-month, which is one of the named conditions for a full regime shift. Watch the 1-month.
SYSTEMATIC FUND FLOWS
Last week, CTAs were net buyers at +0.098 on the z-score, Bullish at +10.3%, in an uptrend. That reversed hard.
CTAs are now net sellers over the five-day window. Friday alone printed a SHORT at -0.140.
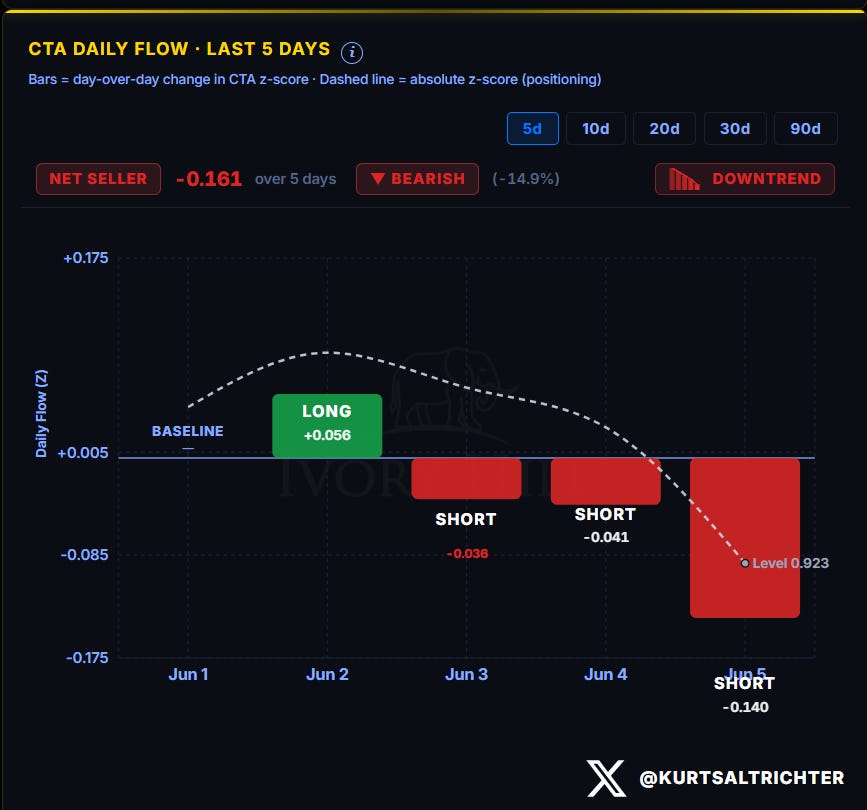
This is the mechanical response I warned about last week. Friday delivered both a trend break and a vol spike, so they SELL.
Vol-control tells the same story, louder.
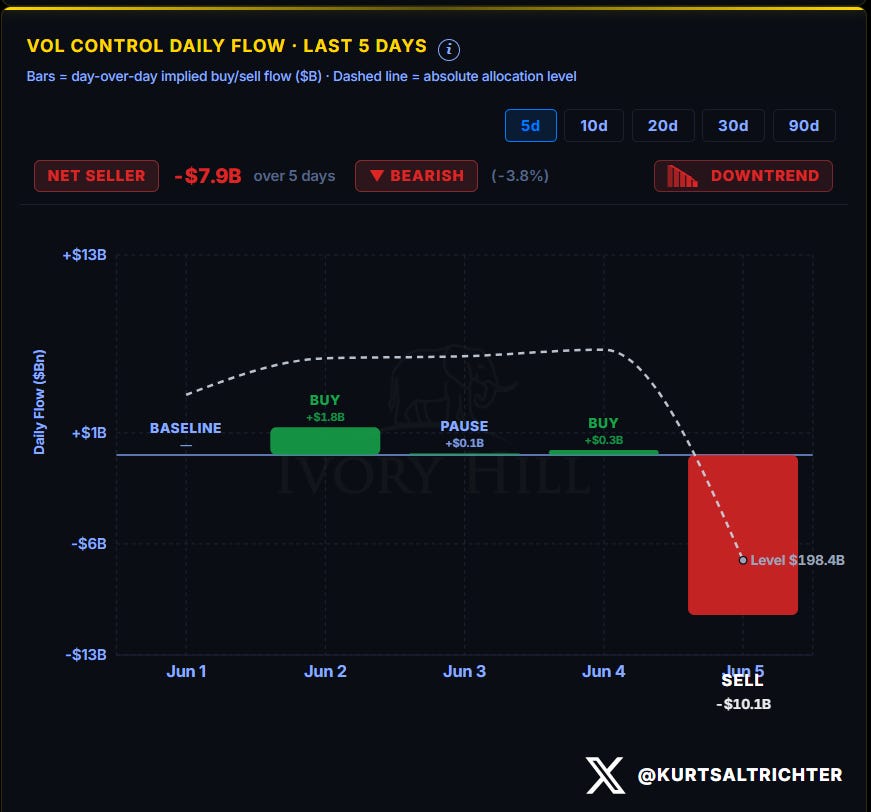
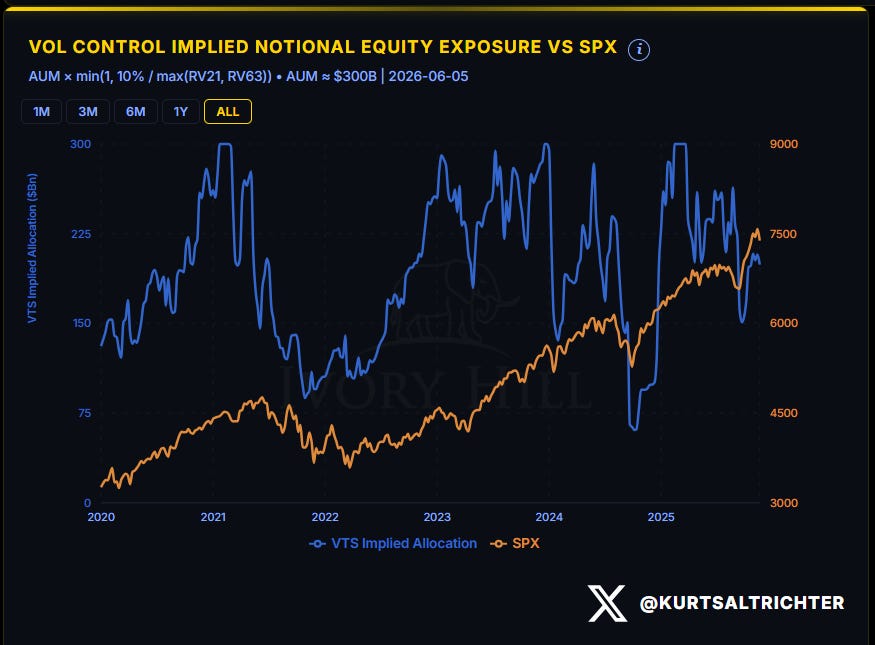
Vol-control funds were net sellers of $7.9 billion over the five-day window. The absolute allocation level dropped to $198.4 billion from $206.4 billion a week ago. Friday’s single-day flow was a SELL of $10.1 billion. That is the largest one-day mechanical sell I have flagged in this report. When realized vol jumps, the vol-control allocation formula forces deleveraging, and Friday’s three-point move in the 1-month RV pulled the trigger.
Both systematic strategies flipped to net selling in the same week. That is one of the explicit conditions I laid out last week for the regime to shift to happen. It is no longer hypothetical.
SYSTEMATIC POSITIONING INDEX
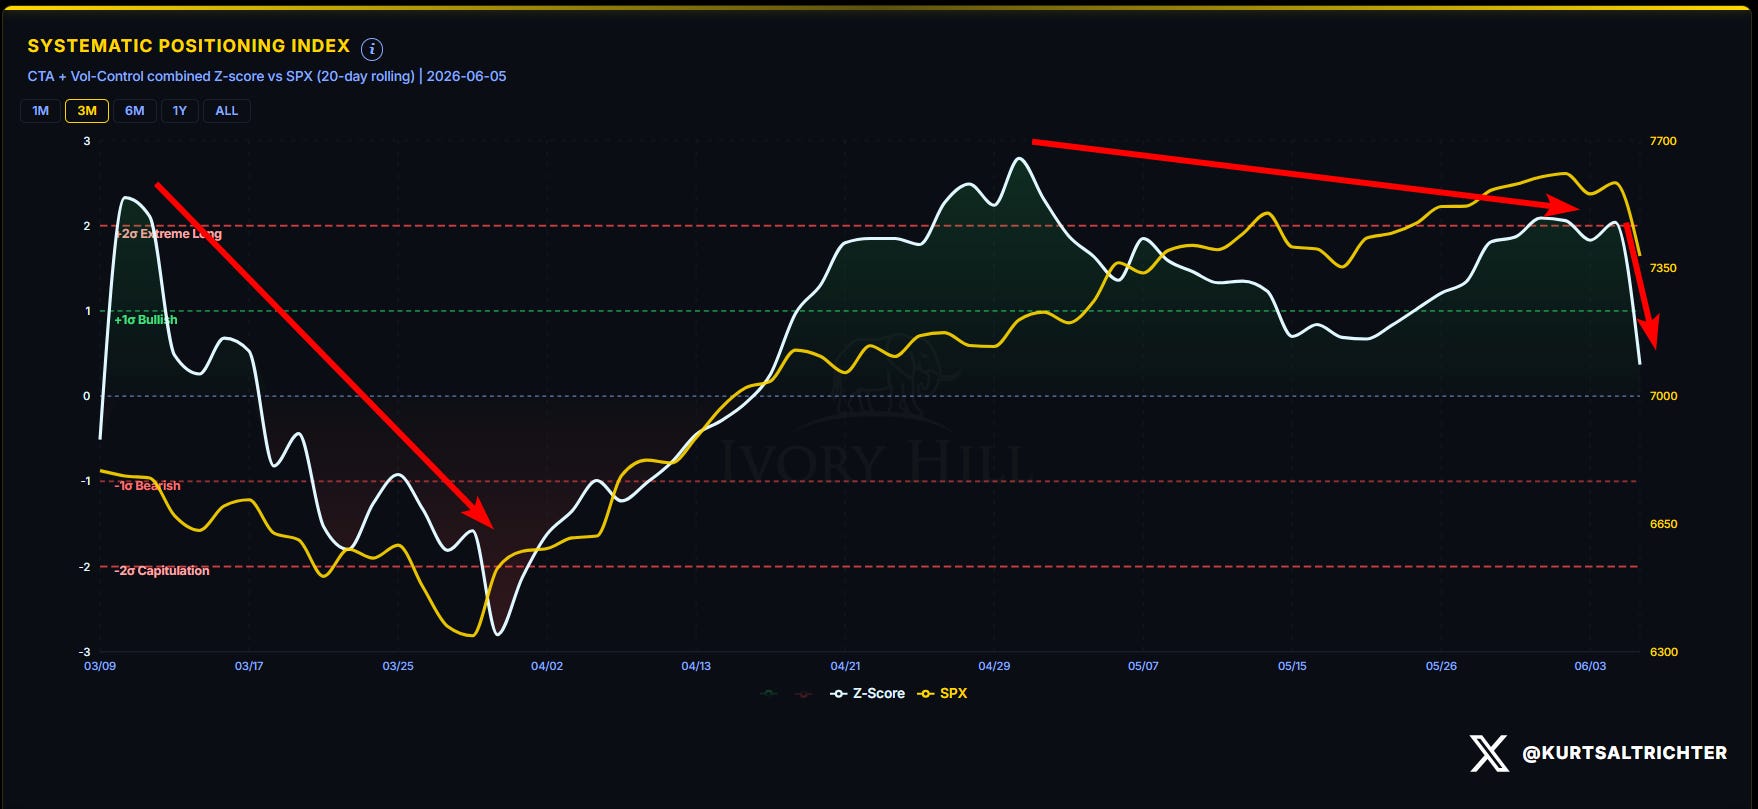
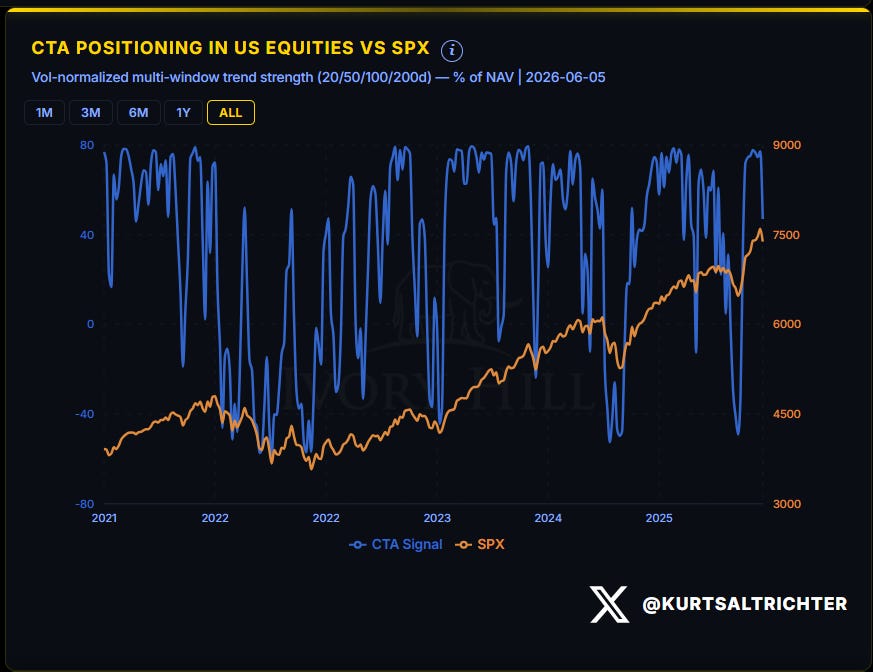
The combined CTA plus vol-control z-score rolled over. The rate of change is the tell. This is not a drift lower. It is a sharp unwind of crowded systematic longs, and it tracked the SPX lower in near-lockstep.
The systematic bid that helped carry the index to its highs reversed. When positioning is unwinding from extreme long at this speed, the supply is mechanical and price-insensitive. It does not stop because the market has gotten cheaper. It stops when the trend and vol signals stabilize, and neither has yet.
MARKET BREADTH
58.3% of S&P 500 members are trading above their 200-day moving average as of Friday’s close.
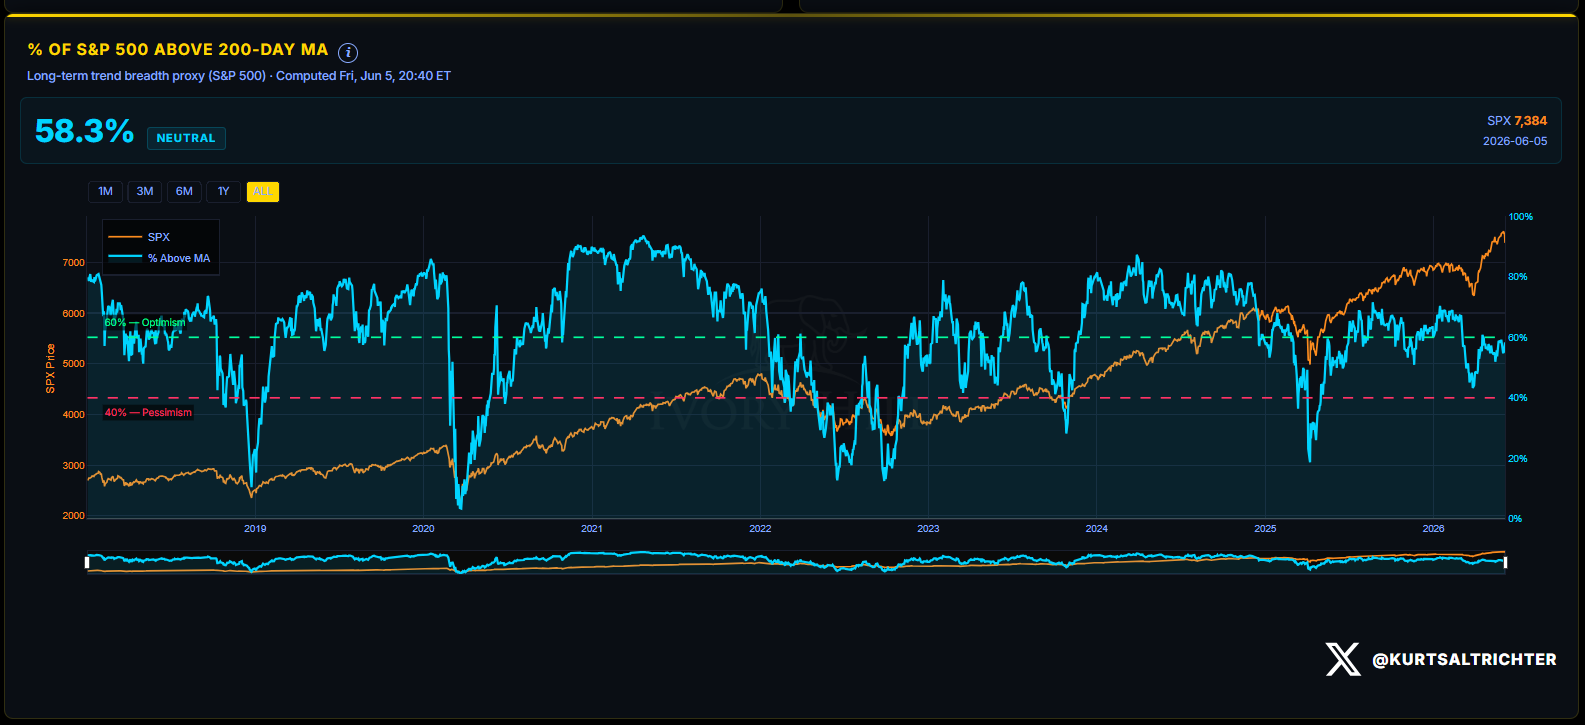
The index dropped 2.59% on the week, and the percentage of names above their 200-day held flat.
The line to watch remains 40%. Breadth breaking below that is one of the named regime-shift conditions, and it is nowhere close. The trend damage on Friday was a price and volatility event, not yet a breadth event.
DEALER GAMMA DASHBOARD AND COMPOSITE REGIME
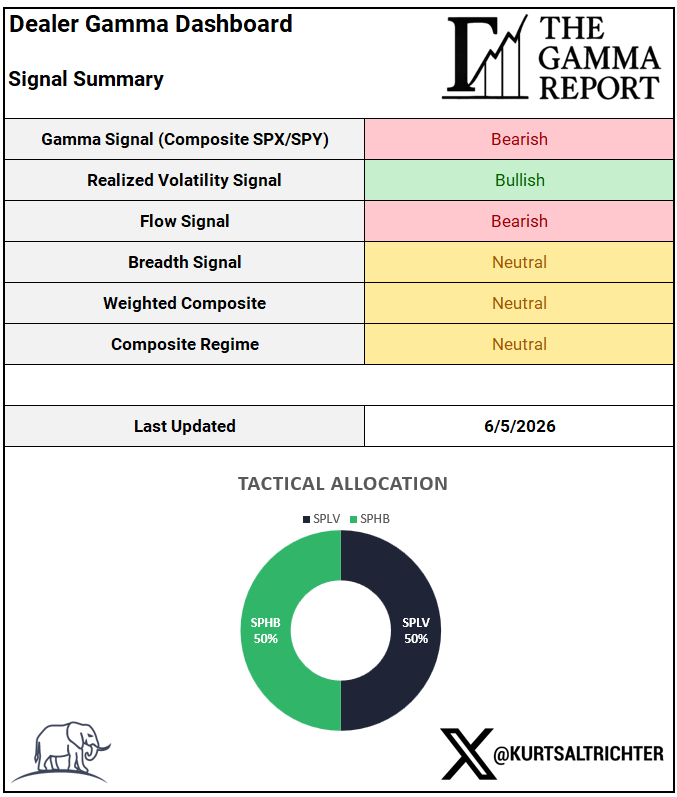
Two signals flipped in a single week. Gamma went Bearish when the price closed below the flip. Flow went Bearish when both CTAs and vol-control turned net sellers simultaneously. The only thing holding the composite at Neutral rather than Risk-Off is the realized vol signal, which is Bullish on absolute level alone and is itself the next domino at risk.
The regime shifts to Risk-Off if any of these develop from here: breadth breaks below 40%, 1-month RV crosses above the 3-month on a sustained basis, or the systematic flows deepen from where they sit Friday. The first is far off. The second is one bad session away.
TACTICAL ALLOCATION PERFORMANCE
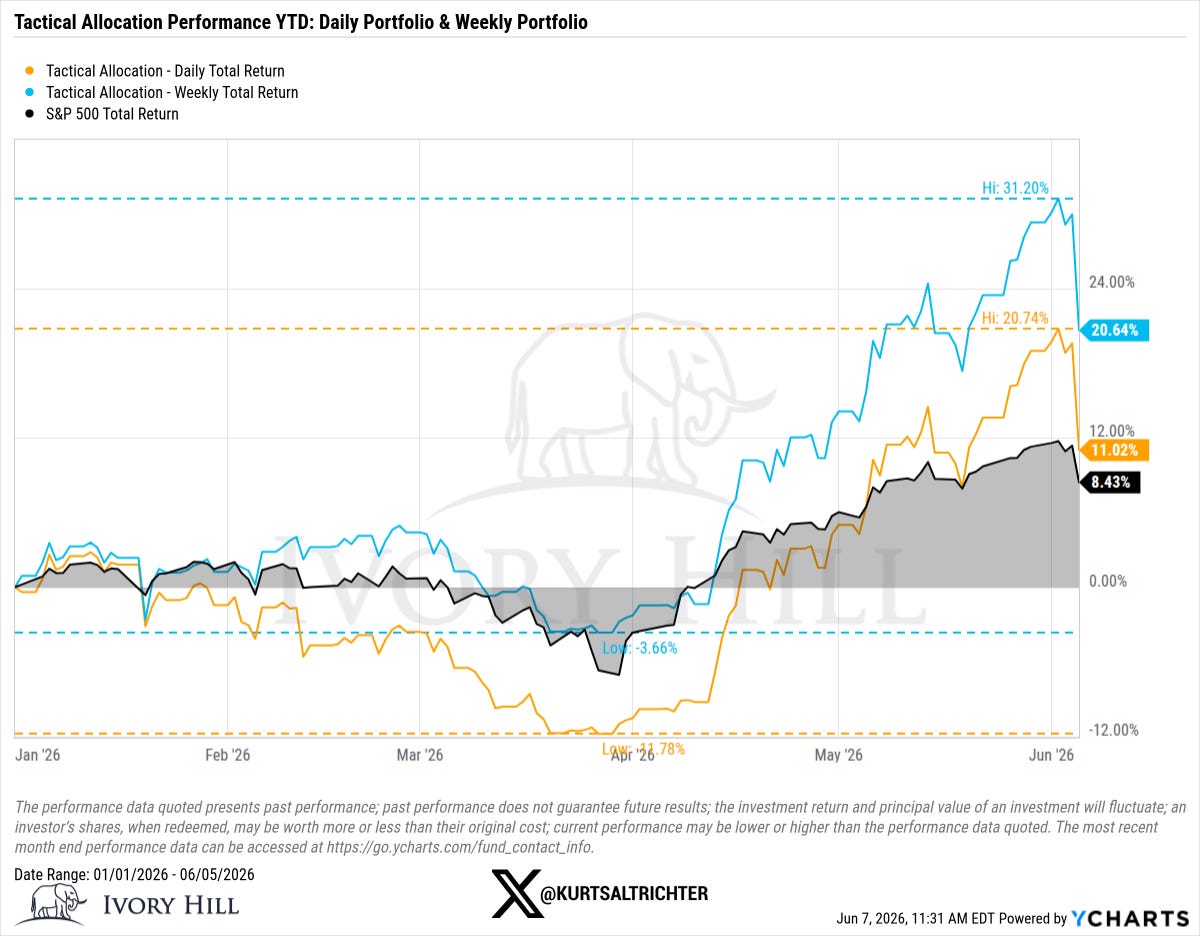
Both tactical sleeves gave back a chunk on Friday because they were positioned in higher-beta equities going into the print.
The composite flipped to Neutral, and the model changed allocation for the first time in eight weeks. New allocation: SPLV 50% / SPHB 50%. The move is out of SPXL entirely and into SPLV, rotating half the book from leveraged high-beta into low-volatility equity. The model is reducing beta into a negative-gamma, rising-correlation tape. It is not going to cash. This model is fully invested in equities at all times. It does not hold cash or bonds. The rotation from SPXL/SPHB into SPLV/SPHB is how it plays defense within an all-equity mandate.
The outperformance over the prior eight weeks came from leaning into beta during a sustained positive-gamma, low-vol, Risk-On regime. That regime ended Friday.
CPI on Wednesday is the next “live test.” If it confirms Friday’s macro signal, the negative-gamma regime will continue and the realized vol signal is the one to watch for the next trigger of the model’s response. If CPI comes in soft and the market reclaims 7,503, the gamma signal flips back, and the conversation looks different by next week.
And remember - The one fact pertaining to all conditions is that they will change.
Feel free to use me as a sounding board.
Follow me on X for more updates.
Best regards,
Schedule a call with me by clicking HERE
Kurt S. Altrichter, CRPS®
Wealth Advisor | President
Disclosure
The Gamma Report is published by Ivory Hill, LLC. All opinions and views expressed in this report reflect our analysis as of the date of publication and are subject to change without notice. The information contained herein is for informational and educational purposes only and should not be considered specific investment advice or a recommendation to buy or sell any security.
The data, models, and tactical allocations discussed in this report are designed to illustrate market structure and positioning trends and may differ from portfolio decisions made by Ivory Hill, LLC or its affiliates. Investing involves risk, including the possible loss of principal. Past performance is not indicative of future results.
Ivory Hill, LLC, and its members, officers, directors, and employees expressly disclaim any and all liability for actions taken based on the information contained in this report.