

I have been publishing this report for 40 weeks straight.
Pre-0500 Look.
S&P 500 futures are down slightly, with crude up 4%, after fresh US strikes on Iran, right into this Tuesday’s CPI, Warsh’s testimony, and the start of bank earnings, kicking off earnings season.
The US hit 140 targets in Iran overnight into Sunday; Iran fired back at Jordan and the Gulf; and Tehran says it closed the Strait of Hormuz, the shipping lane off Iran’s coast that carries a fifth of the world’s oil.
Oman hosted talks Saturday and drafted a plan to reopen the strait, then Iranian drones struck Oman on Sunday, the same country brokering the deal.
Market Recap
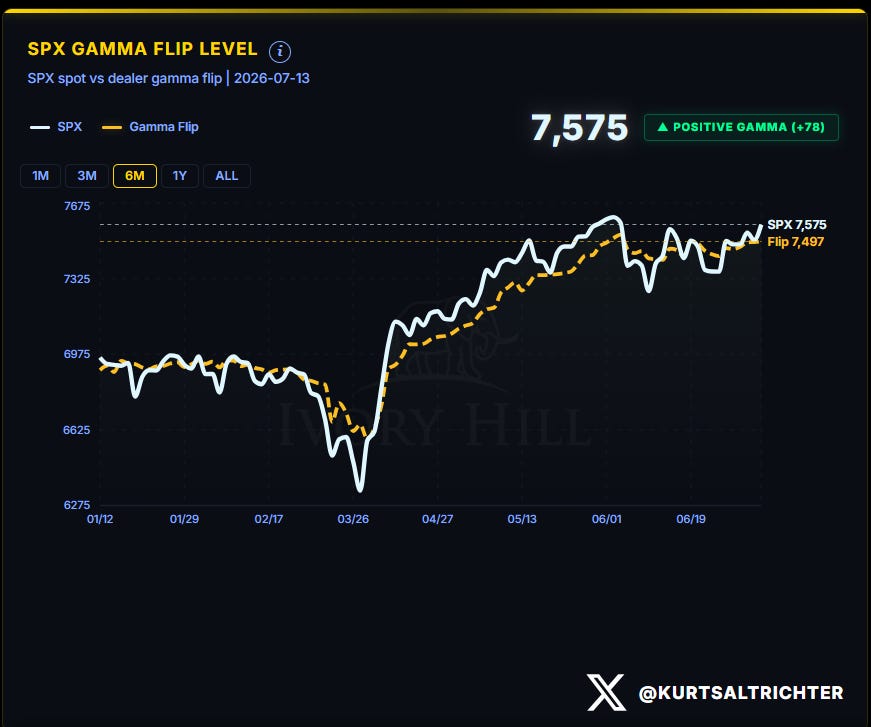
Last week, I gave you 7,475, and the price never closed below it. Geopolitics drove dramatic swings throughout the week. On Monday, markets opened positively with tech leading, but the mood shifted quickly on Tuesday when Iran's Revolutionary Guard Corps fired missiles at commercial vessels in the Strait of Hormuz, striking a Qatari LNG tanker. The US Treasury Department revoked a general license authorizing Iranian oil sales, and semiconductor stocks sold off globally following disappointing preliminary results from Samsung Electronics. The SPX did slip under the flip line on Wednesday (as President Trump declared the US-Iran ceasefire "over" during a NATO summit in Turkey, and US Central Command struck 80 Iranian military targets), but took it back on Thursday, then rose to 7,575 on Friday. S&P 500 now sits +78 above the 7,497 flip line, positive gamma is deeper, and dealers are still buying dips. Up 0.5% on the week, 0.5% under the June 2nd high of 7,610. At this rate, we could hit 8,000 on the S&P 500 this year if earnings season delivers.
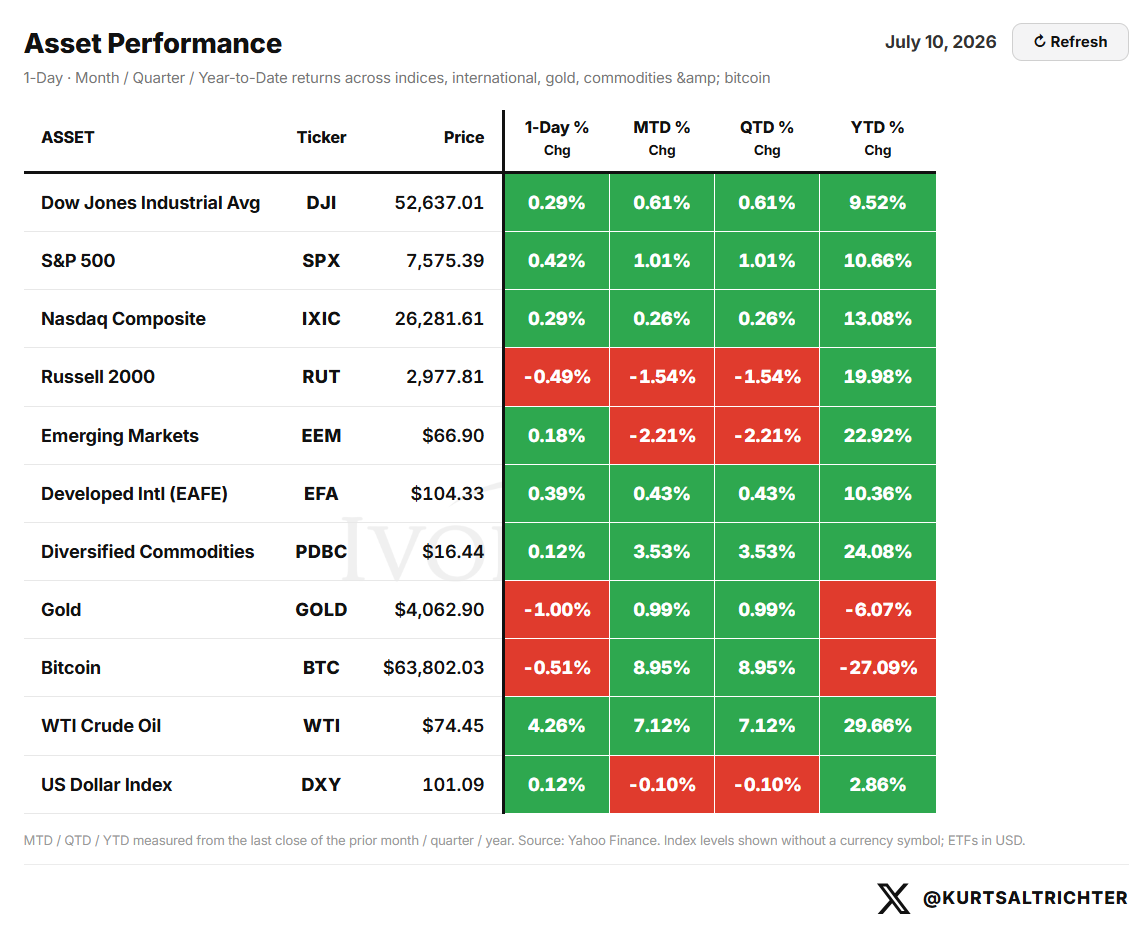
Asset Performance. Crude, commodities, emerging markets and small caps still lead the year, all near double the S&P 500’s +10.66%. Bitcoin is the worst-performing major asset, at -26.44%, even after a +9.93% July bounce.
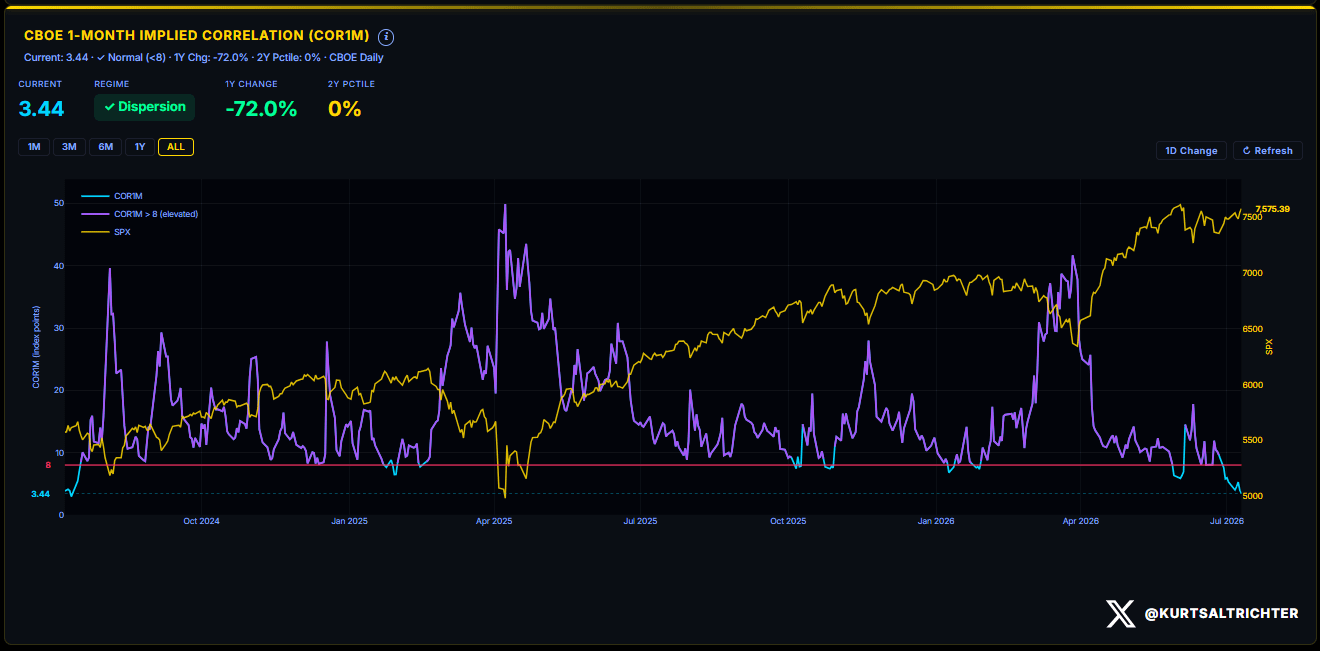
Implied Correlation. One-month implied correlation fell to 3.44, a two-year low. Names are trading on their own stories, not in lockstep. META +15% on the week while Moderna fell 15%. That dispersion lets the index grind up on small gains.
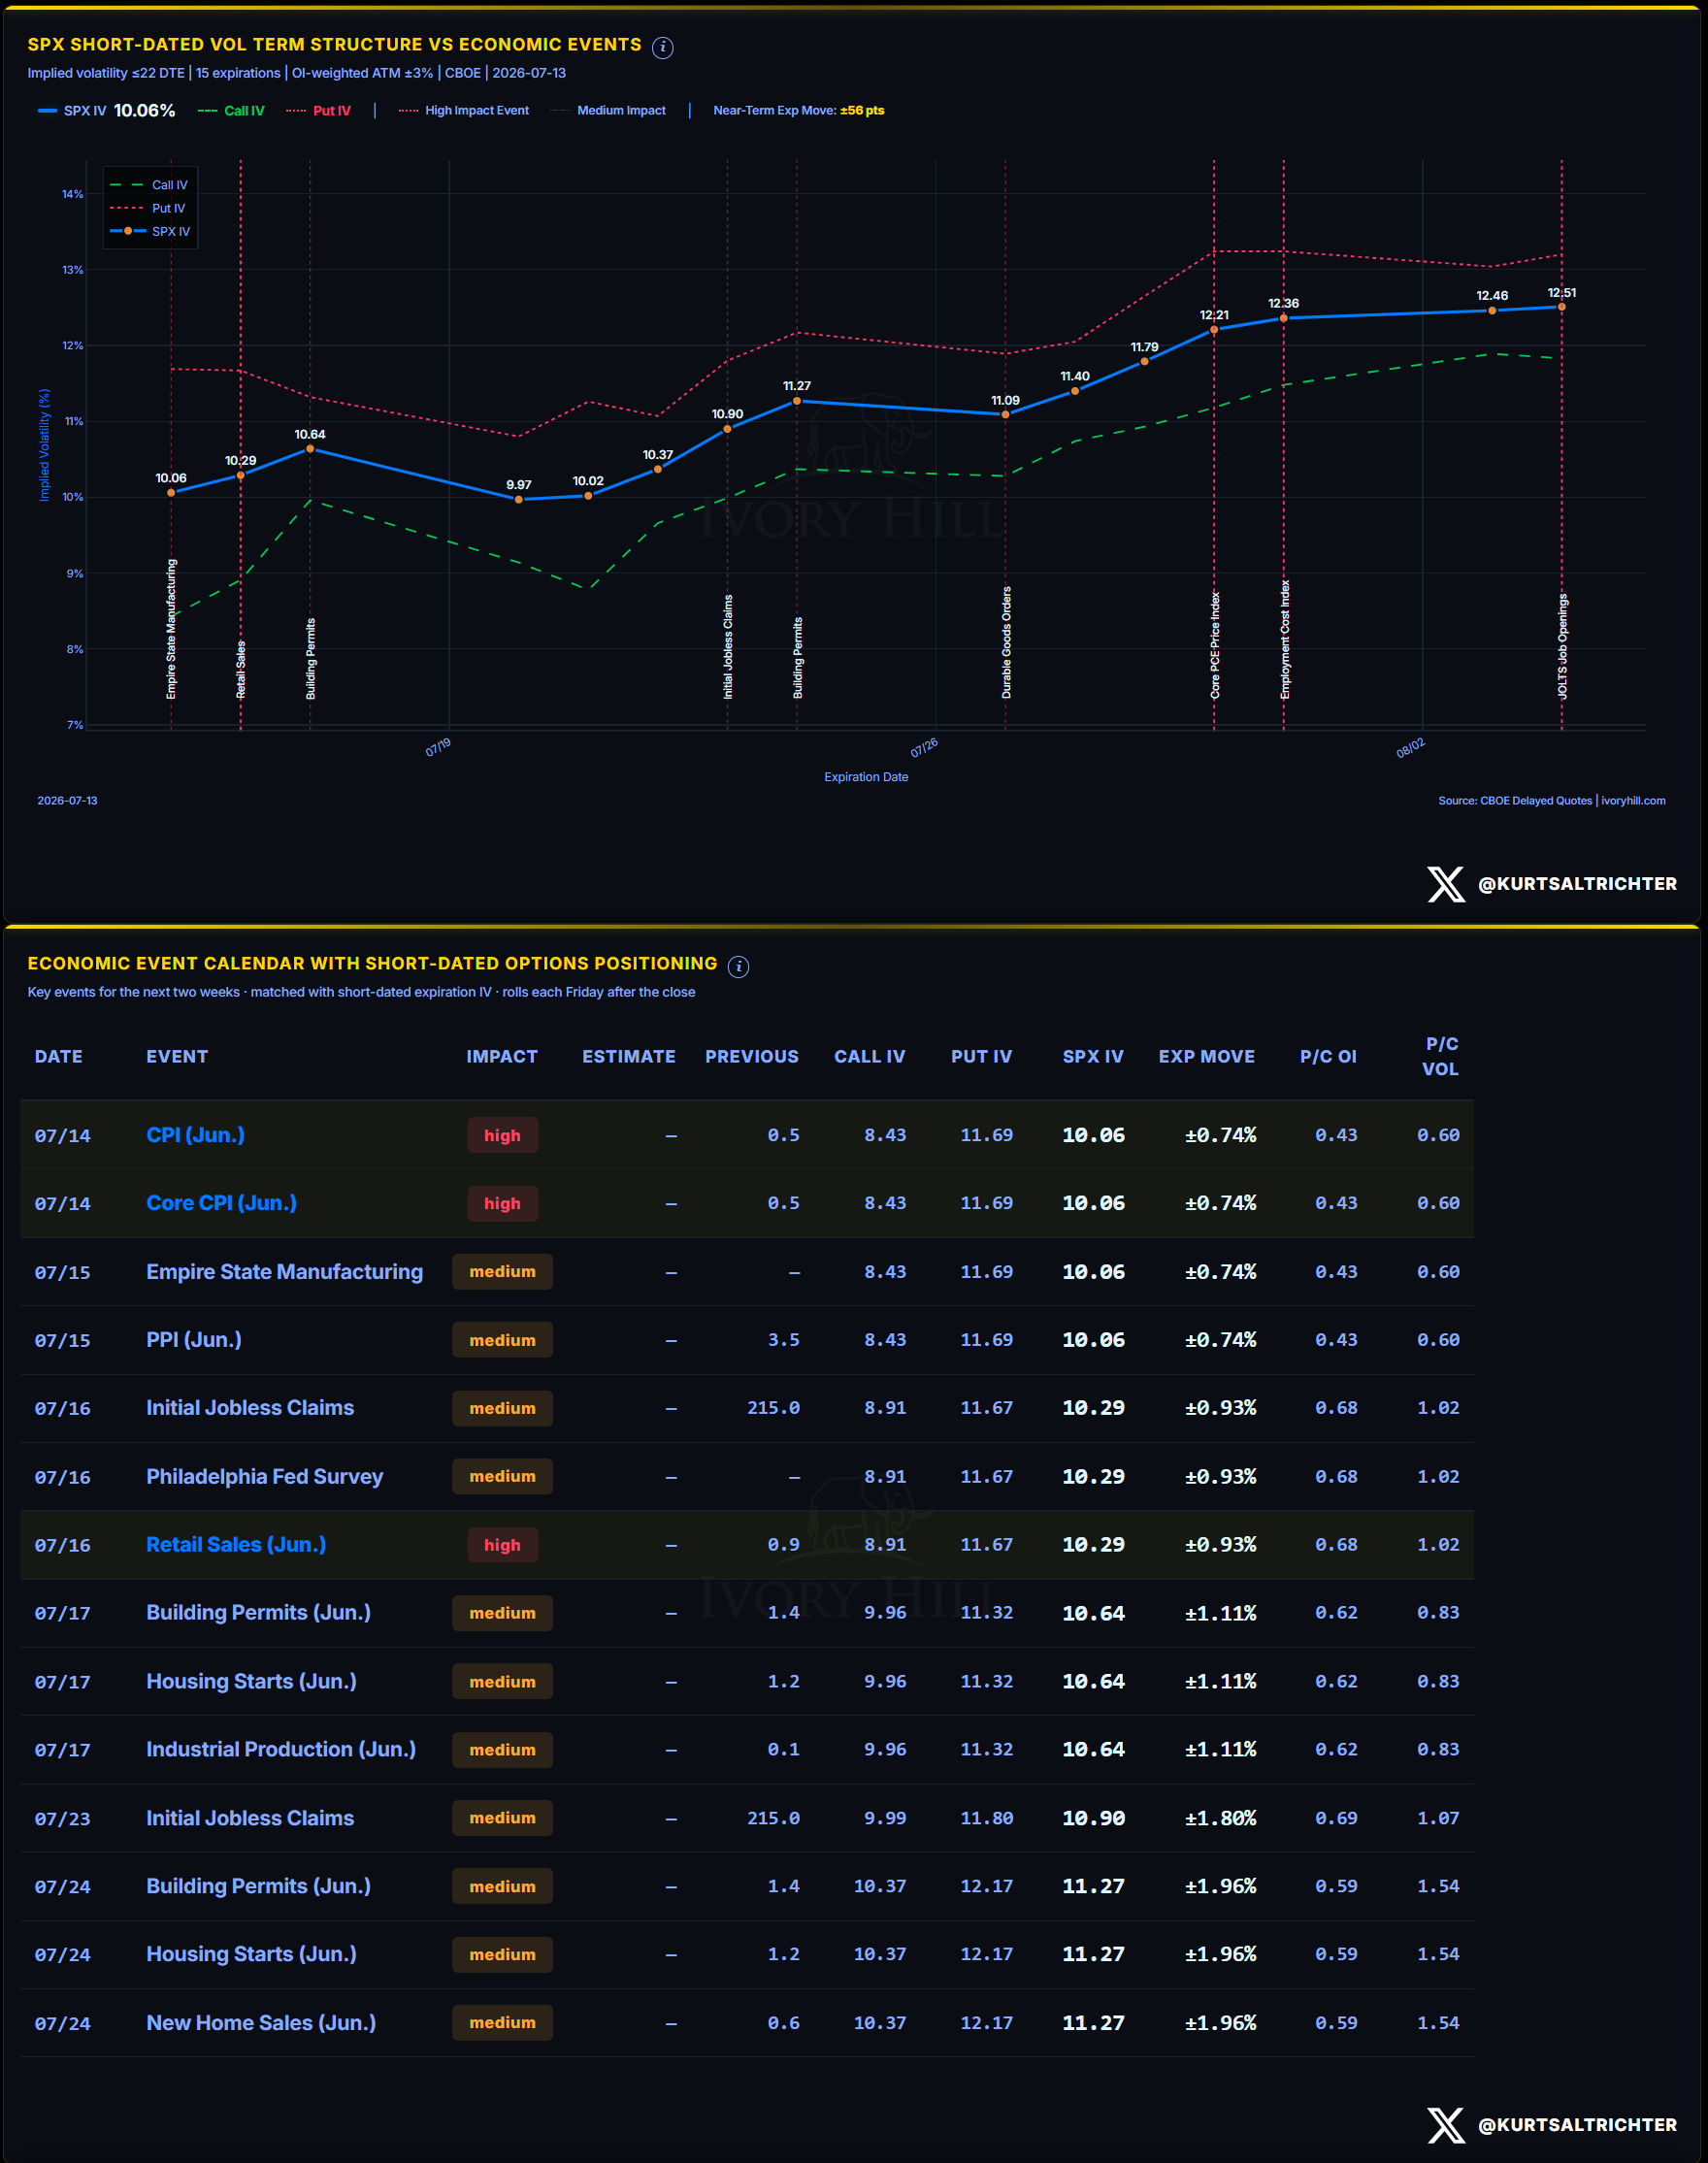
Economic Calendar and Vol Term Structure. CPI Tuesday is the event, high-impact, June data. Options price just ±0.74% on that expiration, and near-term SPX IV sits at 10%. The market walks into an inflation print with almost no fear priced in. My call has not changed: headline CPI below 4.0%, and no Fed hike into an oil-driven CPI spike.
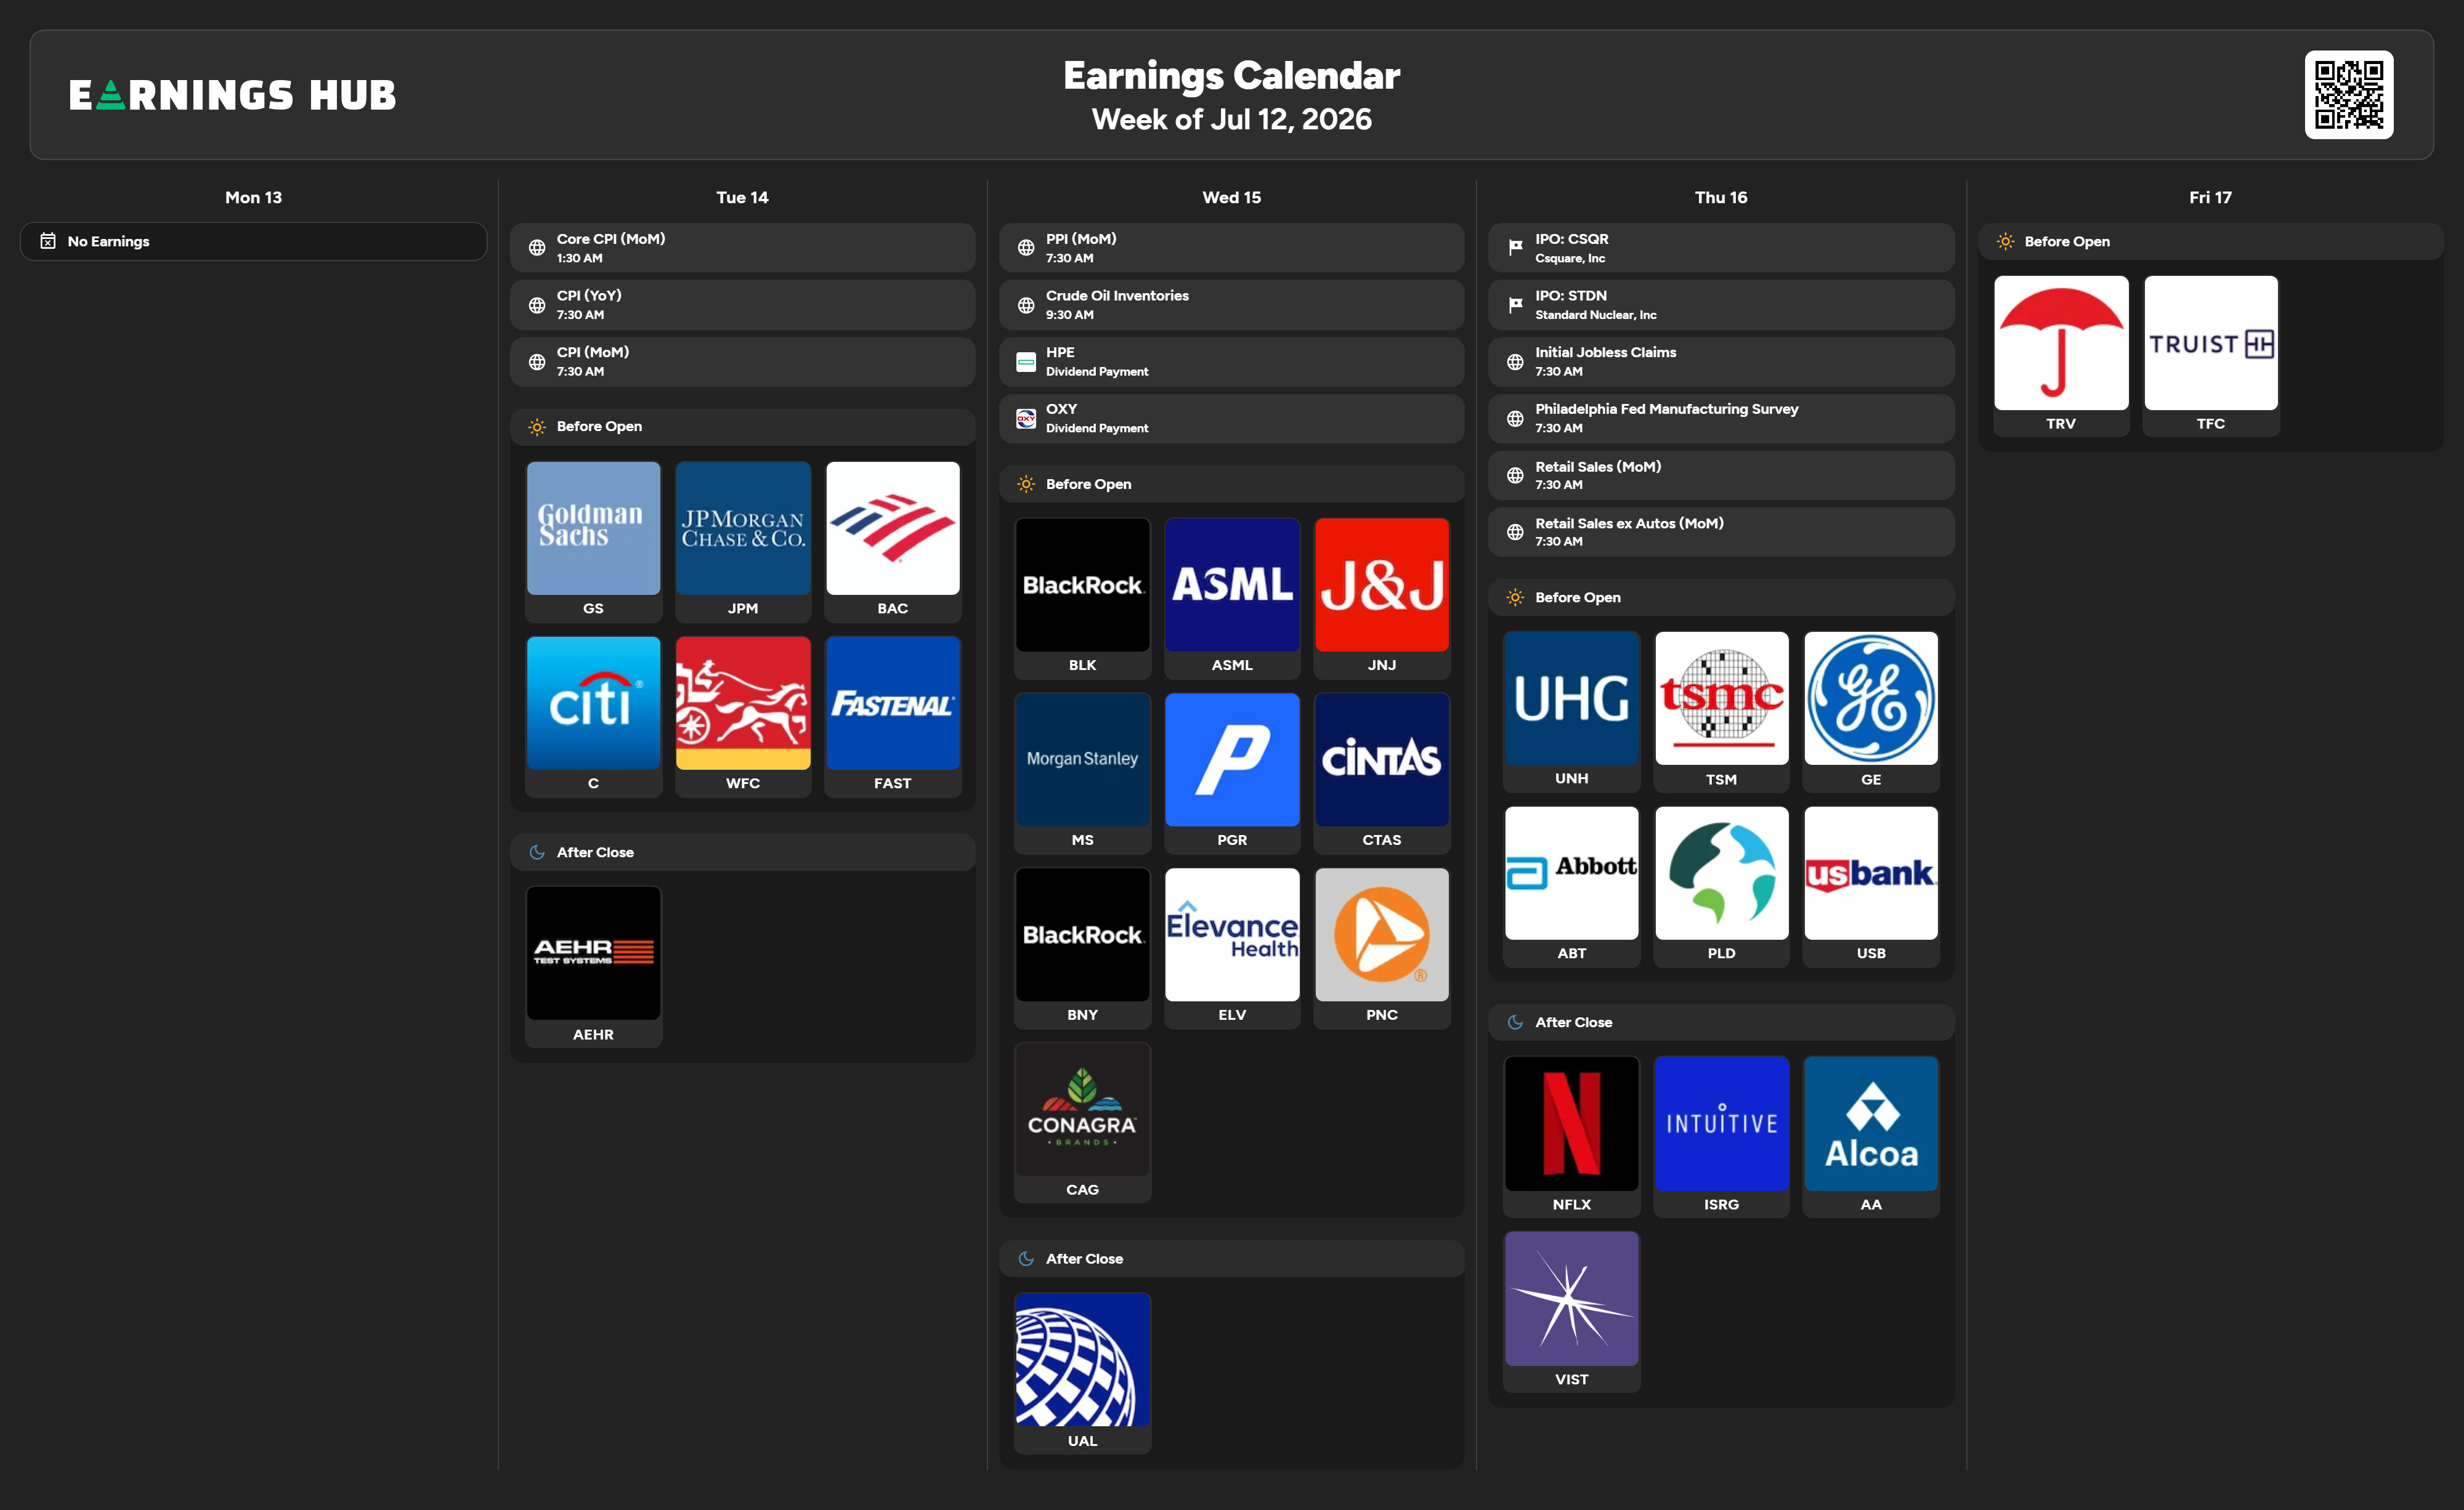
Earnings season starts this week. Goldman, JPMorgan, Bank of America, Citi, Wells Fargo Tuesday, then Morgan Stanley, BlackRock, J&J, ASML Wednesday, and Netflix, TSMC, UnitedHealth Thursday. The banks set the tone for CPI, PPI, and Retail Sales the same week.
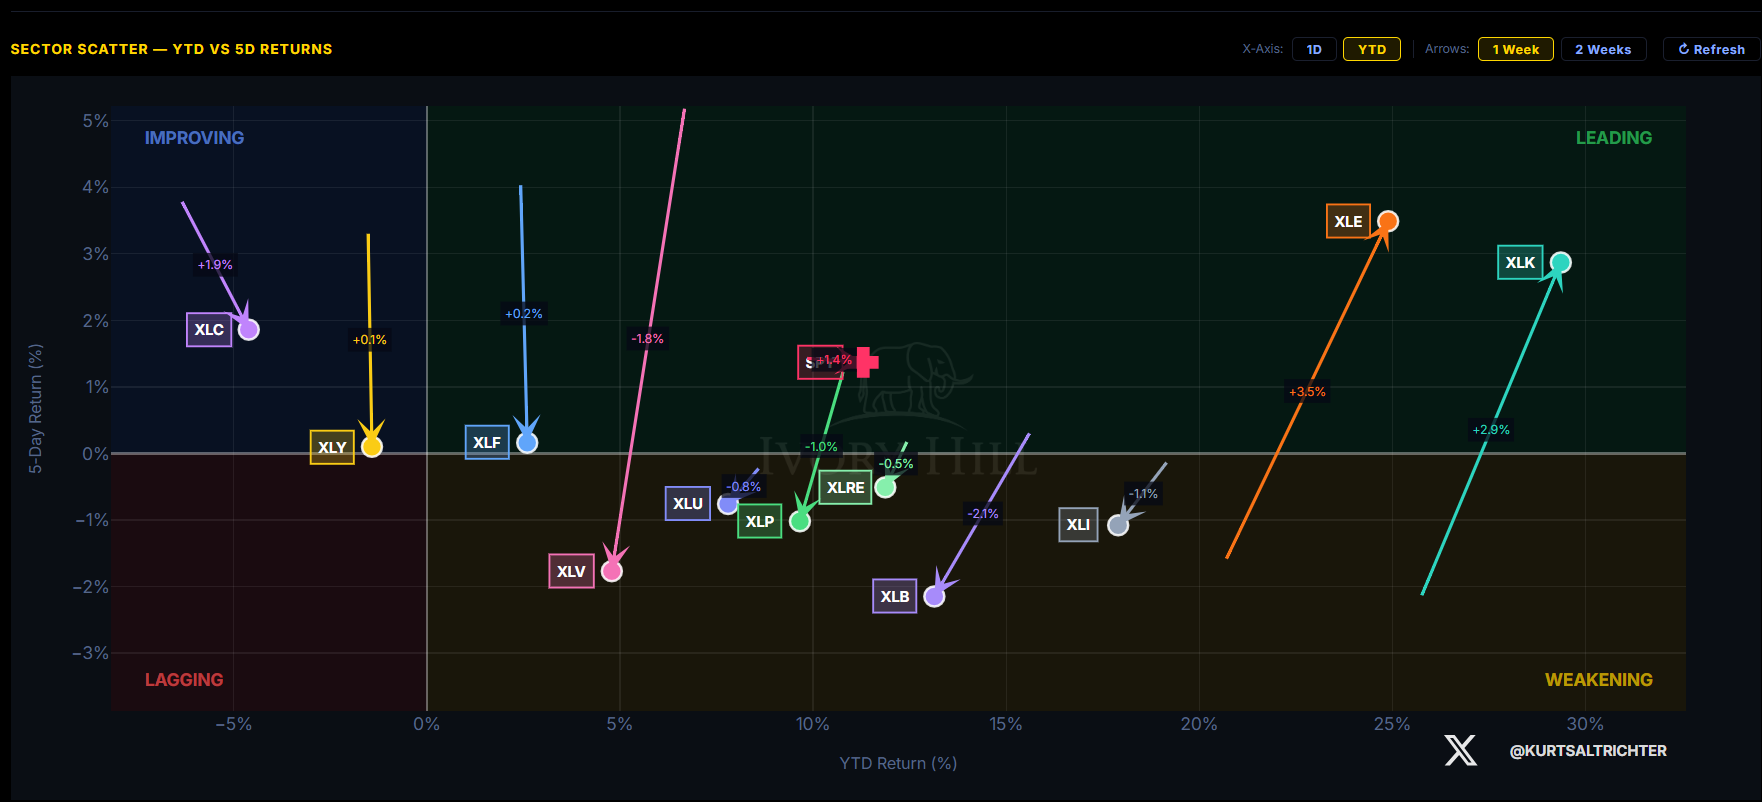
Sector Momentum. Last week’s cyclical rotation reversed. Tech +2.9% and Energy +3.5% led the week and the year. Materials, health care, staples, and industrials all went red. Leadership narrowed back to tech and energy. That is risk-on.
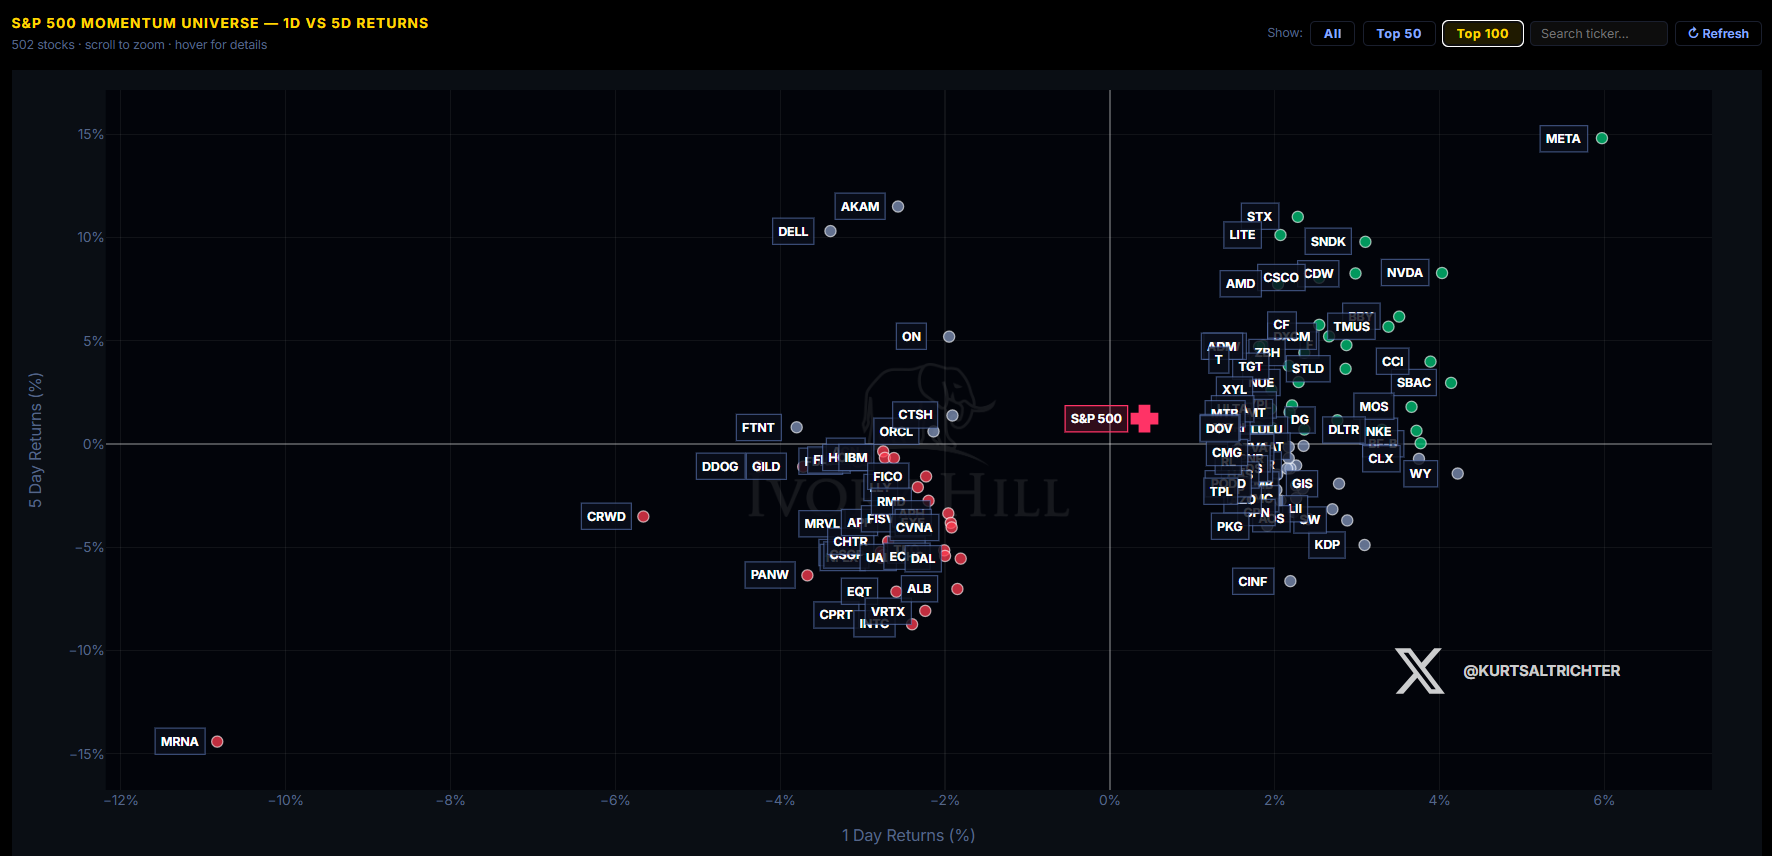
Single-Name Momentum. META 0.00%↑ Led everything, +6% on the day and +15% on the week. Semis and storage behind it: Seagate, Sandisk, Nvidia, AMD. The clue is the reversal: Moderna went from +22% last week to -15%, CrowdStrike +13% to -3.5%.
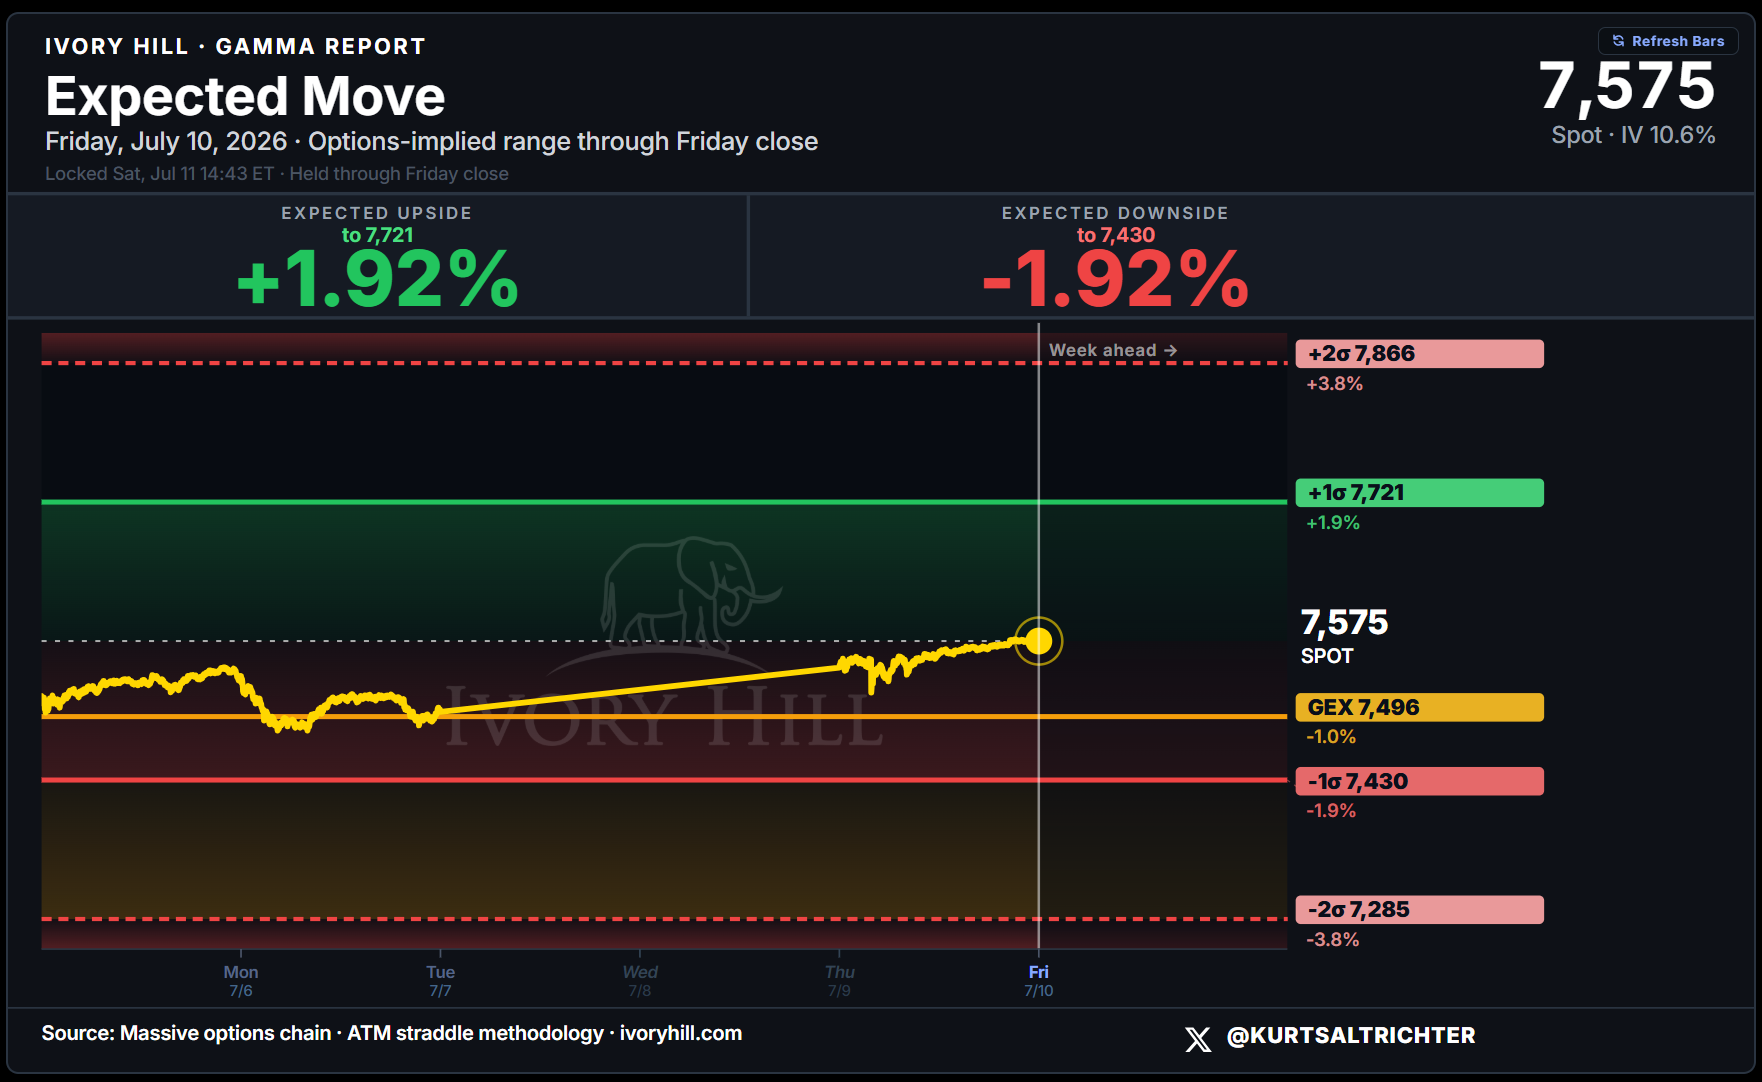
Weekly Expected Move. The options chain prices a symmetric week: +1.92% to 7,721, -1.92% to 7,430. Last week was lopsided to the downside at -3.07%. The crash premium drained as the gamma flip line held. GEX 7,497 is the line to hold.
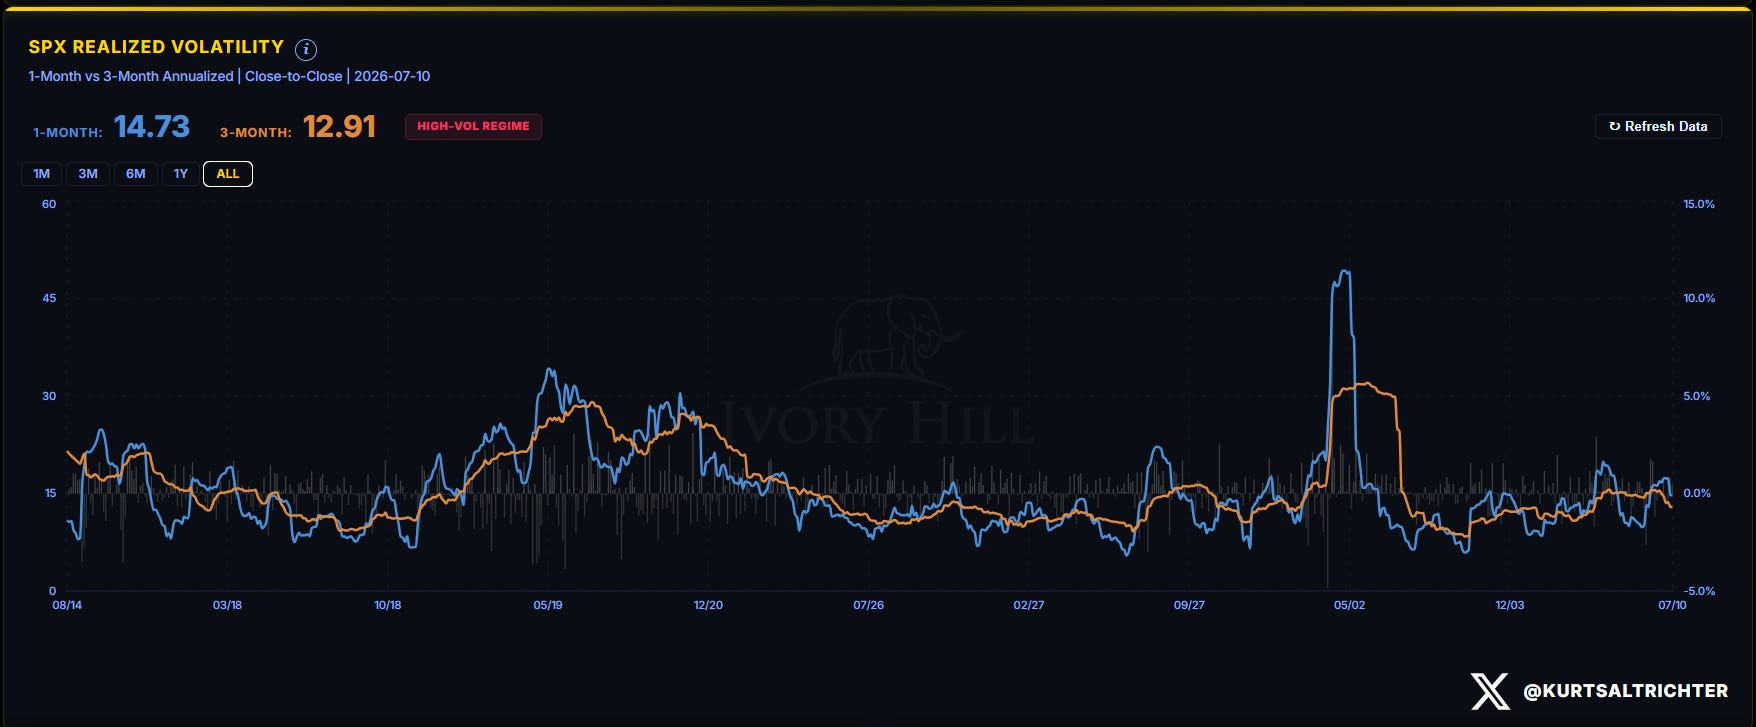
Volatility Regime. One-month realized fell to 14.73 from 17.29, the drop positive gamma is supposed to produce. Fast vol is closing on slow vol at 12.91. As soon as fast vol closes in on slow vol, volatility control funds will be forced to buy.
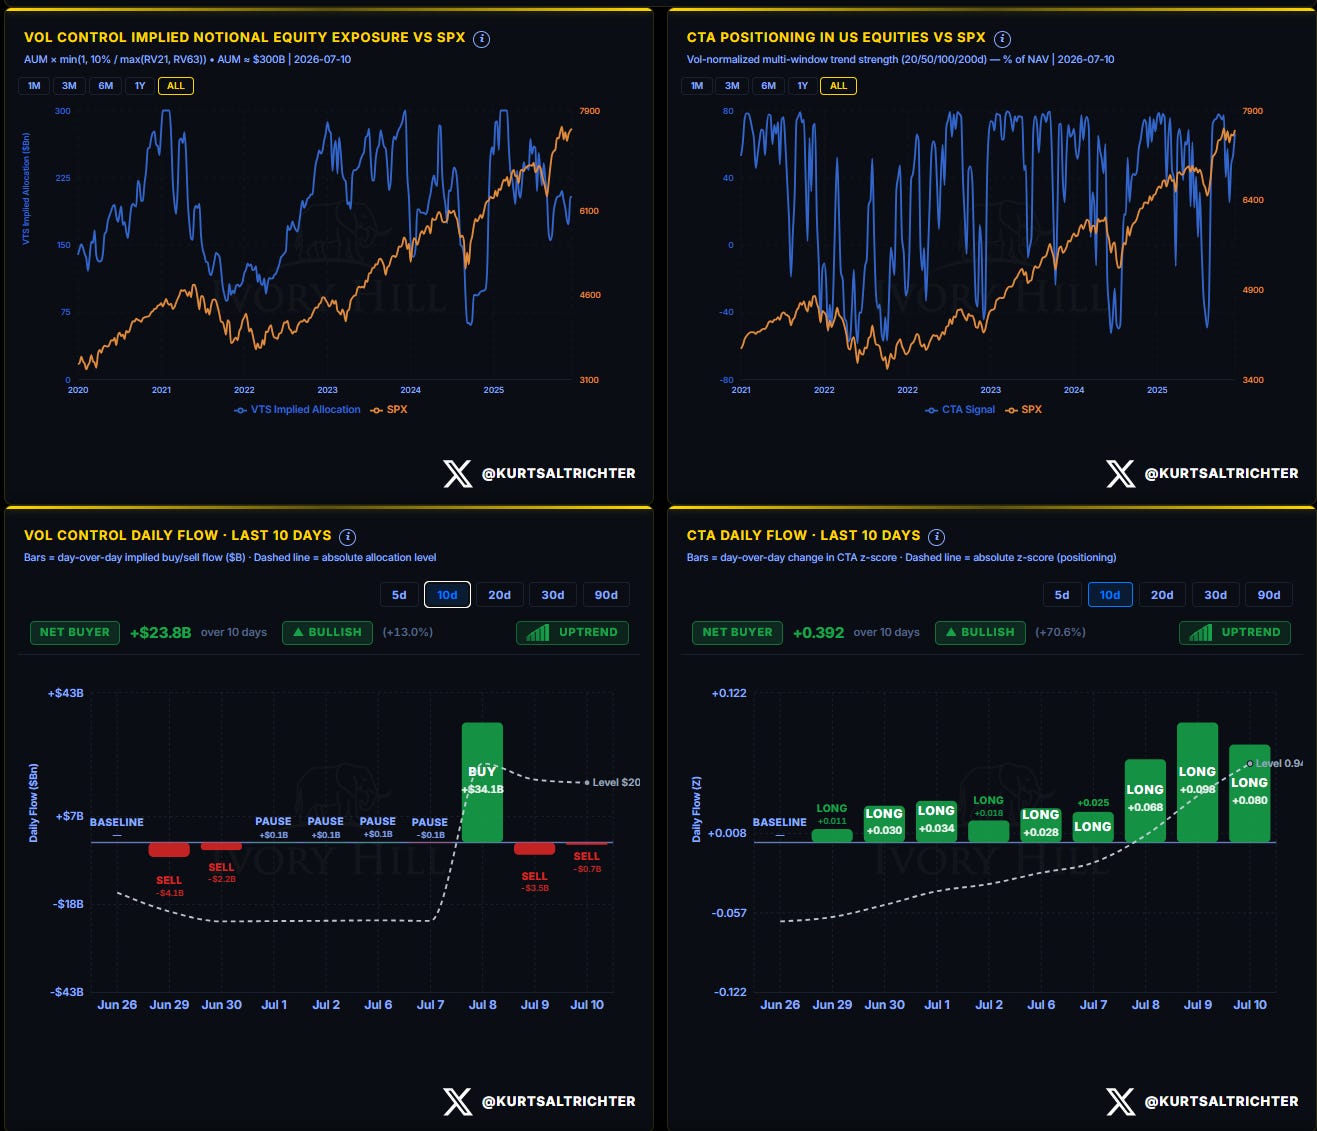
Systematic Fund Flows. CTAs and vol-control both turned net buyers. CTAs printed long every session, vol-control bought $23.8B over ten days, including a +$34B day on Wednesday. Mechanical money is adding fuel.
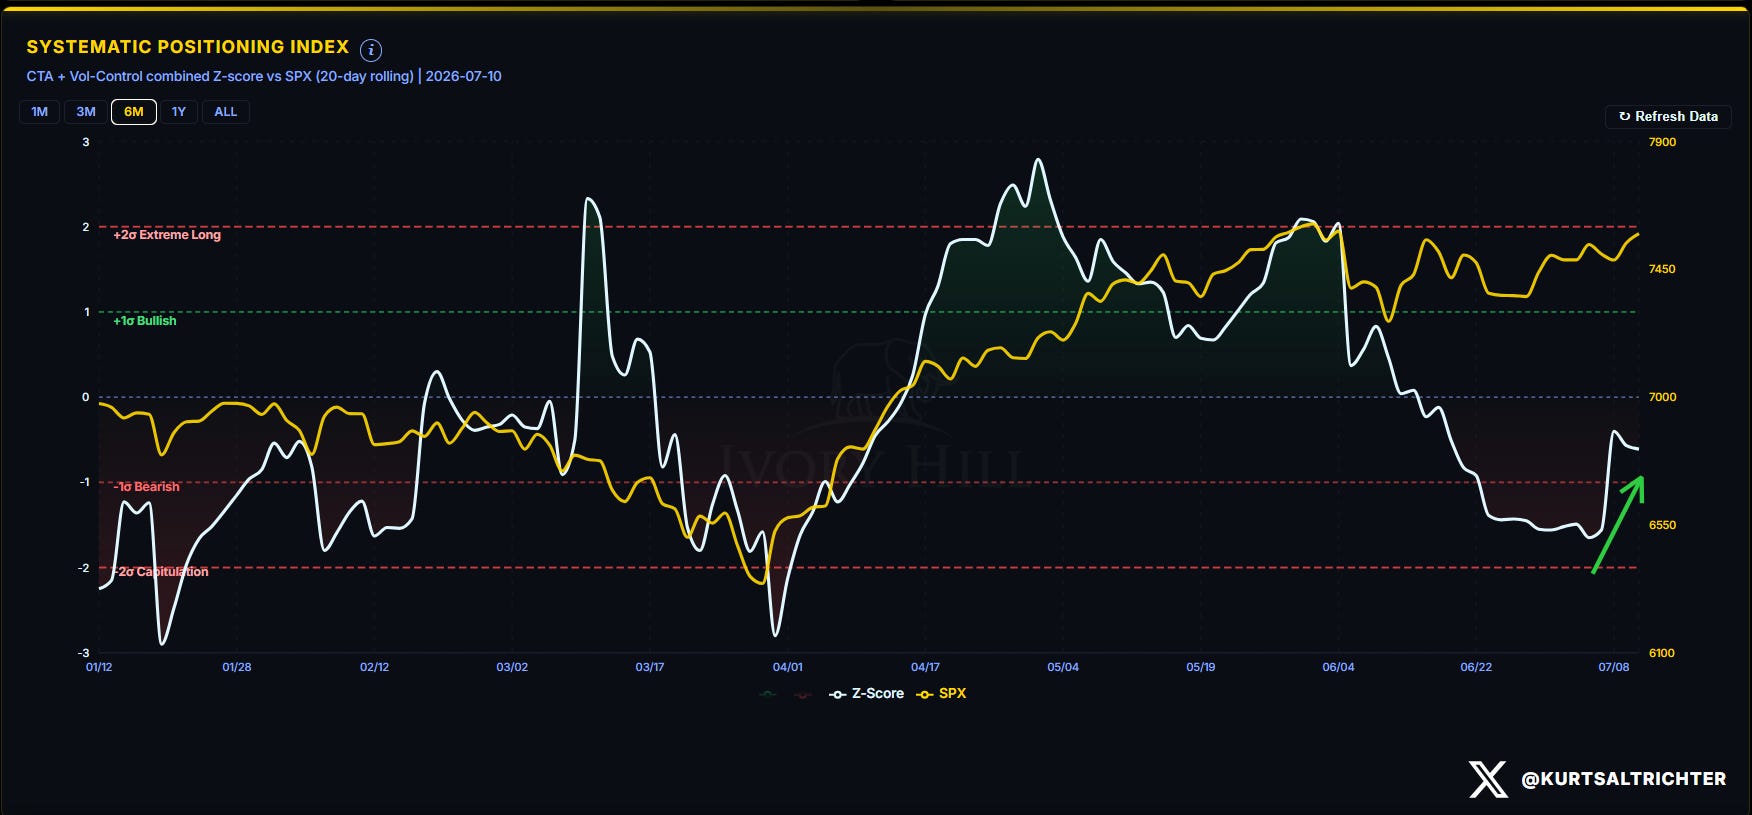
Positioning Index. Systematic positioning climbed off its late-June capitulation low but remains net short on a tape near the highs. Under-positioned money chasing a market that keeps holding. This headwind is turning into a tailwind.
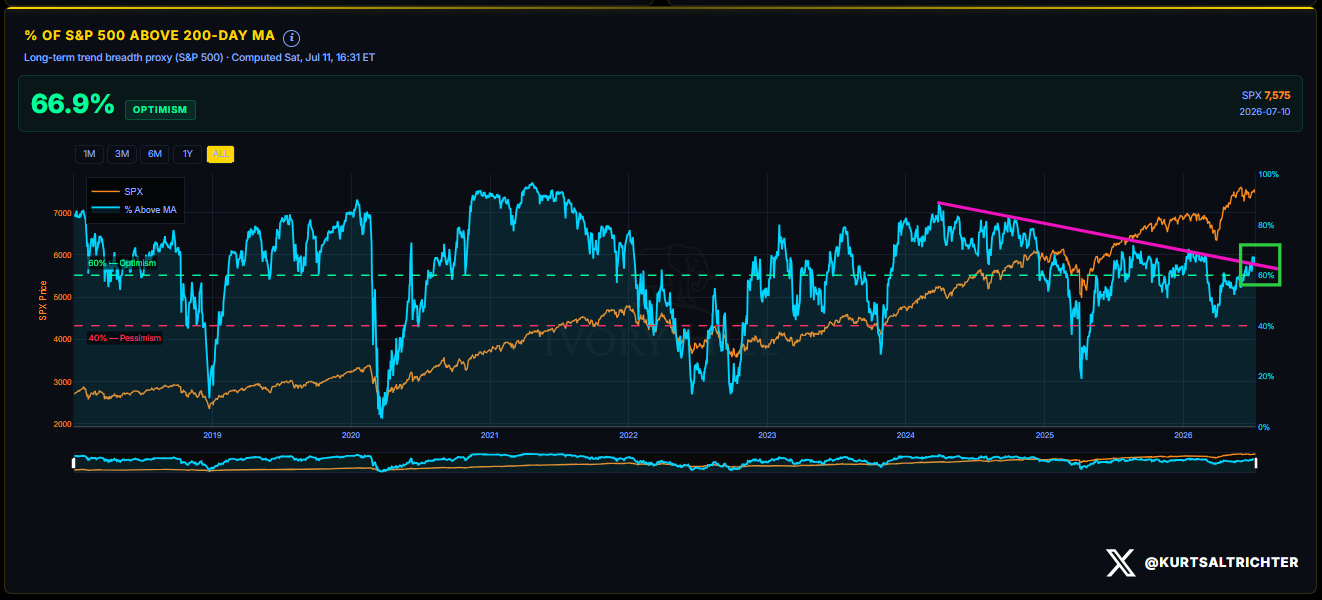
Market Breadth. 66.9% of the S&P 500 trades above its 200-day MA, flat for the week and firmly in optimistic territory. The 40% bearish line is nowhere close. This tells us that this is sector rotation inside a bull market.
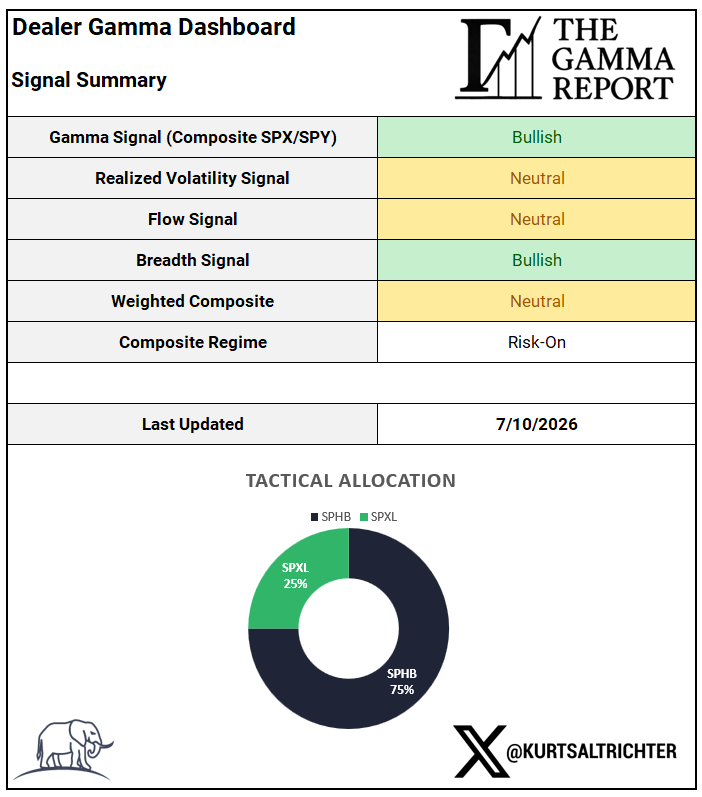
Dealer Gamma Dashboard. Gamma and breadth Bullish, realized vol and flow Neutral. Composite Regime still Risk-On. Allocation stays aggressive: 75% SPHB, 25% SPXL.
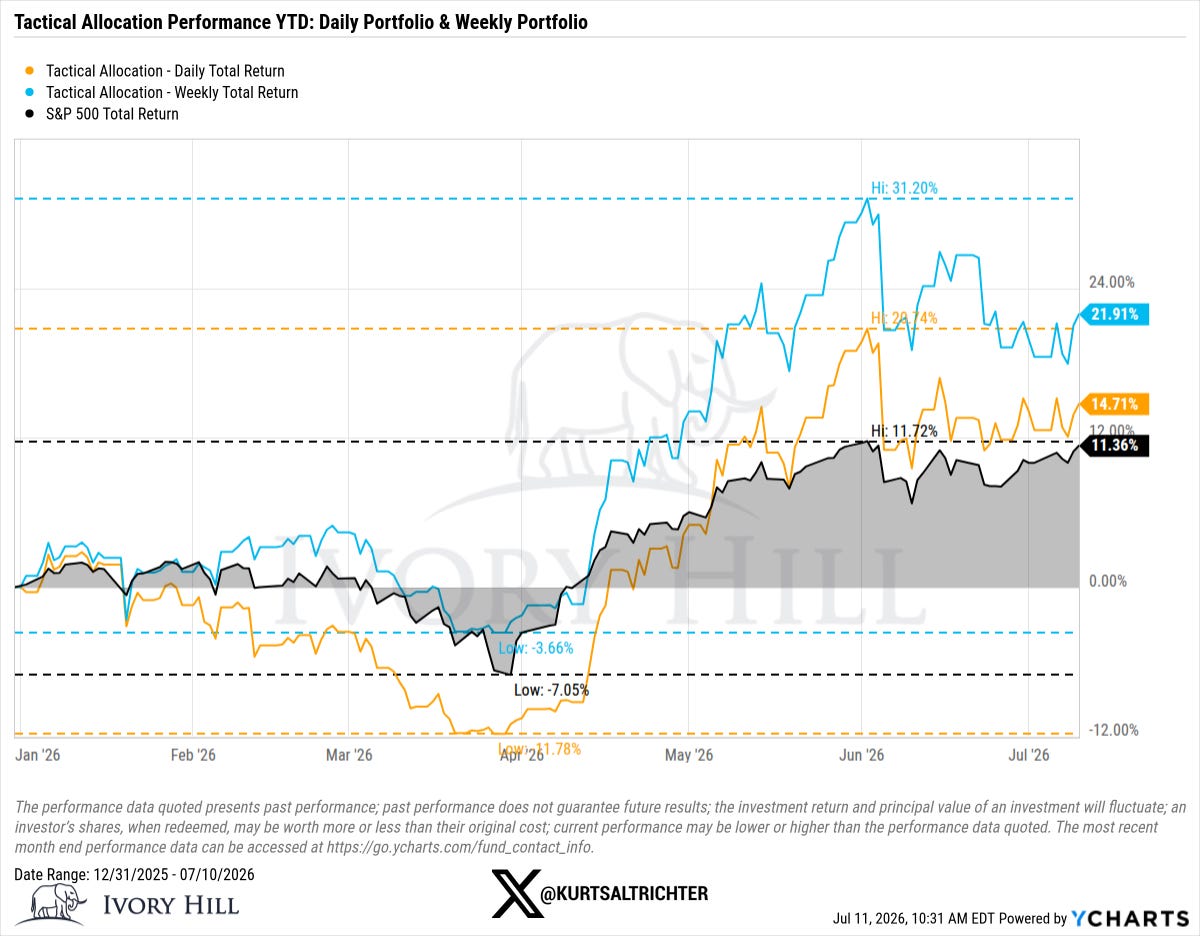
Tactical Allocation. Weekly proxy +21.91% on the year, daily +14.71%, S&P 500 +11.36%. Both beat the index this week. Fully invested always, so read it as a beta and regime barometer rather than just a performance metric.
And remember - The one fact pertaining to all conditions is that they will change.
Feel free to use me as a sounding board.
Follow me on X for more updates.
Best regards,
Schedule a call with me by clicking HERE
Kurt S. Altrichter, CRPS®
Wealth Advisor | President
Disclosure
The Gamma Report is published by Ivory Hill, LLC. All opinions and views expressed in this report reflect our analysis as of the date of publication and are subject to change without notice. The information contained herein is for informational and educational purposes only and should not be considered specific investment advice or a recommendation to buy or sell any security.
The data, models, and tactical allocations discussed in this report are designed to illustrate market structure and positioning trends and may differ from portfolio decisions made by Ivory Hill, LLC or its affiliates. Investing involves risk, including the possible loss of principal. Past performance is not indicative of future results.
Ivory Hill, LLC, and its members, officers, directors, and employees expressly disclaim any and all liability for actions taken based on the information contained in this report.