

For five weeks the gamma flip line sat beneath the market and dealers bought every dip. On Friday the market closed below it for the first time since early June. The dealers that absorbed every pullback are now positioned to amplify the next one, and Tesla, Alphabet and Intel report into that setup this week.
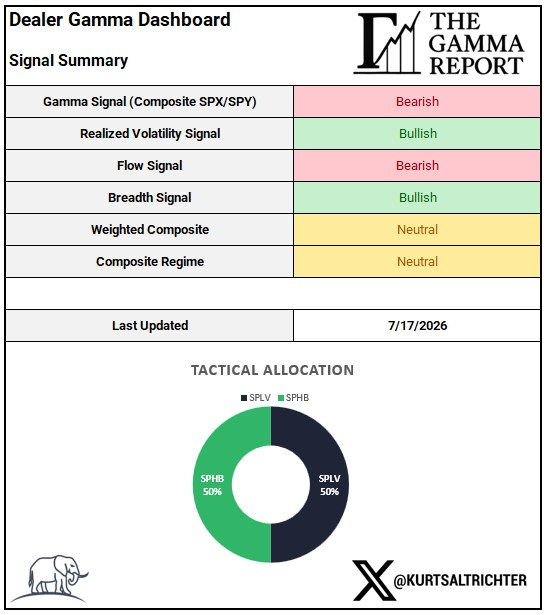
The model cut all leverage on Friday’s close and moved to 50% SPLV / 50% SPHB, down from 75% SPHB / 25% SPXL. It did not wait for a Monday gap; the composite dropped to Neutral the moment the tape lost the line. The structure weakened even as realized volatility fell and breadth rose, which is why the book stayed half in high beta. The risk is timing: beneath the flip line, low volatility is the fuel for the next move, and it meets positioning already stretched near extreme long, days before the heaviest earnings and month-end prints of the quarter.
Signal Dashboard
Gamma turned bearish and flow turned bearish, while realized volatility and breadth stayed bullish, so the weighted composite lands Neutral, down from Risk-On last week.
Market Recap
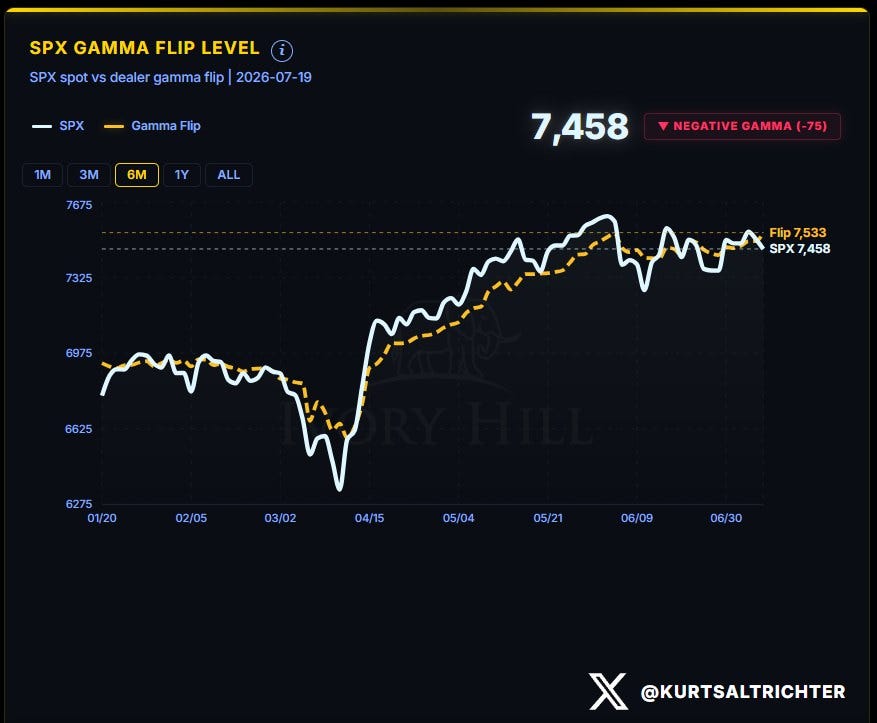
Last week the flip line was 7,497 with the market 78 points above it; this week the flip line is 7,533 and the market fell to 7,458, and the two crossed on Thursday. It rolled over on its own weight, grinding to 7,572 Wednesday before losing the line and closing Friday at 7,458, down 1.54% on the week and back to +8.94% on the year. Above the line dealers buy weakness, below it they sell it, so the cushion that held the tape through June is gone right as tech earnings hit.
Weekly Expected Move
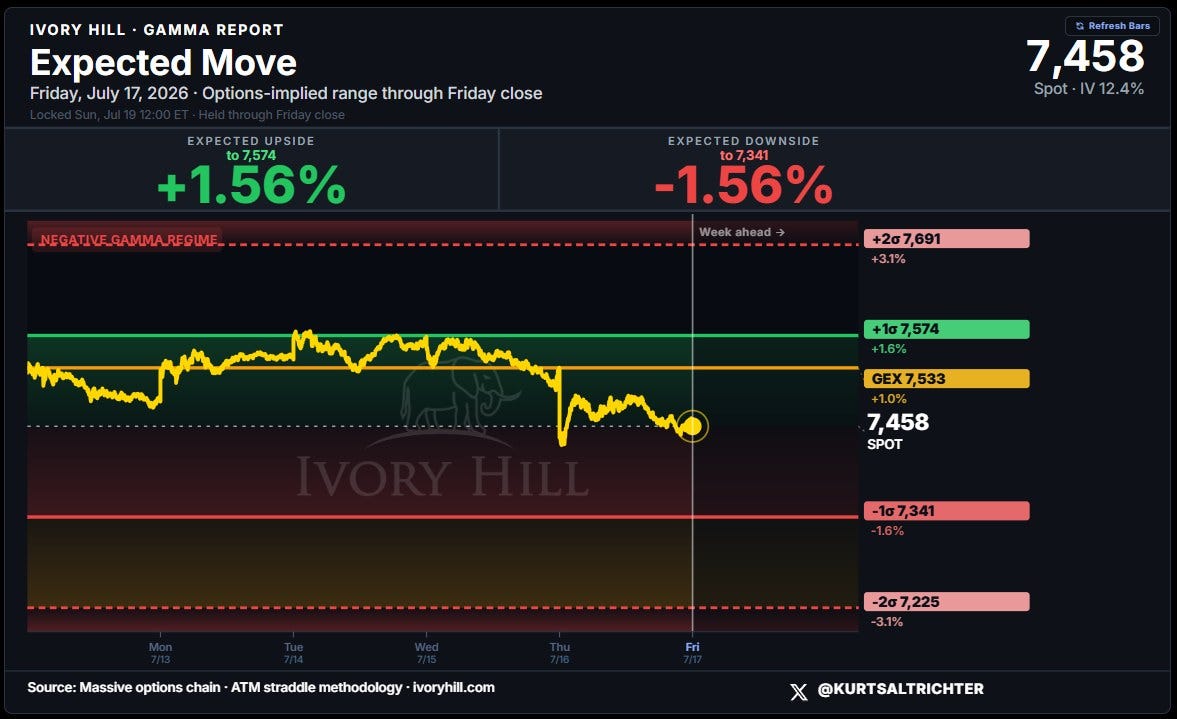
The chain prices a symmetric week, +1.56% to 7,574 and -1.56% to 7,341, on 12.4% implied vol, with the flip line at 7,533 just above spot. In negative gamma the downside band fills faster, because dealer hedging pushes in the same direction as the move.
Cross-Asset Performance
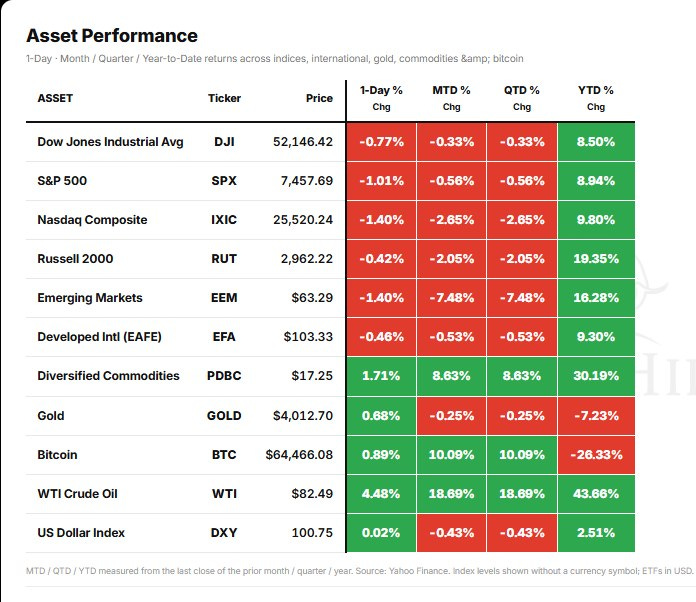
The index gave back 1.5%, and the month-to-date column tells the story the year-to-date hides: the Nasdaq is down 2.65% and emerging markets 7.48%, while oil is up 18.69% on the month and 43.66% on the year. Leadership has narrowed to energy on a crude spike, with gold at -7.23% and Bitcoin at -26.33% for the year.
Implied Correlation
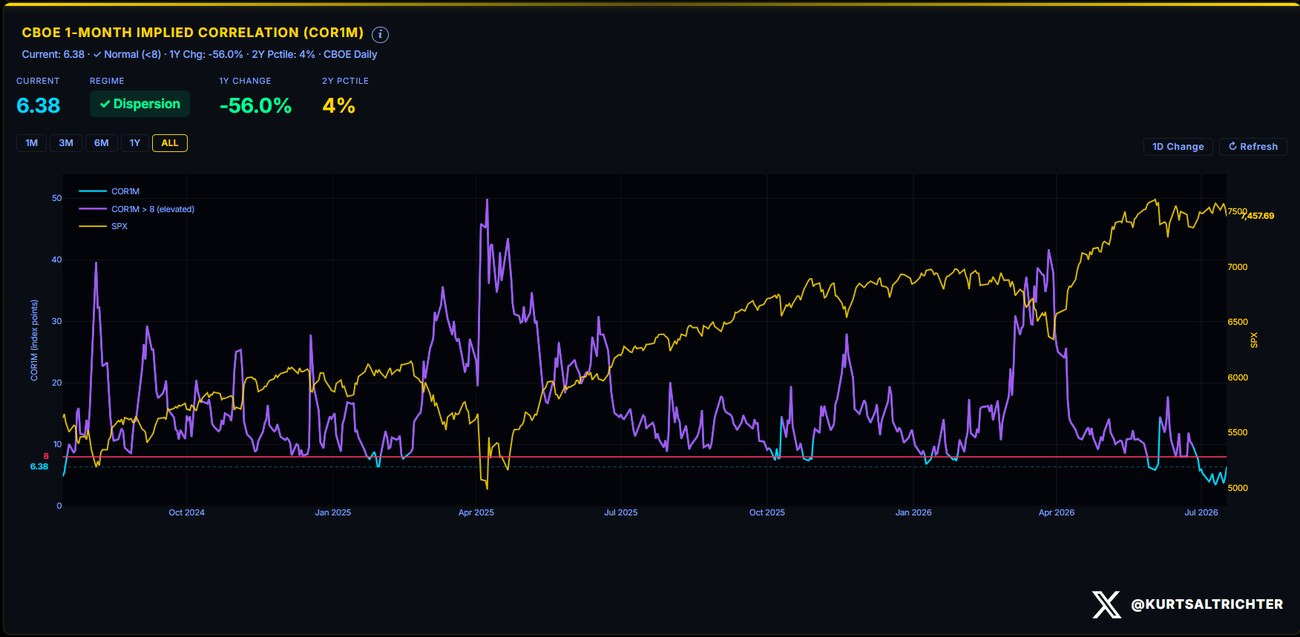
One-month implied correlation is 6.38, still a dispersion regime in the fourth percentile of two years, but it nearly doubled off last week’s 3.44. When it lifts off the floor in the same week the tape loses the flip line, names stop trading on their own stories and start moving together; it is not there yet, but it is the tell to watch.
Earnings
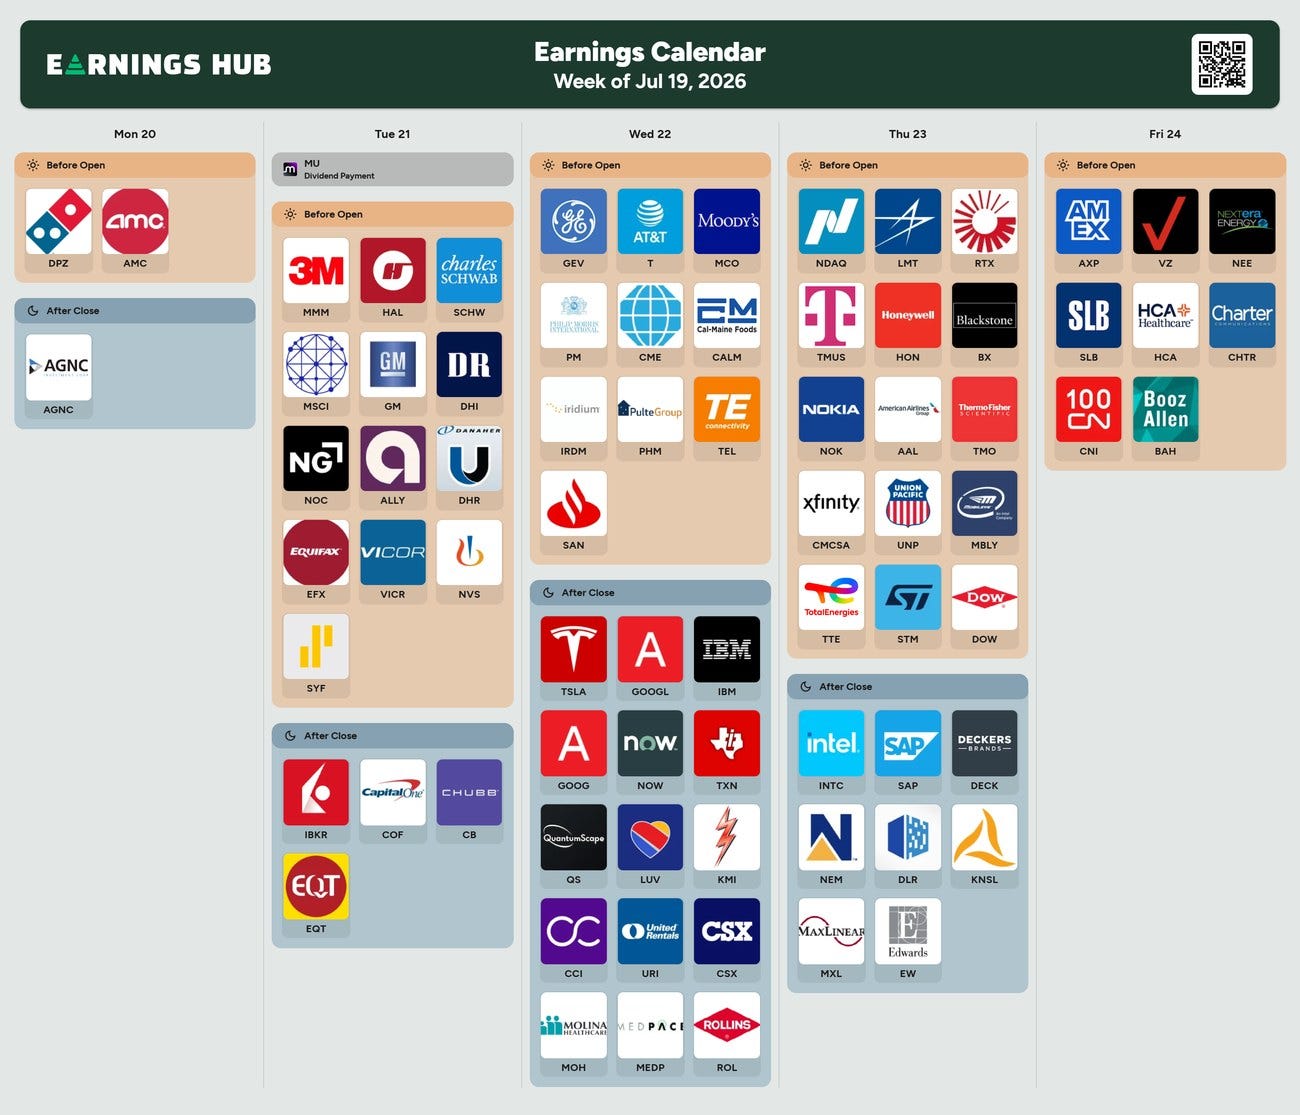
This week the market weight reports: Tesla, Alphabet, IBM, ServiceNow, and Texas Instruments Wednesday after the close, Intel and SAP Thursday. Technology is the largest index weight and it broke down into the exact week it has to report, so on a short-gamma tape a miss has no cushion and a beat squeezes.
Economic Calendar & Short-Dated Vol
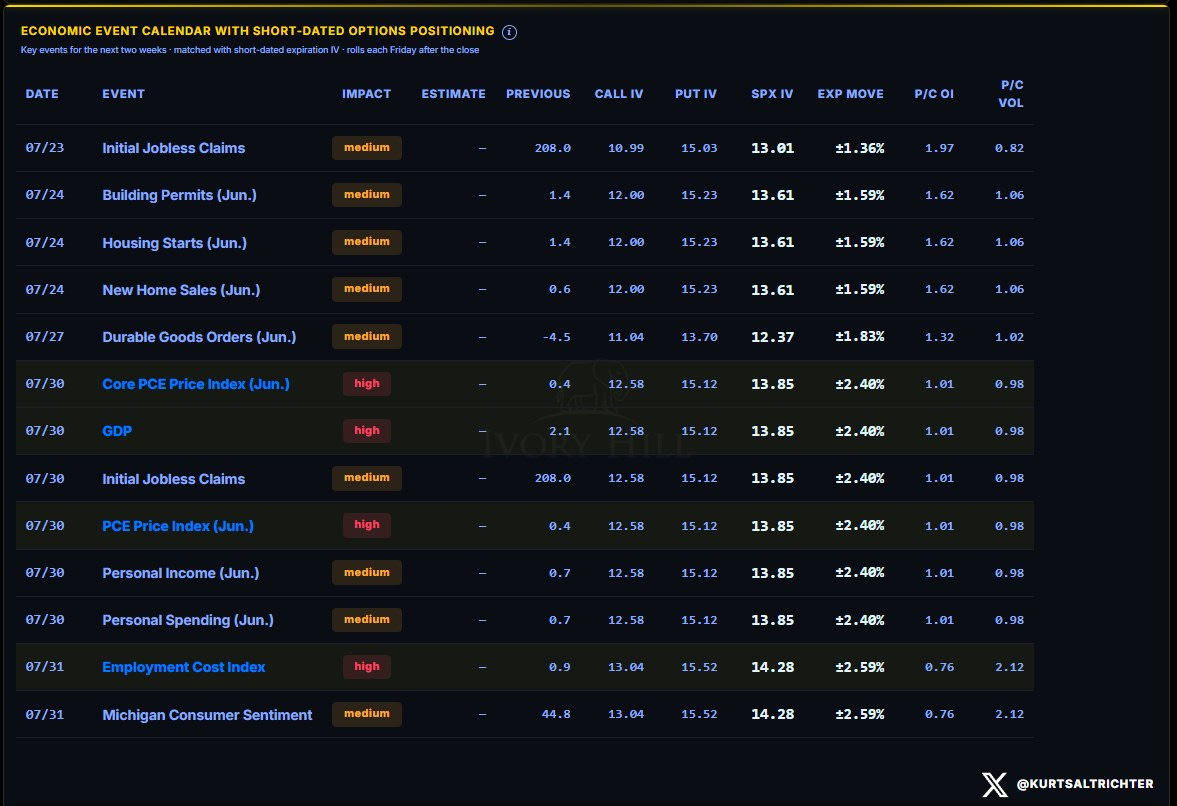
This week is quiet on data, with only jobless claims Thursday and housing Friday. The event is the month-end cluster: Core PCE and GDP on July 30, the Employment Cost Index on July 31. Short-dated SPX implied vol is 11.36%, and the term structure ramps into those dates, with the options-implied move widening from ±1.36% around Thursday’s claims to ±2.59% by the ECI print.
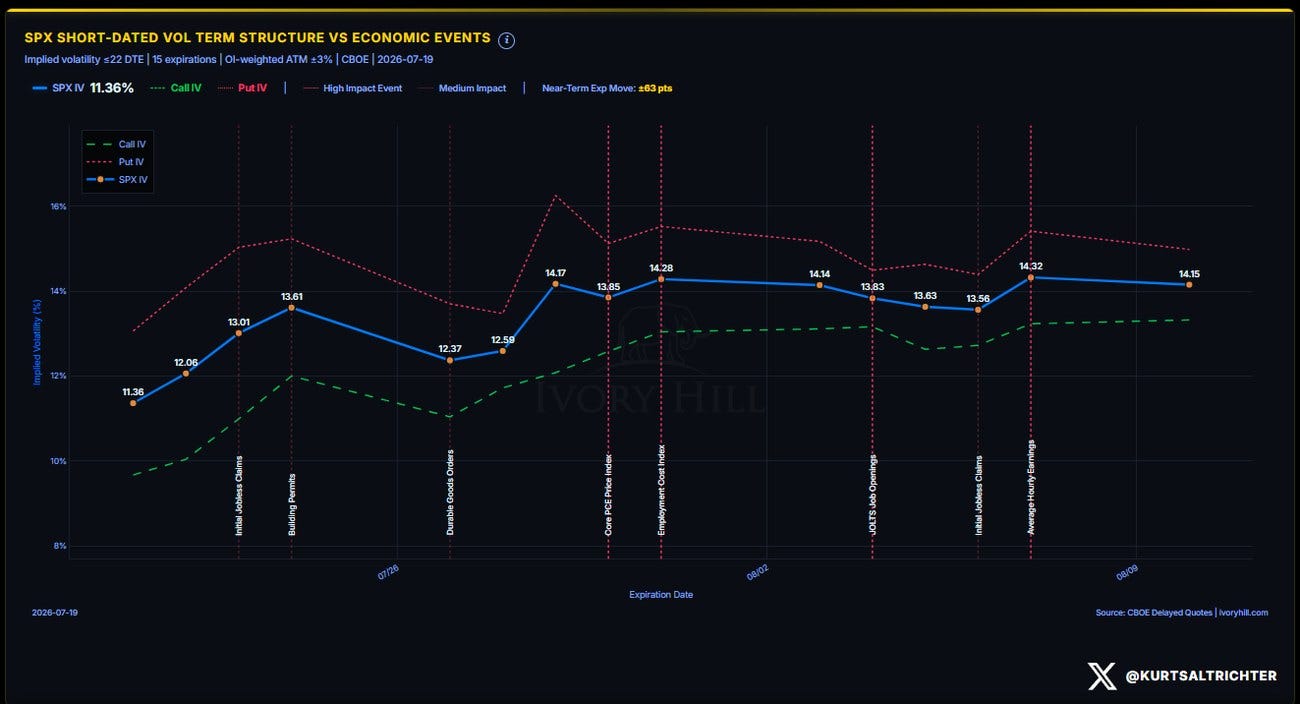
The positioning underneath the calendar is skewed to the downside. Put implied vol sits above call implied vol across the curve, and the put-to-call volume ratio jumps to 2.12 into the July 31 print from 0.82 around this Thursday. The market is not paying for this week; it is buying downside protection for month-end, and with crude up 18.69% on the month the PCE print is the one that can move it. This is where negative gamma concentrates the risk: short-dated vol is where dealer hedging bites, and it is rising into the two prints that matter.
Sector & Single-Name Momentum
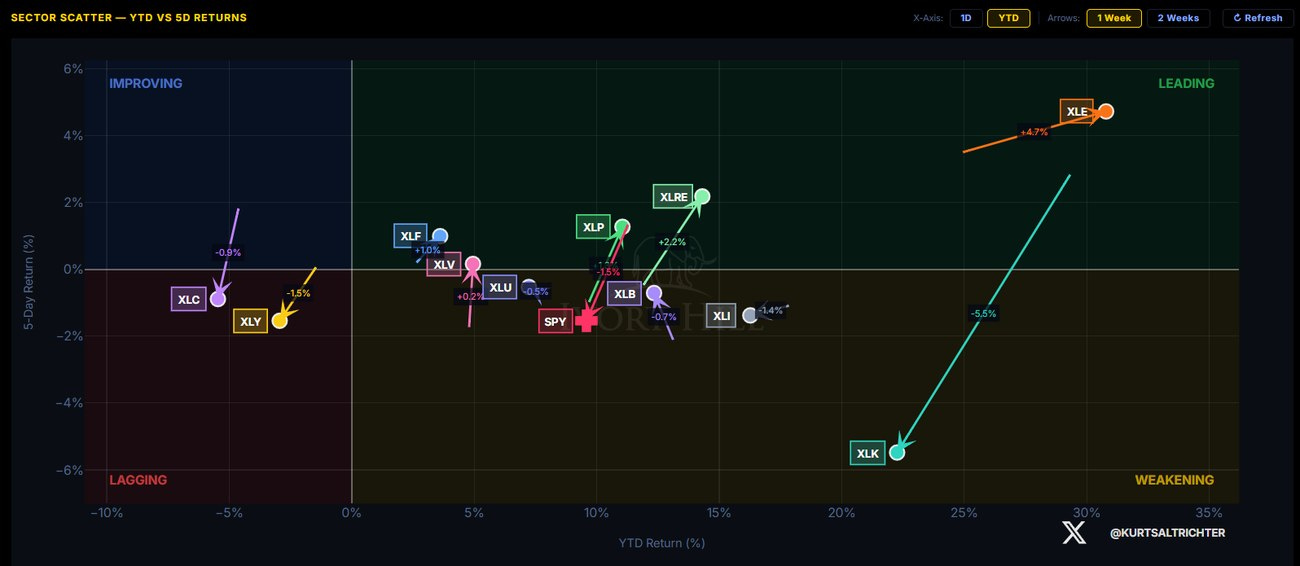
Energy led the week, up 4.7% and sitting alone at +31% on the year, while technology fell 5.5%, the worst move on the board and from the highest perch. Money did not leave the market, it left the biggest thing in it and crowded into the one sector levered to $82 oil, and rotations out of tech leave a mark because nothing is large enough to replace it.
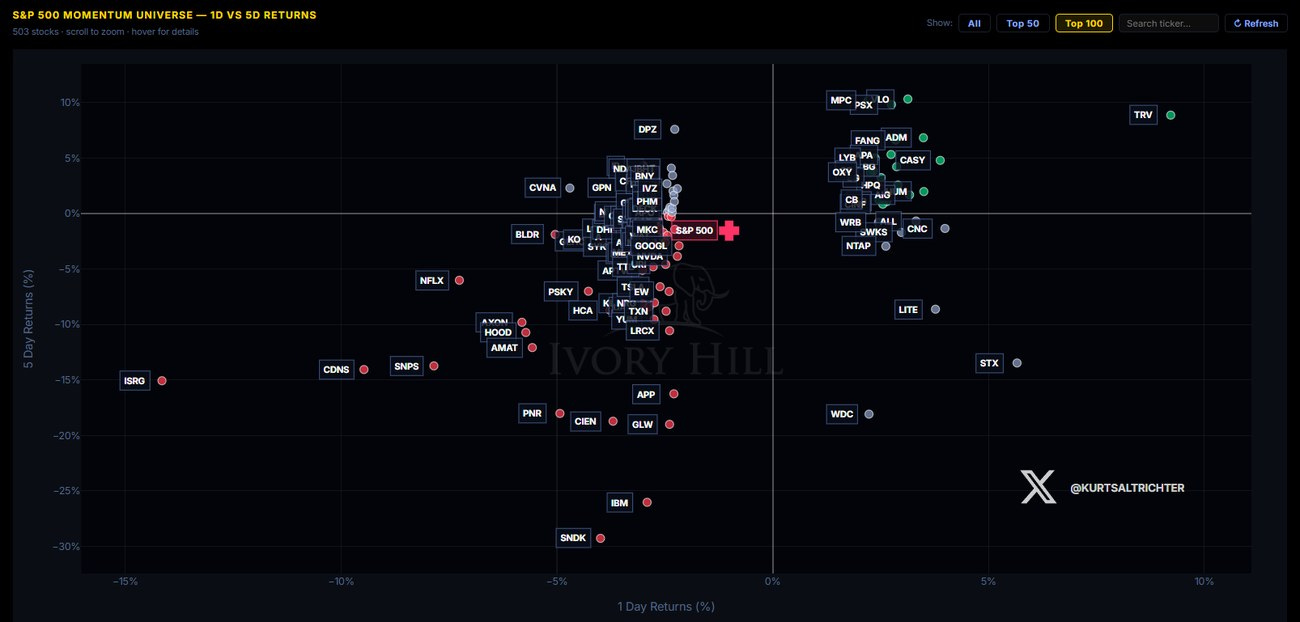
The damage was concentrated in the right names to worry about: Synopsys, Cadence, Lam Research, Applied Materials, and Texas Instruments deep in the red, Netflix down hard, and Intuitive Surgical off 15%, the week those highest-multiple names have to defend them.
Volatility Regime
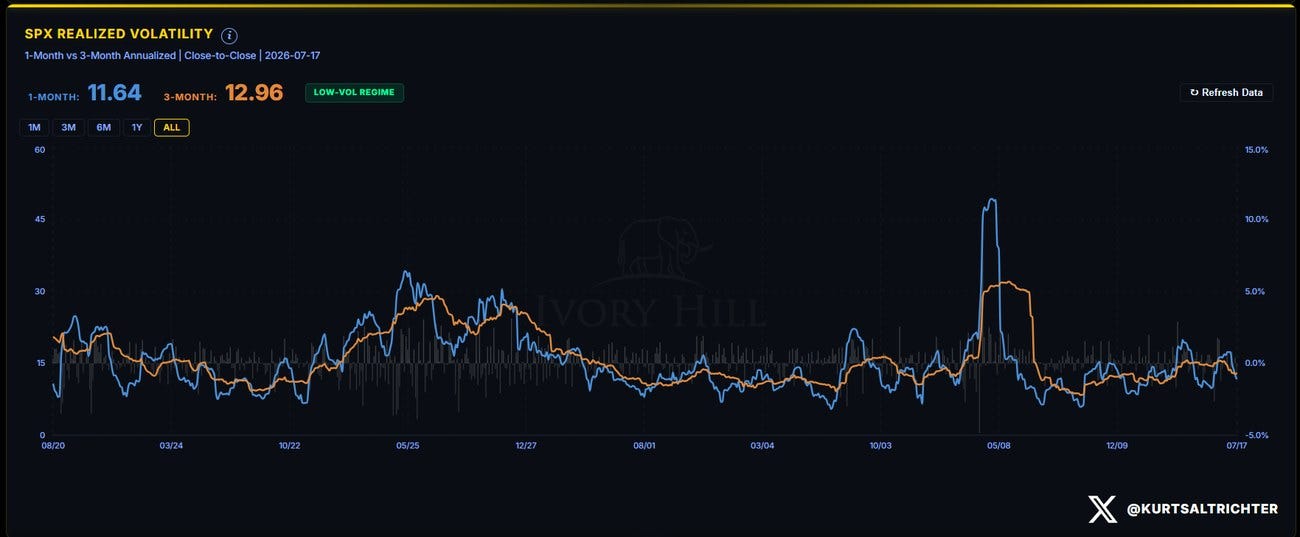
Realized volatility fell, one-month at 11.64 below three-month at 12.96, a low-vol regime that greenlights vol-control funds and kept the composite from going defensive. Above the flip line that calm is self-reinforcing, because dealers suppress every move; beneath it, with no dealer bid leaning against the first real move, low volatility can expand quickly, and 7,533 decides which way it breaks.
Systematic Fund Flows
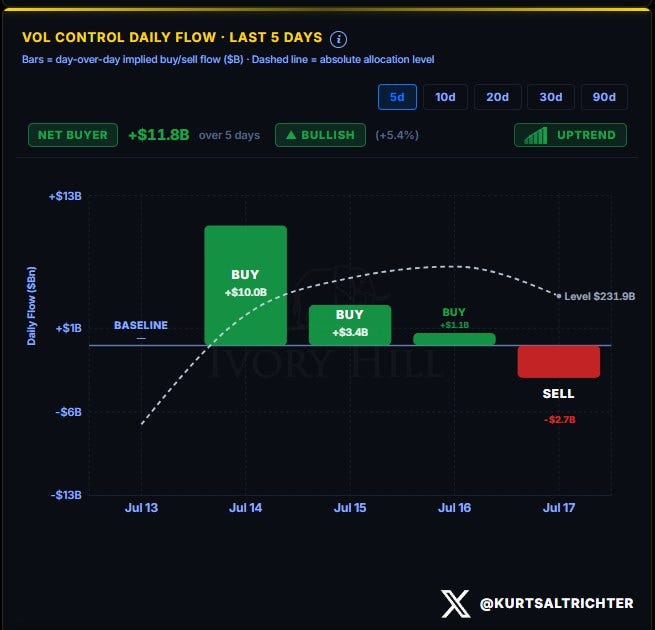
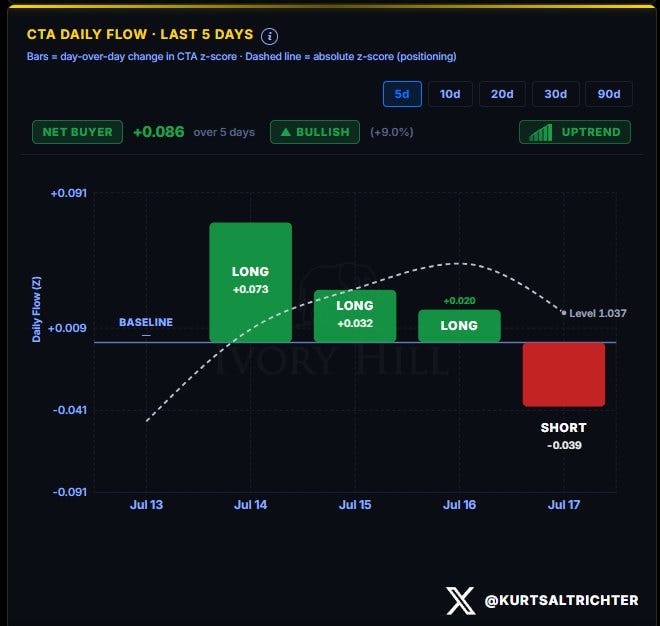
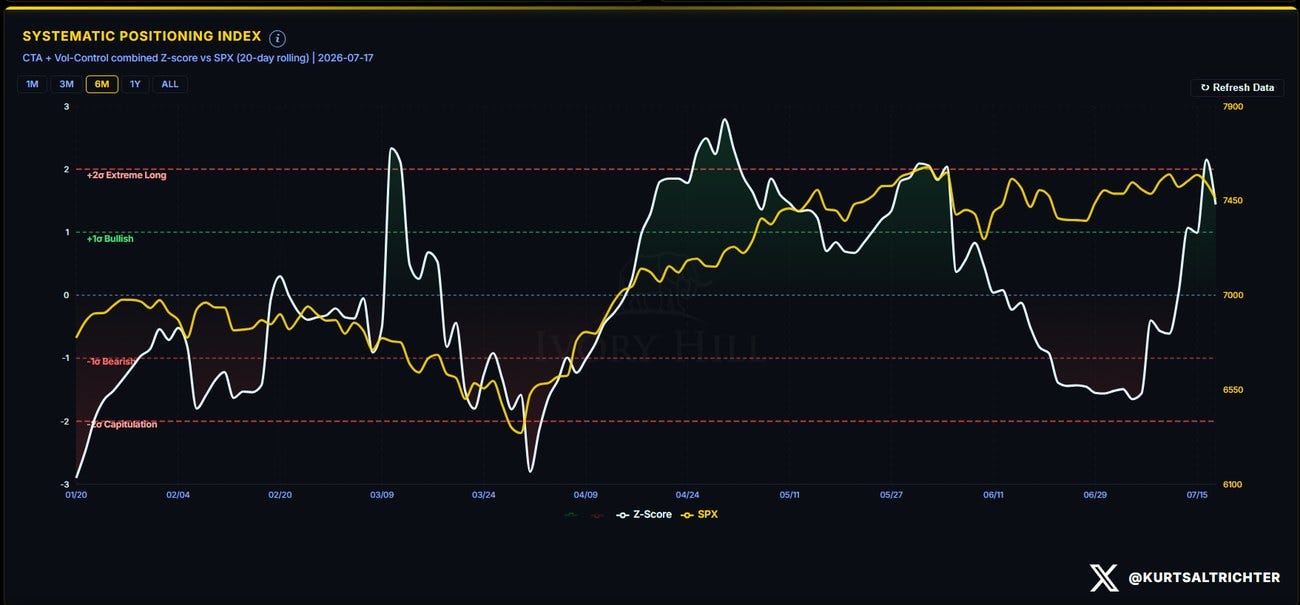
Vol-control funds bought $10.0B Tuesday, $3.4B Wednesday, and $1.1B Thursday, then sold $2.7B Friday, and CTAs ran the same path from long to short on the day the tape lost the line. For six weeks the systematic bid was the story; that money is now in, and when it flips from buyer to seller in negative gamma it stops being a tailwind and becomes an accelerant.
Market Breadth
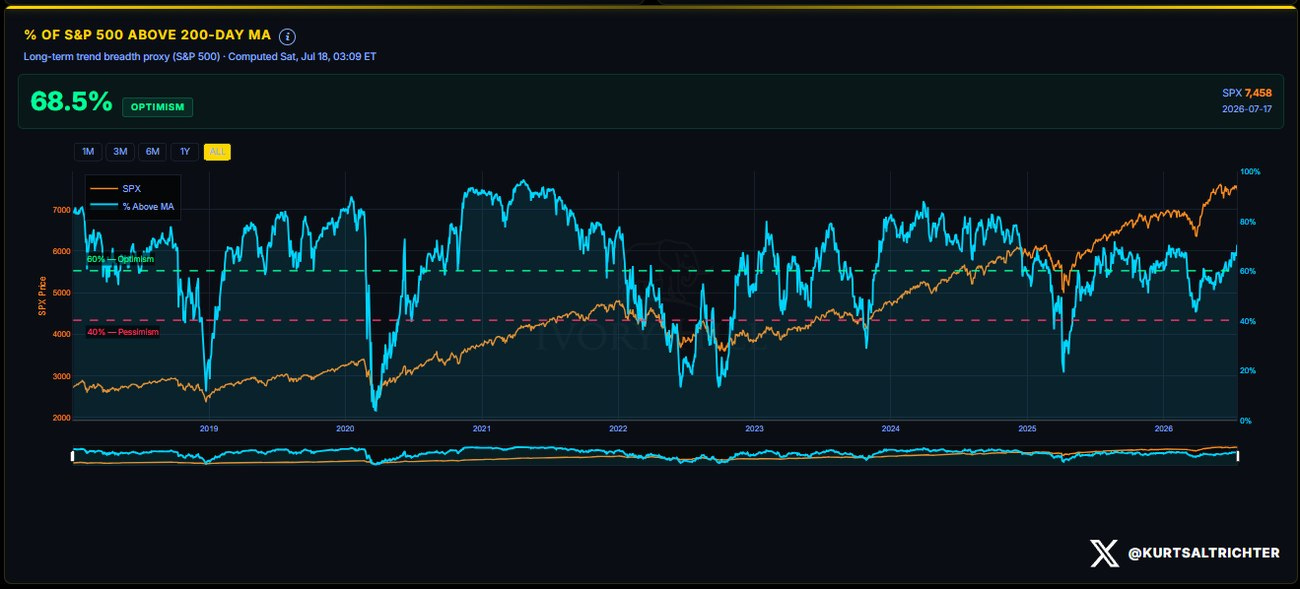
Breadth improved while the index fell, to 68.5% above the 200-day from 66.9%, which tells you the selling stayed inside the top-heavy tech names while the rest of the market held. The structure weakened this week, but participation is broad and the 40% pessimism line is nowhere close.
Tactical Allocation
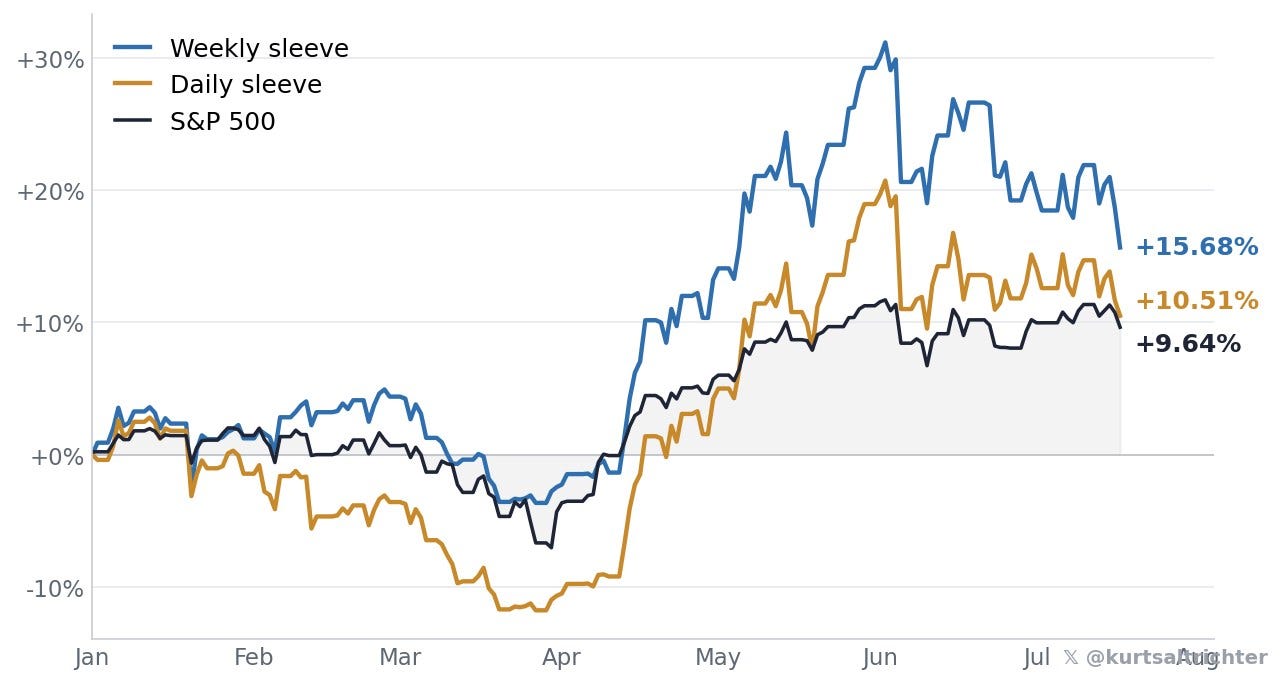
The book is now 50% SPLV and 50% SPHB, down from 75% SPHB and 25% SPXL; I cut the 3x leverage on Friday’s close. Both sleeves still lead the index on the year, and the discipline is to carry beta when the regime pays for it and cut it the moment it stops, which is what the model did Friday.
Bottom Line
Dealers are short gamma below the 7,533 flip line. Above it they cushion, below it they amplify, and we sit below it into tech earnings.
Realized vol is low at 11.64, and beneath the flip line that is energy waiting to release once a move starts.
Systematic flows bought all week and sold Friday, and positioning is near extreme long. The mechanical tailwind is spent.
Breadth is 68.5% and rising, so participation is still broad while the structure weakens.
Tech broke 5.5% into the week it has to report, and energy leads on $82 crude.
The allocation is 50% SPLV, 50% SPHB. Neutral, by design.
And remember: the one fact pertaining to all conditions is that they will change.
Feel free to use me as a sounding board.
Follow me on X for more updates.
Best regards,
Schedule a call with me by clicking HERE
Kurt S. Altrichter, CRPS®
Wealth Advisor | President
Disclosure
The Gamma Report is published by Ivory Hill, LLC. All opinions and views expressed in this report reflect our analysis as of the date of publication and are subject to change without notice. The information contained herein is for informational and educational purposes only and should not be considered specific investment advice or a recommendation to buy or sell any security.
The data, models, and tactical allocations discussed in this report are designed to illustrate market structure and positioning trends and may differ from portfolio decisions made by Ivory Hill, LLC or its affiliates. Investing involves risk, including the possible loss of principal. Past performance is not indicative of future results.
Ivory Hill, LLC, and its members, officers, directors, and employees expressly disclaim any and all liability for actions taken based on the information contained in this report.