

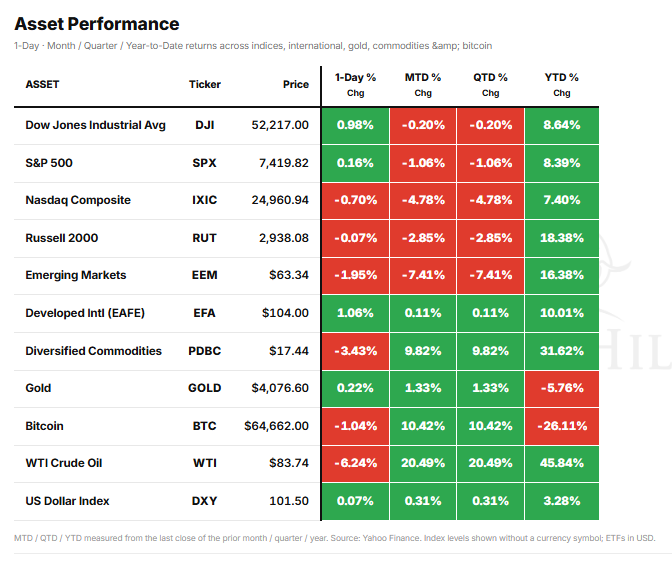
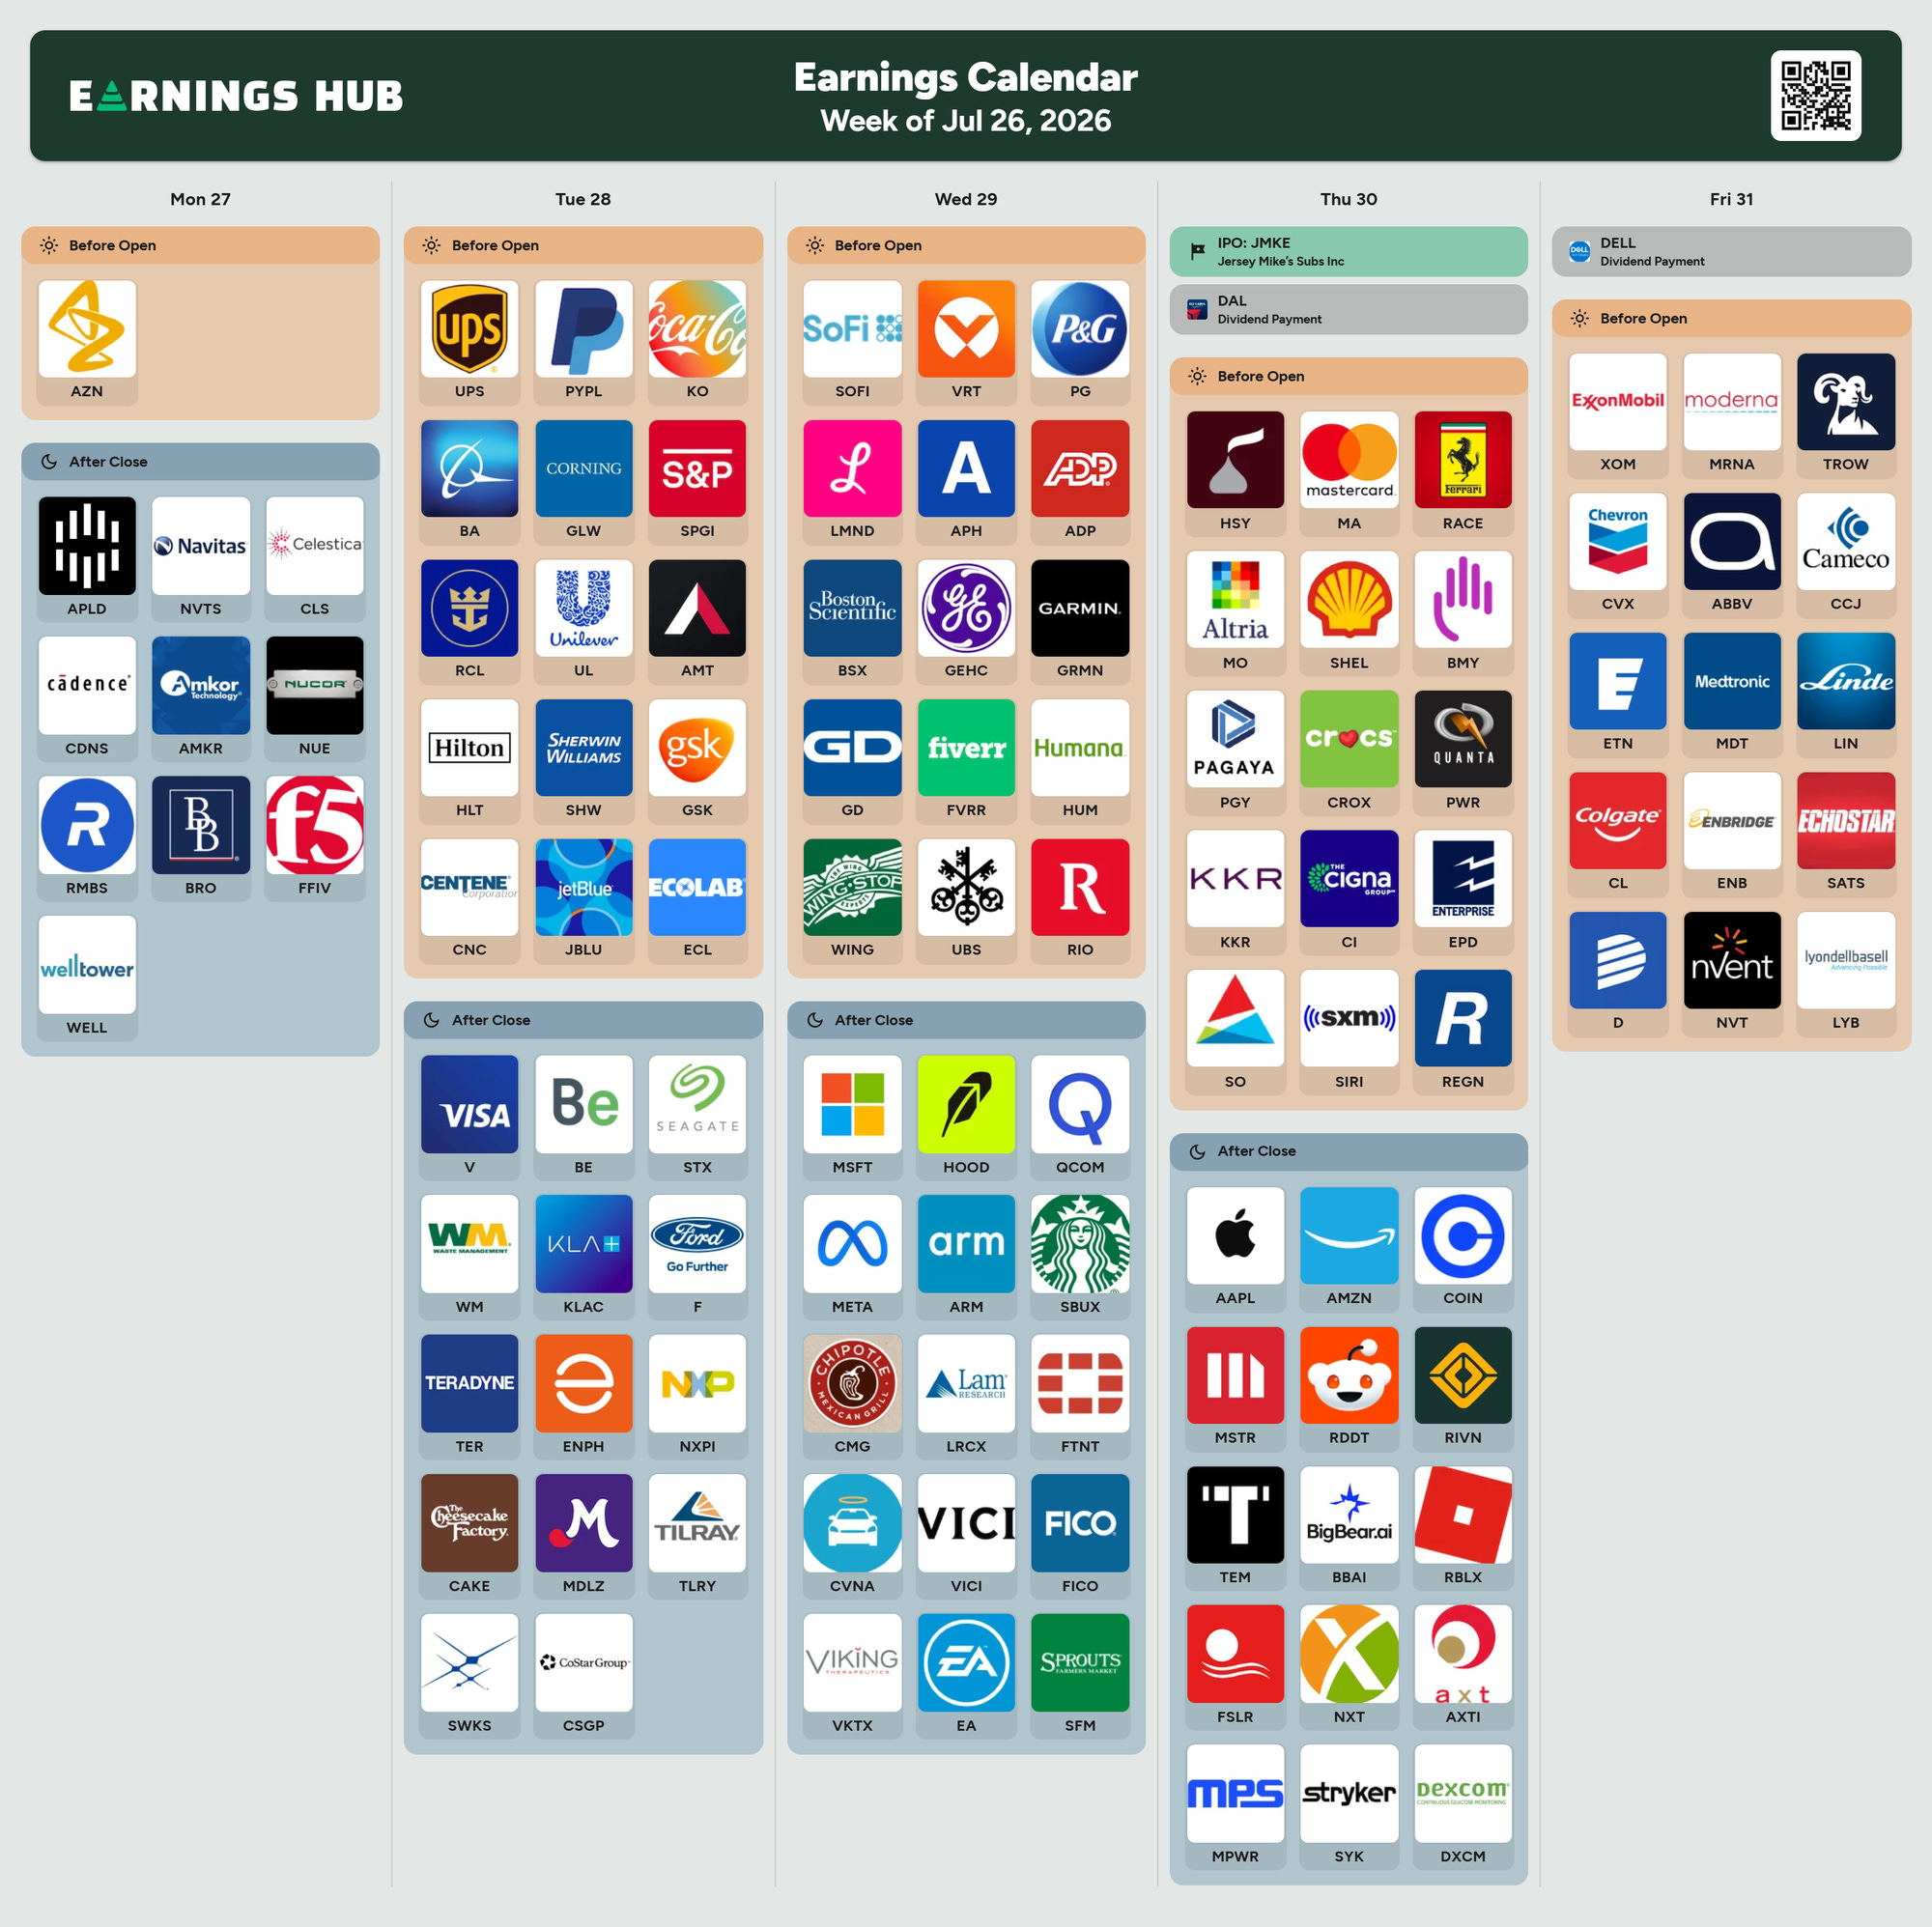
The Nasdaq fell behind the S&P 500 on the year last week, 7.40% against 8.39%, after giving up 4.78% this month. The index itself lost 0.51%. Microsoft and Meta report Wednesday after the close, Apple and Amazon Thursday. Four names that size moving the same direction at once is precisely what ends a dispersion regime.
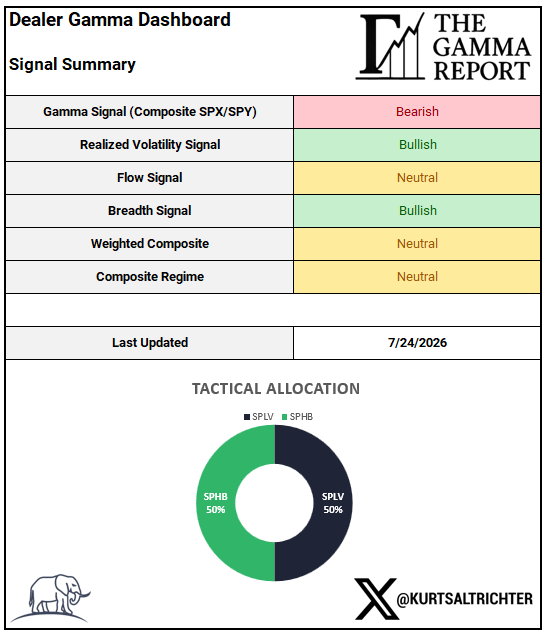
The allocation stays 50% SPLV / 50% SPHB, Neutral for a second week. SPX sits 61 points beneath the 7,465 flip line, so dealers amplify weakness rather than absorb it.
Signal Dashboard
Gamma stayed bearish, flow improved from bearish to neutral, and realized volatility and breadth stayed bullish. The weighted composite lands Neutral for a second week, and the allocation did not change.
Market Recap
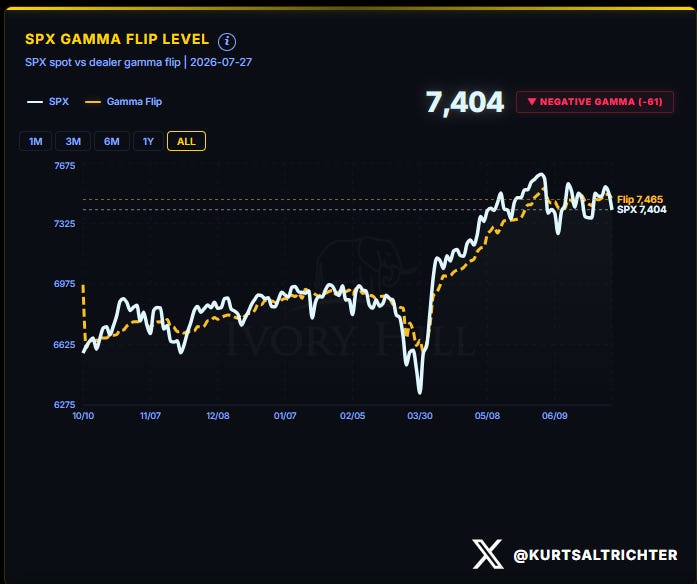
Last week, the flip line was 7,533, with the market 75 points below it; this week, the flip is 7,465, and Monday’s spot is 7,404, 61 points below.
Weekly Expected Move
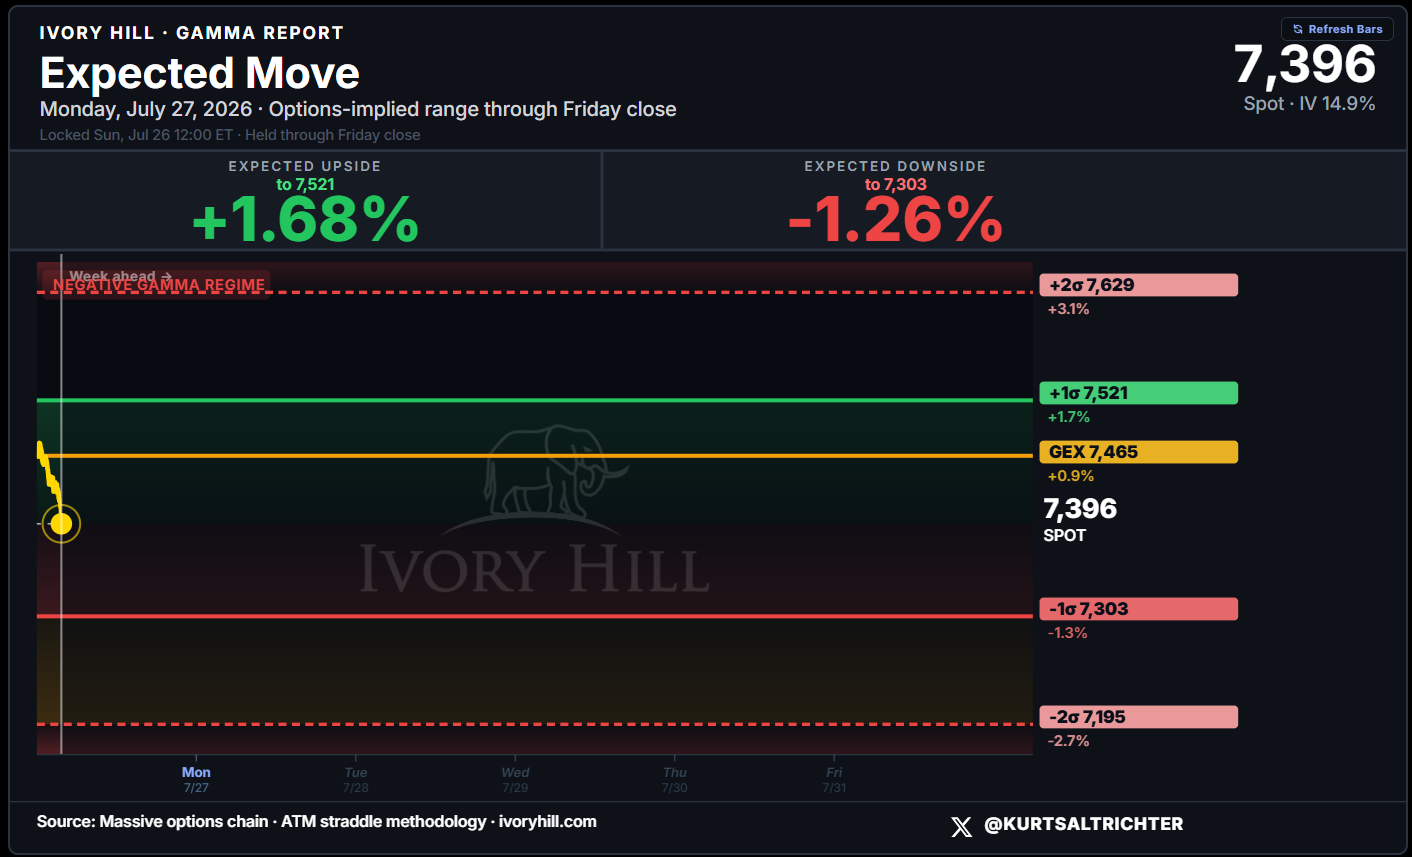
The bands locked at 7,521 and 7,303, ±1.47% around a 7,412 midpoint. Spot has since drifted to 7,396, which is why the upside now reads +1.68% and the downside -1.26%.
Cross-Asset Performance
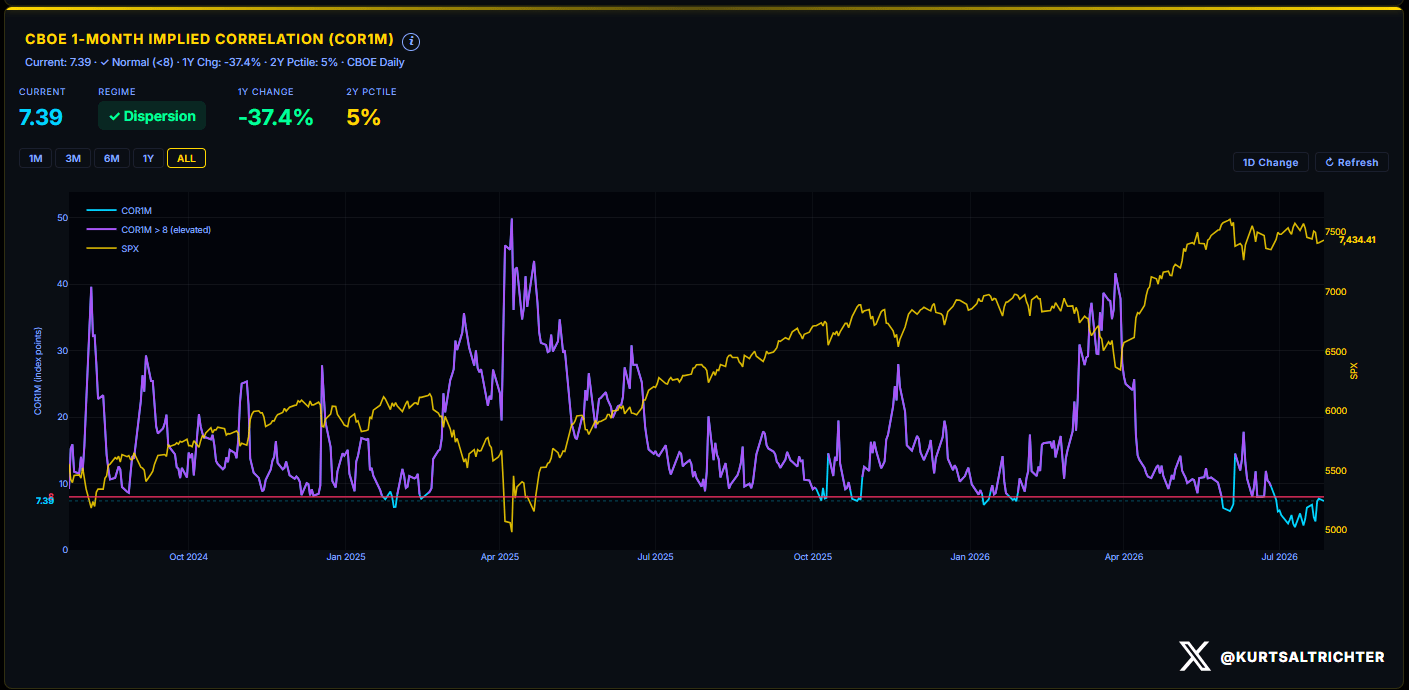
Implied Correlation
One-month implied correlation is 7.39, up from 6.38 last week and 3.44 the week before. Two straight weeks higher and now within 0.61 of the 8 line that separates dispersion from an index that trades as one thing. Last week I called this the tell to watch; it is still climbing and still below the line.
Earnings
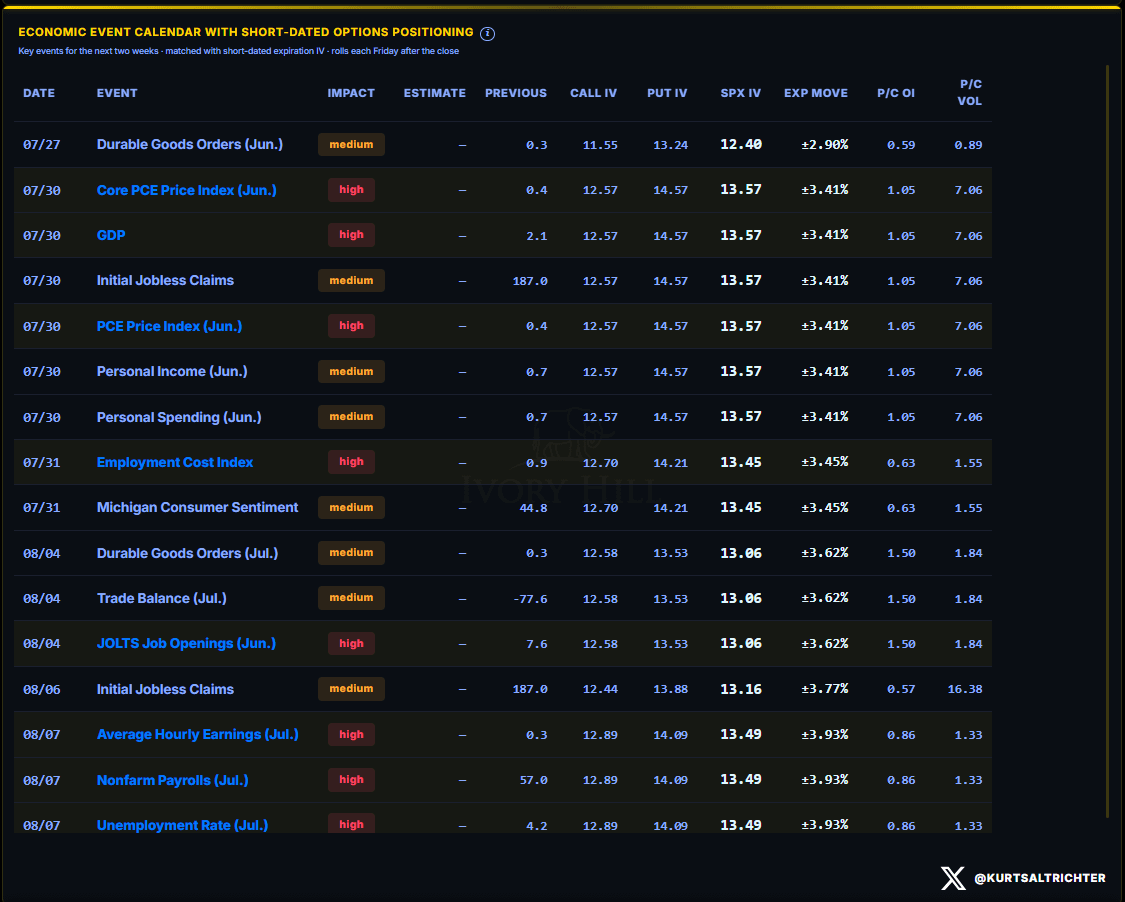
Economic Calendar & Short-Dated Vol
Thursday is the print: Core PCE and GDP together, with jobless claims, personal income and personal spending alongside. Friday brings the Employment Cost Index.
Sector & Single-Name Momentum
Energy leads at roughly +30% on the year, up 1.8% on the week and alone in the leading quadrant. Technology is at +20% and falling, off 1.5%.
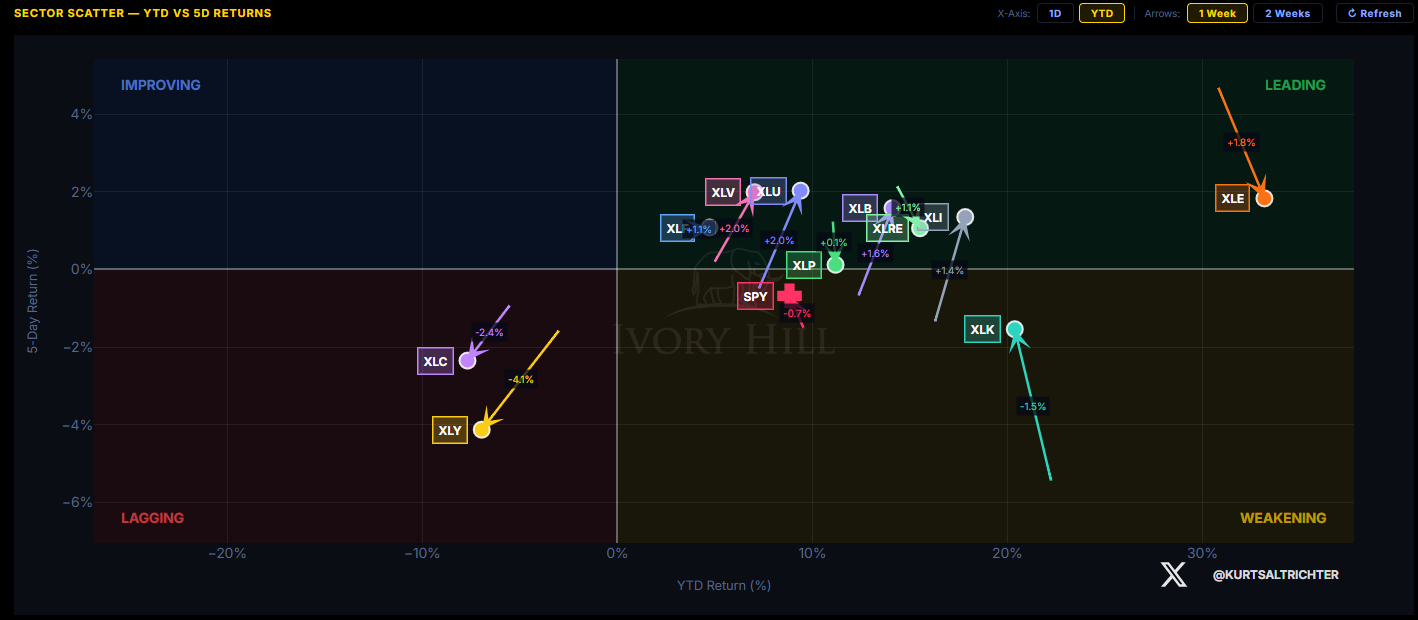
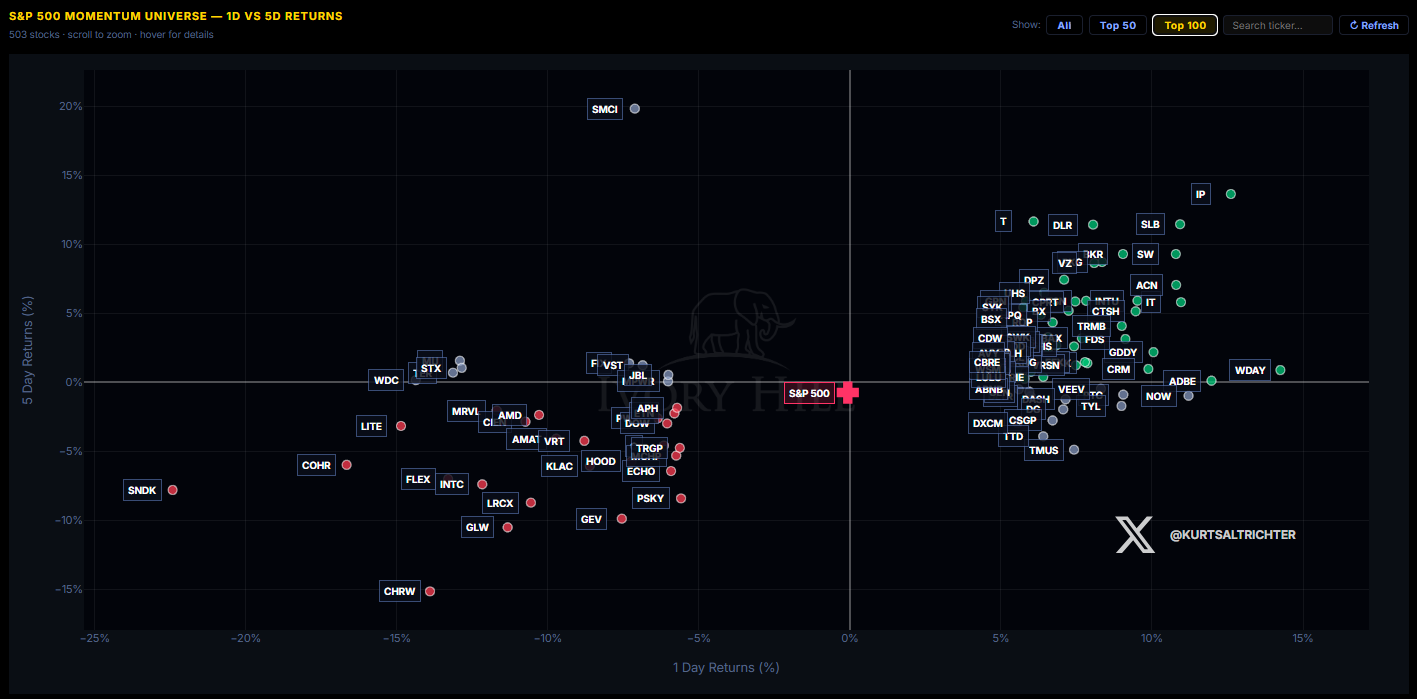
Underneath, the split is not technology against everything else. It is AI hardware against everything else. SanDisk, Coherent, Lumentum, Western Digital, Seagate, Intel, Lam Research, KLA, Applied Materials, AMD, Marvell and Corning occupy the bottom-left corner of the momentum universe together.
The top right is Workday, Adobe, Accenture, Cognizant, Gartner, SLB, International Paper, Digital Realty, AT&T and Verizon. Money is leaving the picks-and-shovels trade for software, services and yield. Lam Research, KLA, Corning and Seagate all report this week, and the market marked them down before they opened their mouths.
Volatility Regime
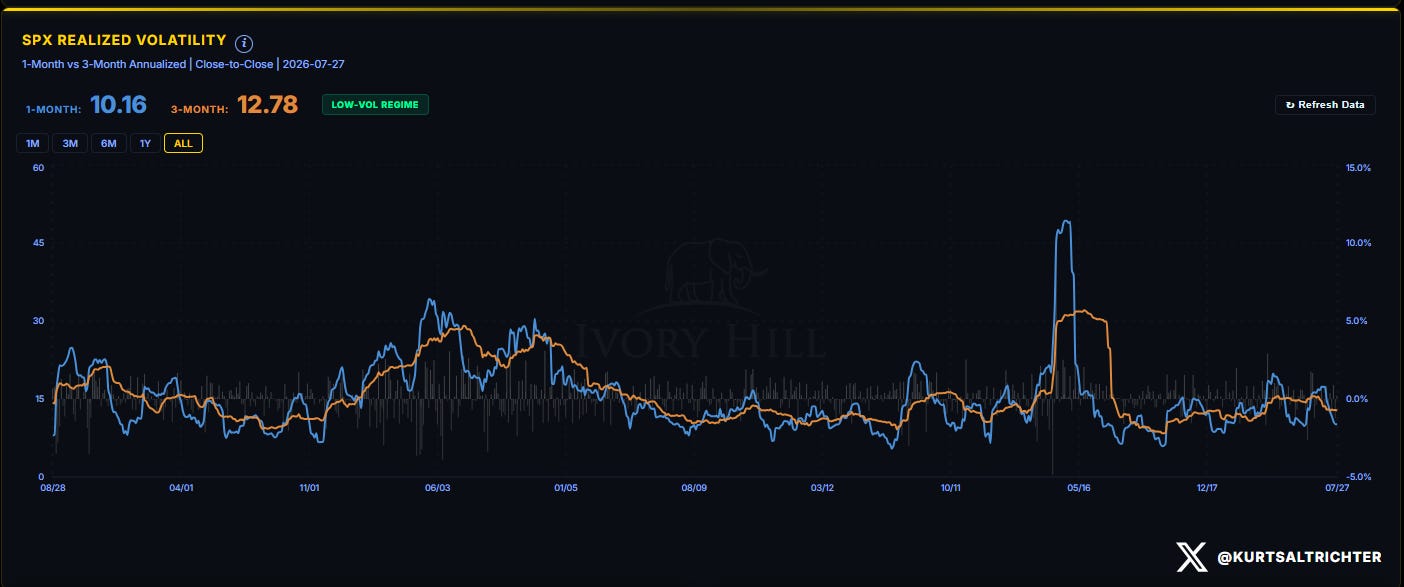
One-month realized volatility is now well beneath three-month at 12.78, which keeps the regime low-vol and keeps vol-control funds allocated.
Systematic Fund Flows
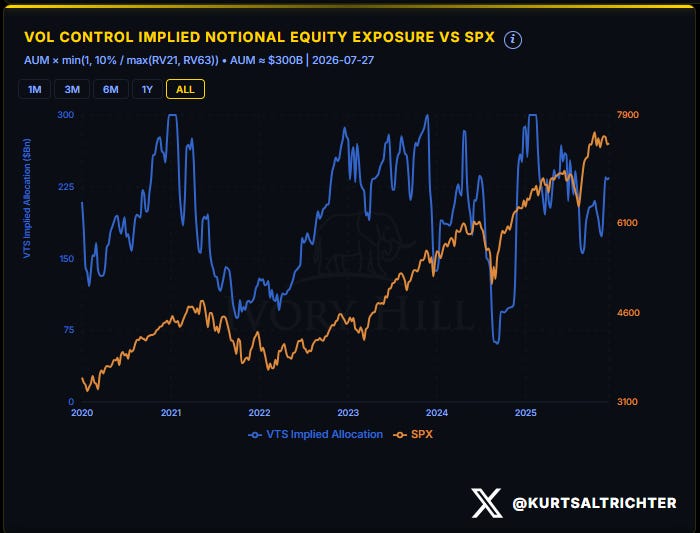
Vol-control implied allocation sits near $235 billion, roughly 78% of the $300 billion pool, because the formula keys off the higher of one-month and three-month realized vol, and three-month at 12.78 is what binds. Realized vol falling further adds no exposure from here until the three-month window follows it down.
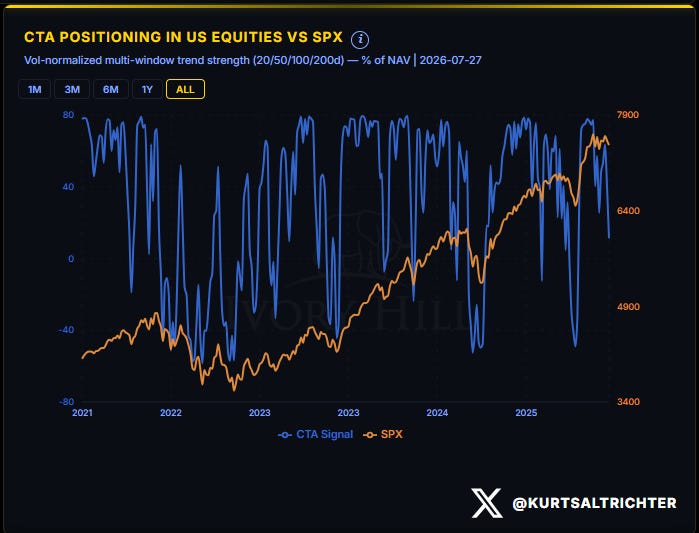
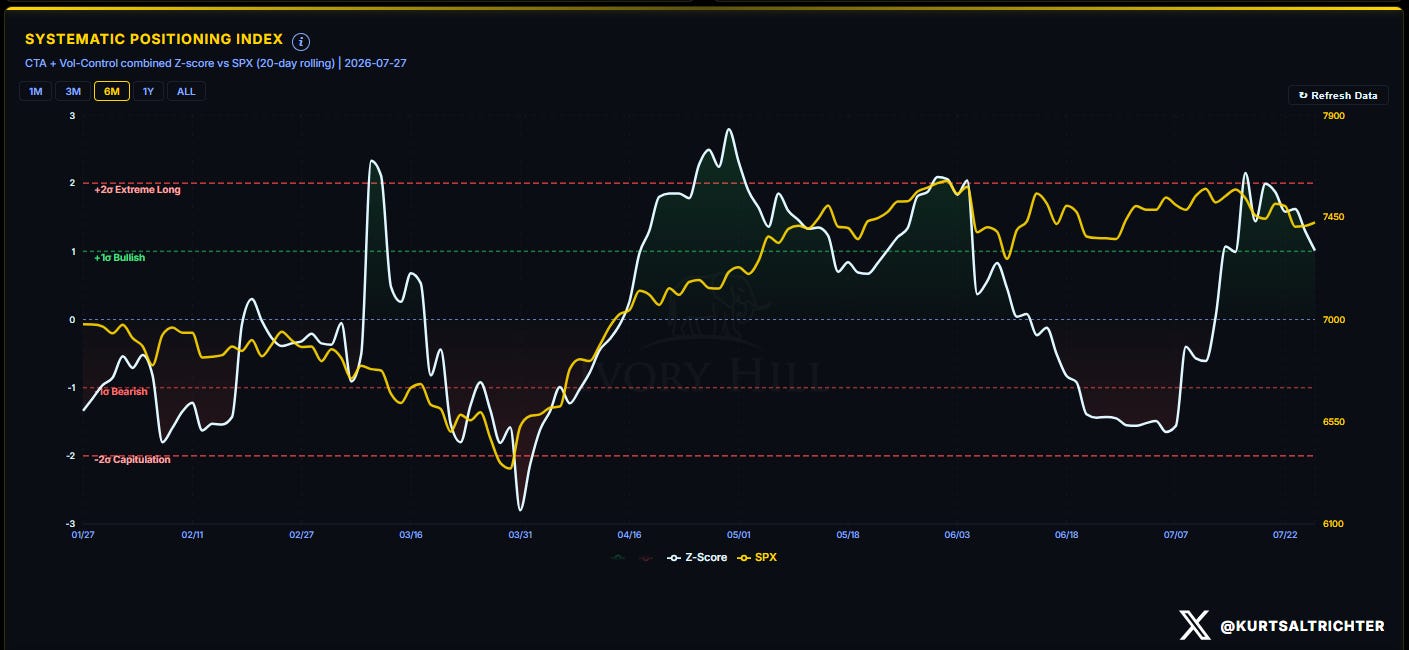
CTA trend positioning is the bigger change. The vol-normalized signal dropped from near the top of its range toward flat, and the combined systematic z-score is now roughly +1σ against near +2σ two weeks ago. The mechanical long that turned every June dip into a buy is half gone. That cuts both directions: less forced selling if this week breaks, and less forced buying if it holds.
Market Breadth
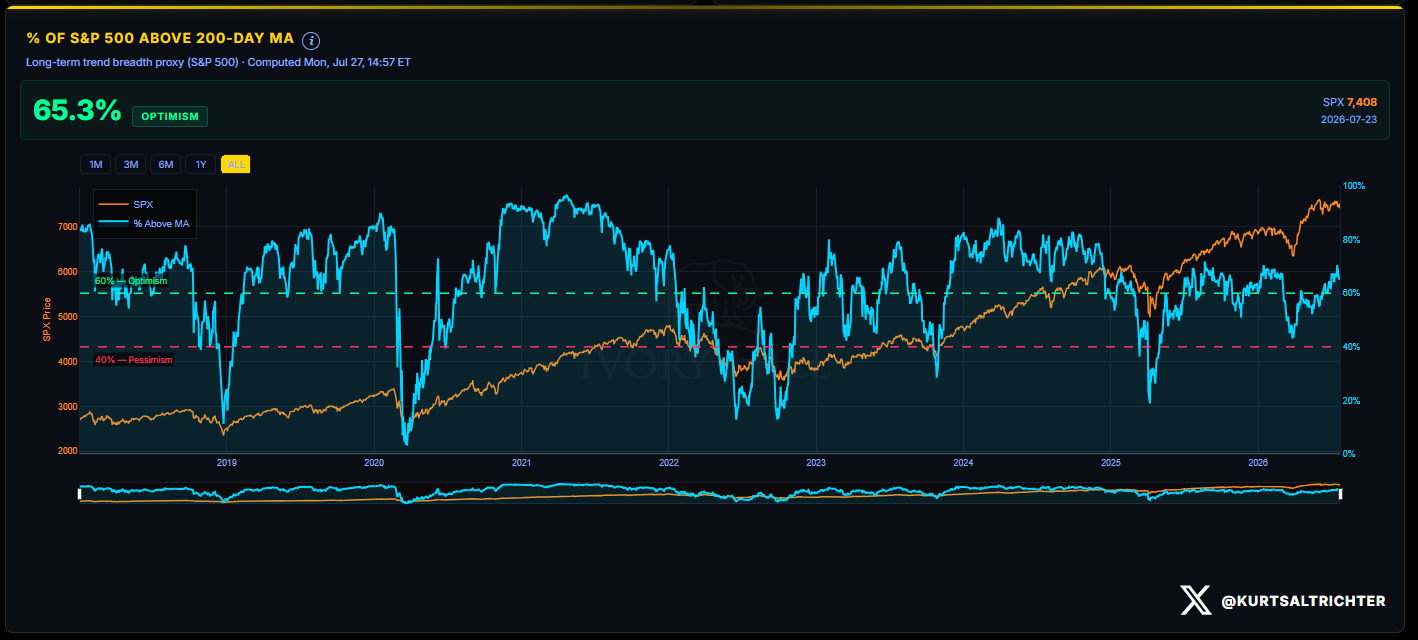
Breadth fell to 65.3% above the 200-day from 68.5%, still optimism territory and still nowhere near the 40% pessimism line.
Tactical Allocation
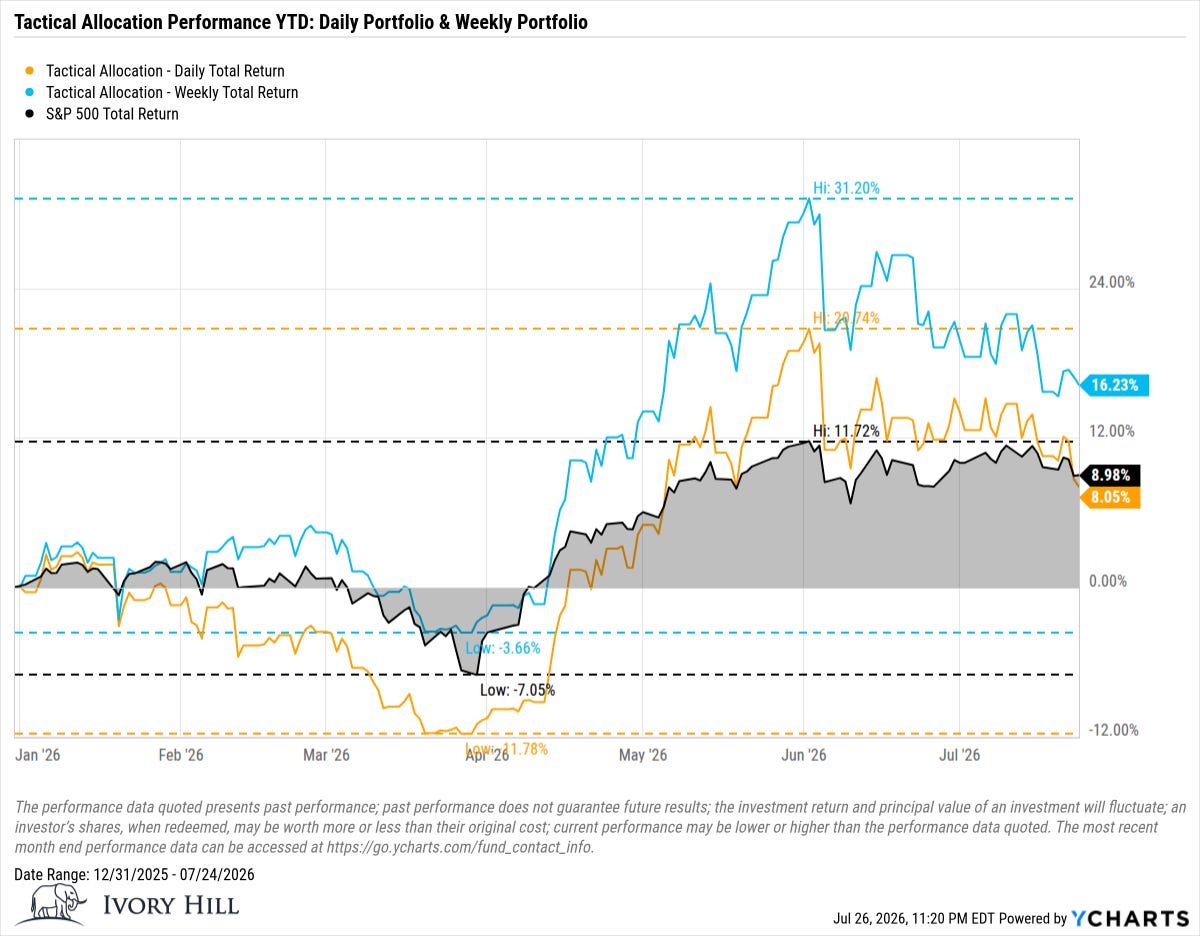
The allocation is 50% SPLV and 50% SPHB, unchanged. The weekly sleeve is +16.23% on the year against the S&P 500 total return at +8.98%, and it gained ground while the index lost it. The daily sleeve is +8.05% and slipped behind the index.
And remember: the one fact pertaining to all conditions is that they will change.
Feel free to use me as a sounding board.
Follow me on X for more updates.
Best regards,
Schedule a call with me by clicking HERE
Kurt S. Altrichter, CRPS®
Wealth Advisor | President
Disclosure
The Gamma Report is published by Ivory Hill, LLC. All opinions and views expressed in this report reflect our analysis as of the date of publication and are subject to change without notice. The information contained herein is for informational and educational purposes only and should not be considered specific investment advice or a recommendation to buy or sell any security.
The data, models, and tactical allocations discussed in this report are designed to illustrate market structure and positioning trends and may differ from portfolio decisions made by Ivory Hill, LLC or its affiliates. Investing involves risk, including the possible loss of principal. Past performance is not indicative of future results.
Ivory Hill, LLC, and its members, officers, directors, and employees expressly disclaim any and all liability for actions taken based on the information contained in this report.