

The S&P 500 closed Friday at 7,757.64, up 0.62% on the day and 13.32% year-to-date. Nasdaq Composite up 1.30% Friday and 14.84% for the year. The market gained back everything it lost. The S&P 500 ran 268 points off last week’s 7,490 close and now sits back in positive gamma. When the tape rips this hard into a data week, dealers stop absorbing and start chasing. That is the setup we have going into CPI, which I expect to come in flat between 3.3%-3.6%.
Asset Performance
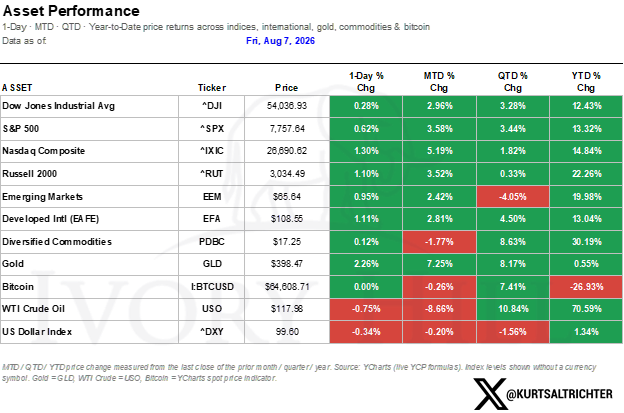
Crude at +70.59% YTD is still the standout, but it gave back 8.66% on the month. That reversal is important. When oil rolls over this late in the year while equities push new highs, the stagflation premium that helped fund the energy trade all year could be unwinding right now. Gold sits flat at +0.55% YTD after a 7.25% monthly gain. We added 4% to gold on July 31st. Bitcoin is down 26.93% on the year, the worst major asset, and the divergence between crypto and equities is the widest it has been in 2026. However, bitcoin has put in a local bottom, so long-term investors should be keeping an eye on this if they want to play the macro at these levels. Emerging Markets lead international at +19.98% YTD.
Implied Correlation
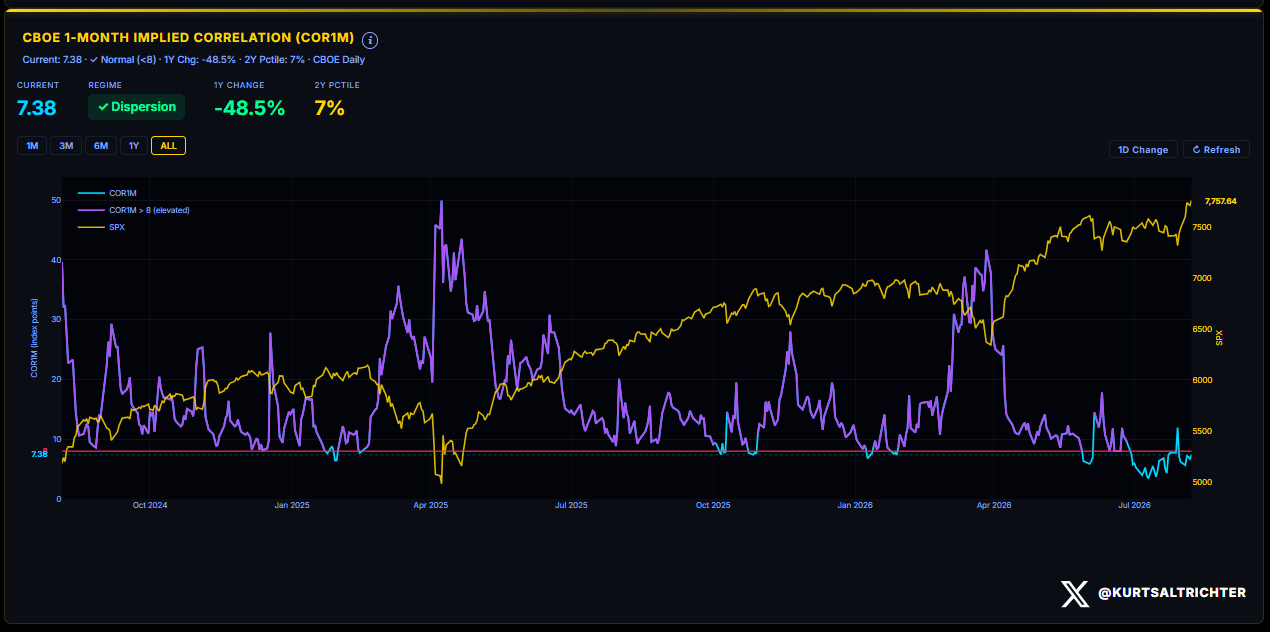
When the broadest index is driven by the fewest names, vol sits pinned, and breadth cannot provide a cushion. That is the mechanical risk worth keeping an eye on.
Vol Term Structure & Economic Calendar
1-month realized vol is 14.04, 3-month is 13.79. The term structure is flat, and one-month has crossed above three-month, an inversion that says her volatility should be expected. This week brings CPI and Core CPI Wednesday, Initial Jobless Claims and PPI Thursday, Retail Sales Friday. These events sit in the high-impact bucket and are marked on the vol surface already.
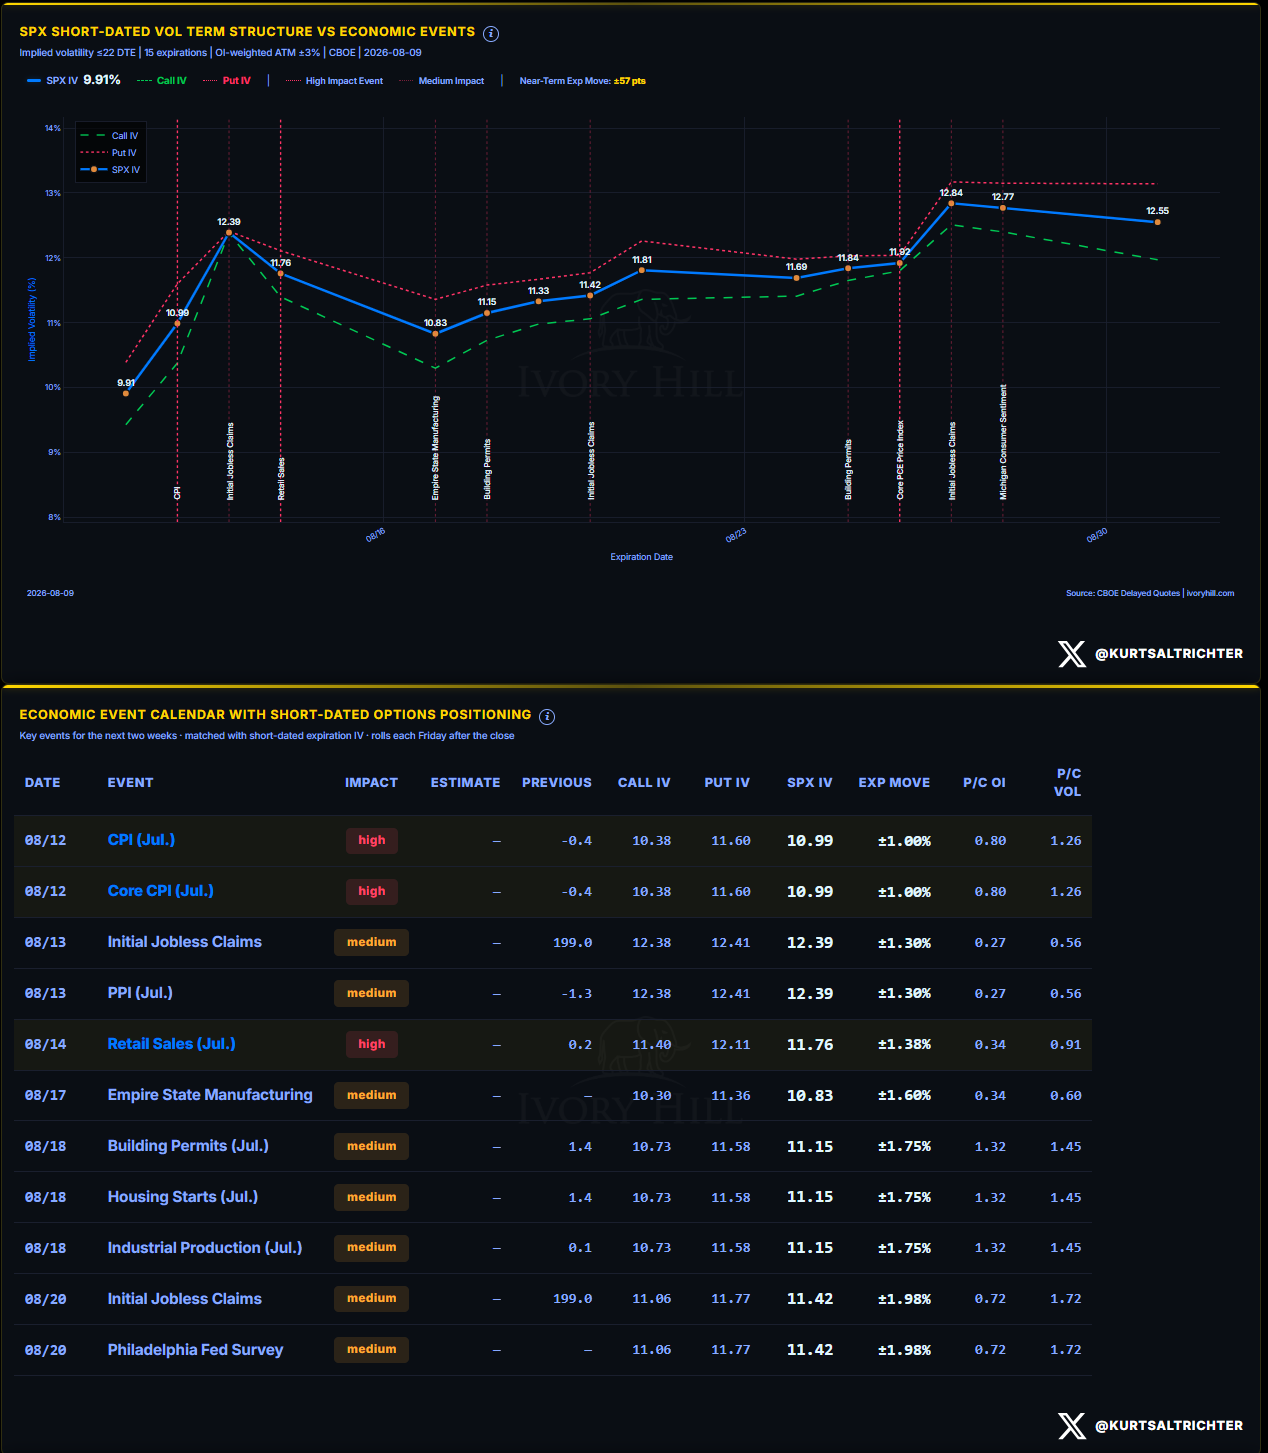
The vol surface shows put IV trading consistently higher than call IV across the event calendar. Put IV at 11.60 against call IV at 10.38 into Wednesday’s CPI, with the P/C OI ratio at 0.80. That premium on puts is a defensive skew, meaning traders are pricing downside tail risk into the tape ahead of these prints. The near-term expected move is ±57 points. This is not a complacent market.
Earnings
Cisco, Applied Materials, and Coherent report this week. Applied Materials is the single tell on whether the AI capex cycle continues to sustain growth or rolls over. AMAT misses on guidance, the cycle cracks; AMAT guides up, the cycle holds. That result is binary and moves the entire semiconductor complex.
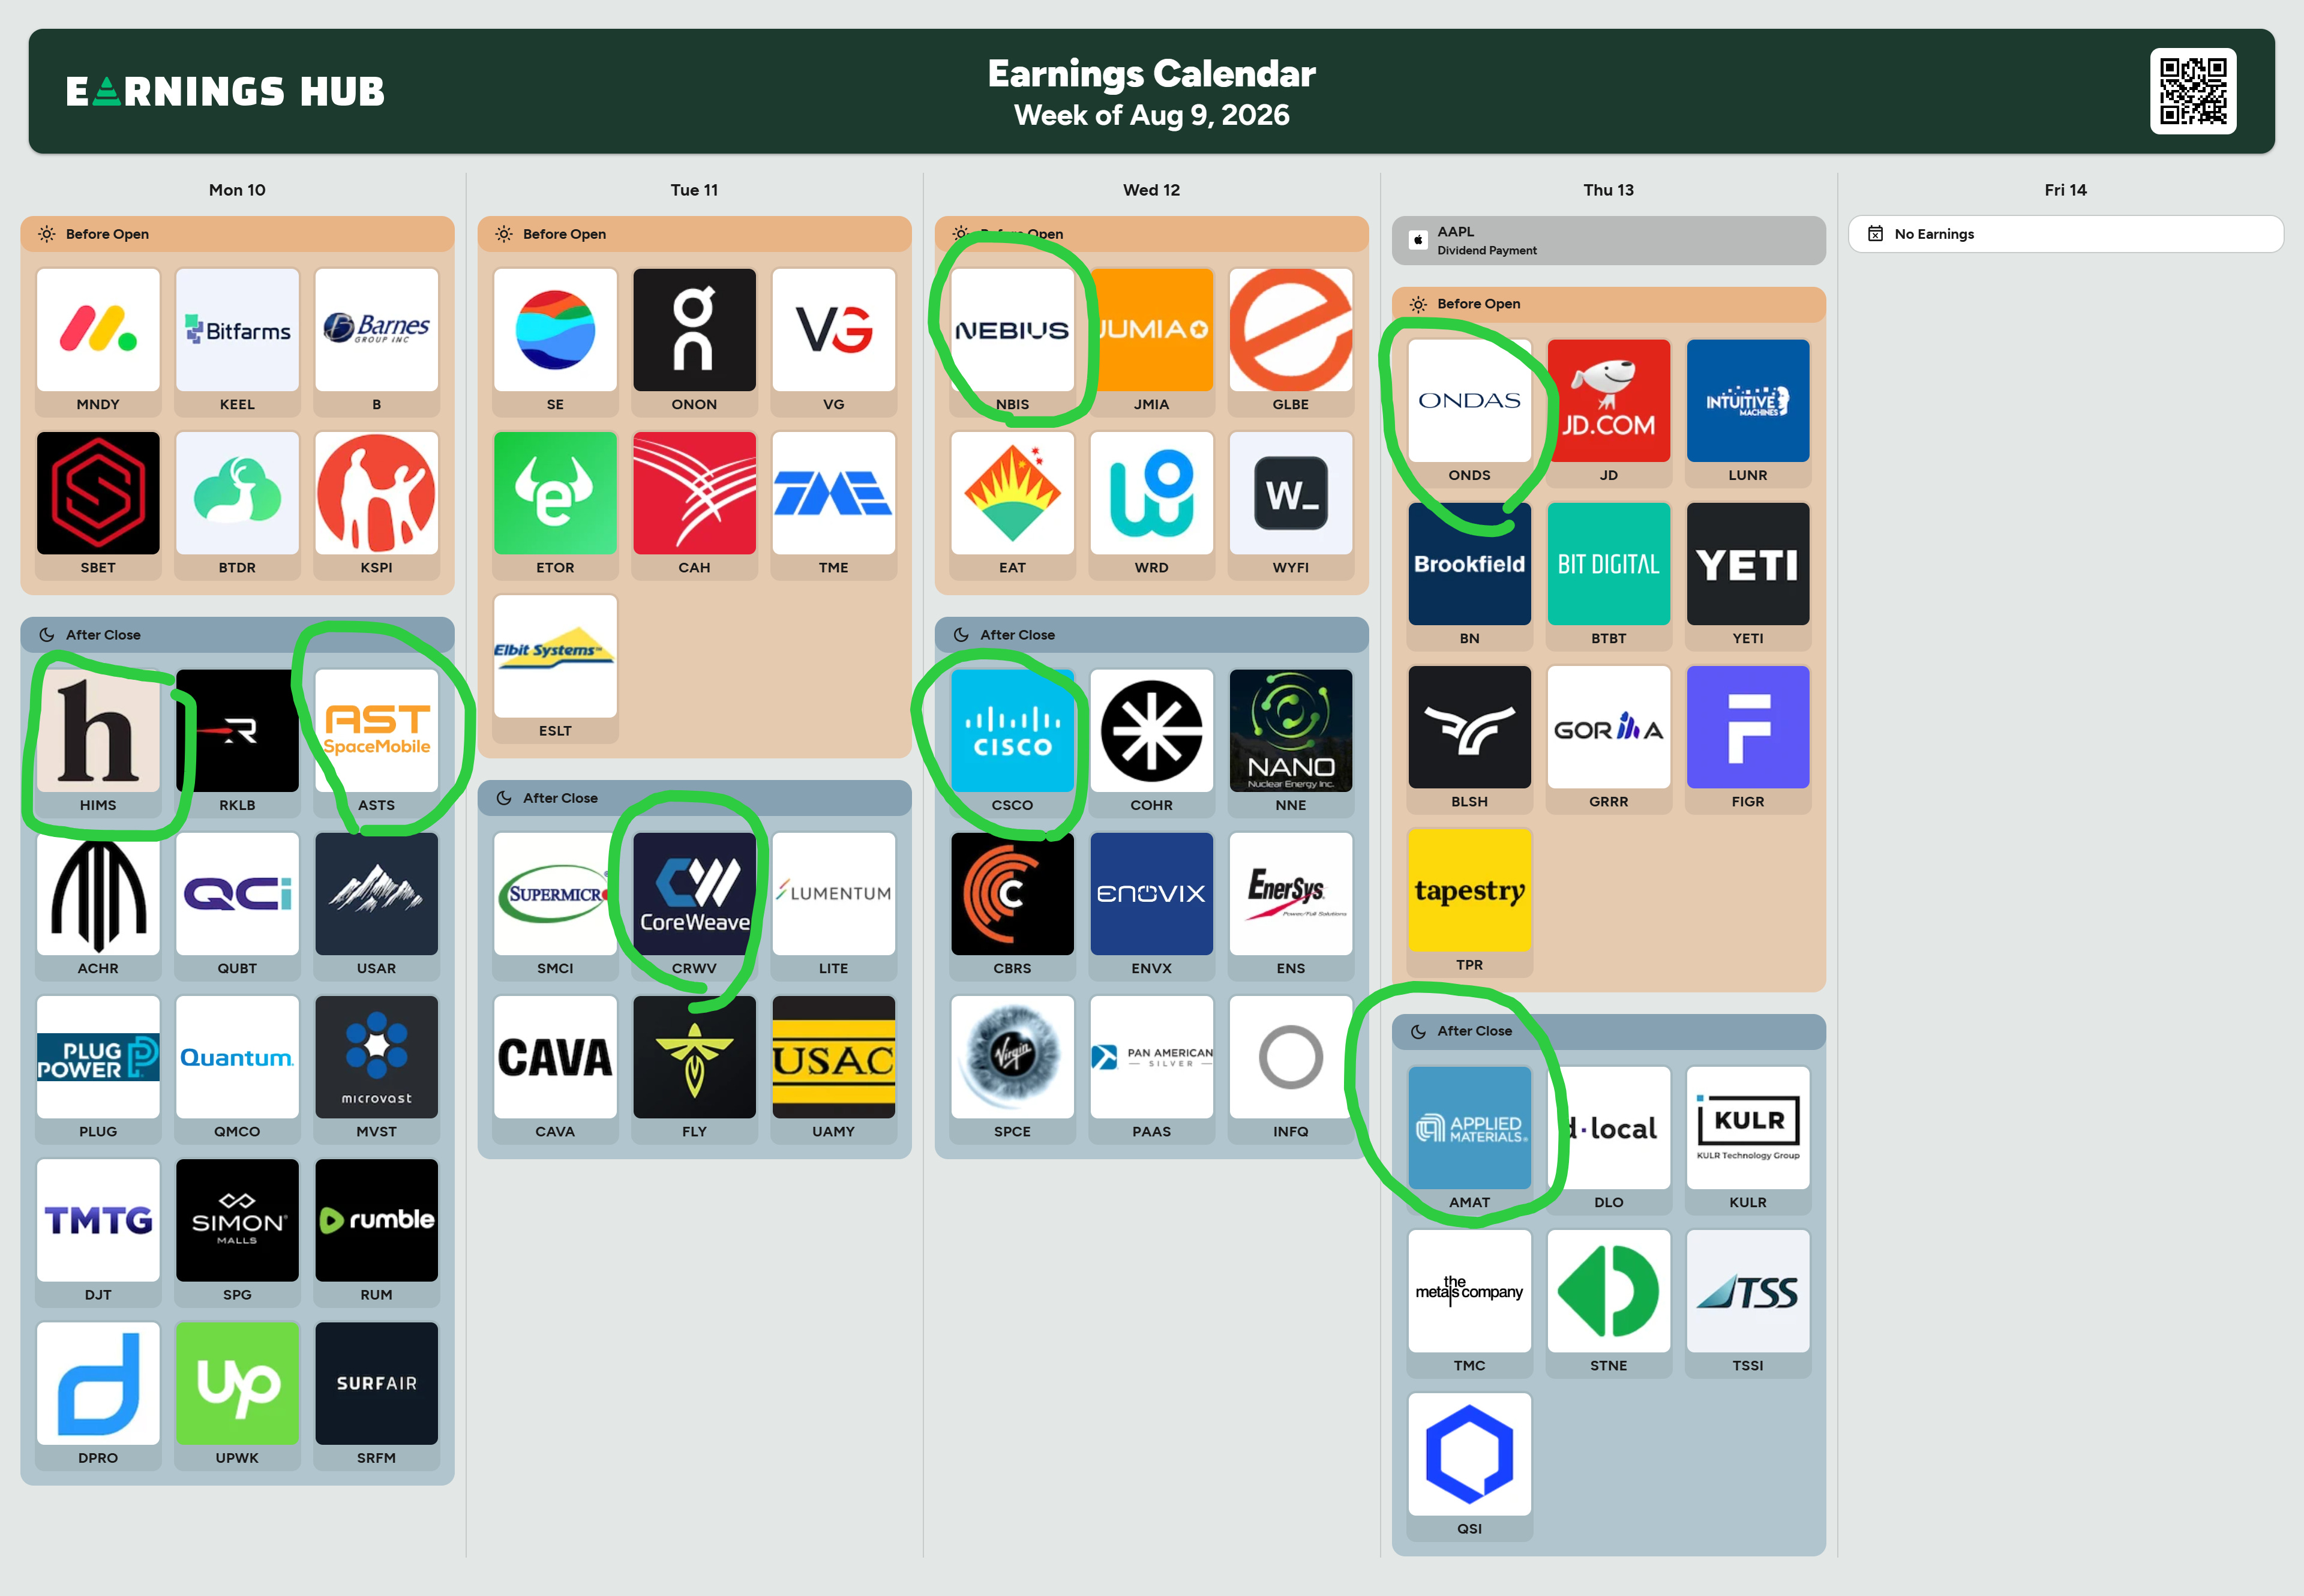
CoreWeave and Nebius also report this week, those two names carry the AI infrastructure buildout narrative. The market has priced these stocks in as the picks and shovels of the compute trade. A guide-down from either of them would invalidate the capex growth story that has held the index up the last two years.
Sector Momentum
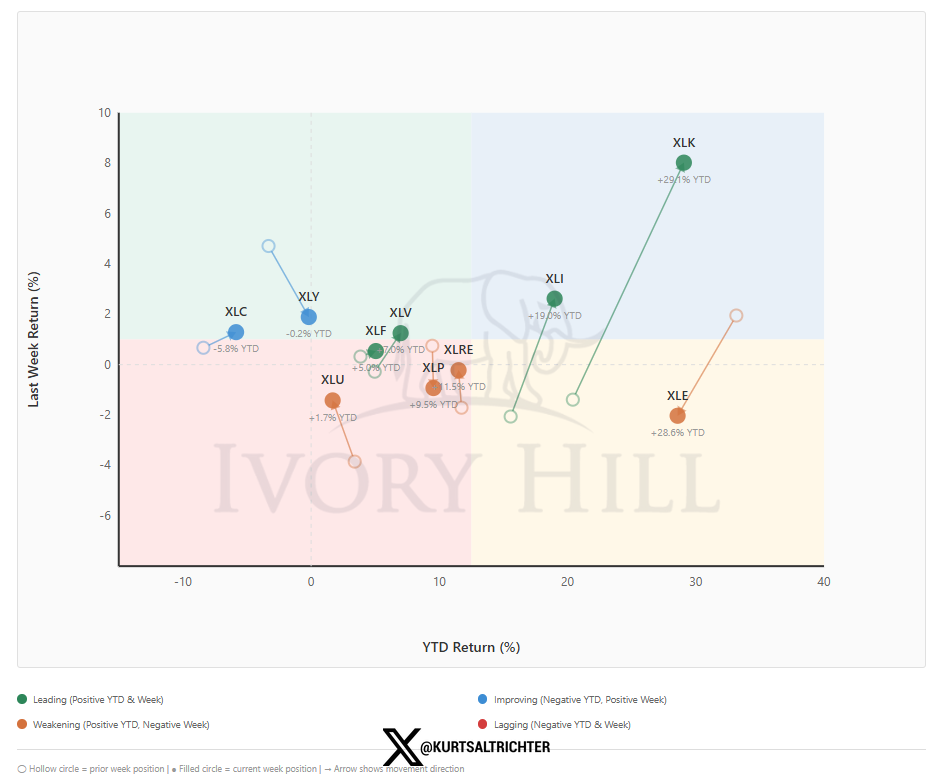
Technology leads at +29.4% YTD and up 8.0% on the last week, sitting alone in the Leading quadrant. That is the only sector with both positive YTD and strong positive weekly momentum. Energy is +28.6% YTD but down 1.9% on the week, decelerating in the Weakening quadrant. We sold all of our energy on the April run-up, and I am not in a hurry to get back in at these levels, but I do think it could stay elevated for a while. The carry trade that funded the rally is losing steam.
Single-Name Momentum Universe
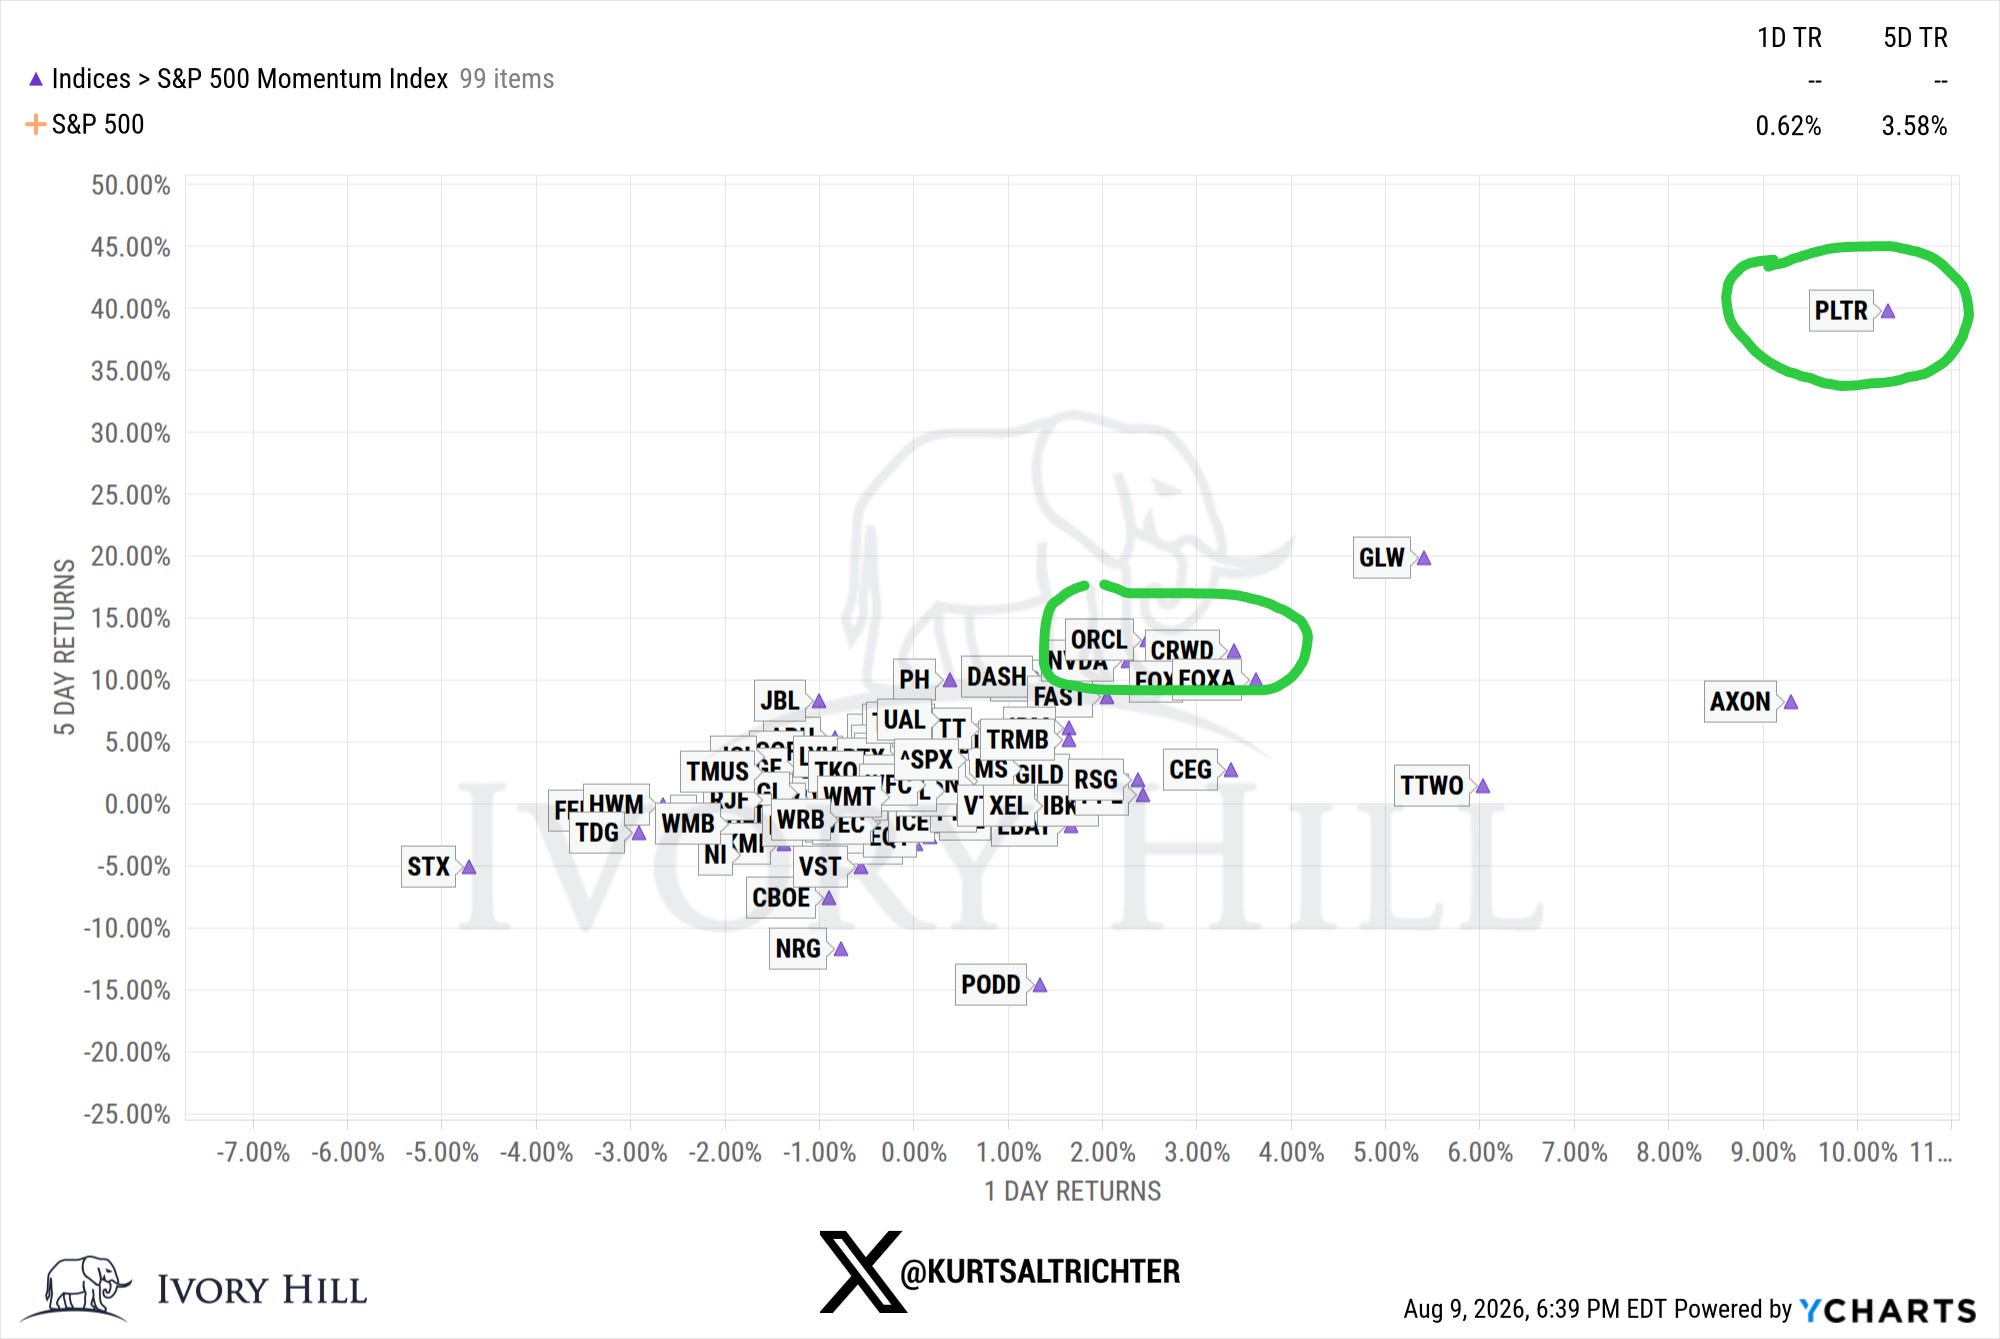
The dispersion is extreme. The upper right is all momentum leaders: PLTR at +40% on the 5-day and +10% on the day, GLW +20%, AXON +8%, TTWO. These names are geen on both axes, which means momentum is self-reinforcing and capital is not rotating out yet. ORCL, CRWD, NVDA, FOXA all cluster in the +10% 5-day zone.
The left side holds the laggards. STX is down 5% on the 5-day. NRG, PODD, CBOE all print negative 5-day, sitting in the lower quadrant. The spread between PLTR at the top right and PODD at the bottom is nearly 55 percentage points over the 5-day period. That is the widest single-name dispersion of 2026. The center holds the bulk of the index near zero, which shows the S&P 500 is like a barbell: extreme winners in a handful of momentum names, laggards in the rest, and nothing in between.
Market Structure: Gamma Flip & Weekly Expected Move
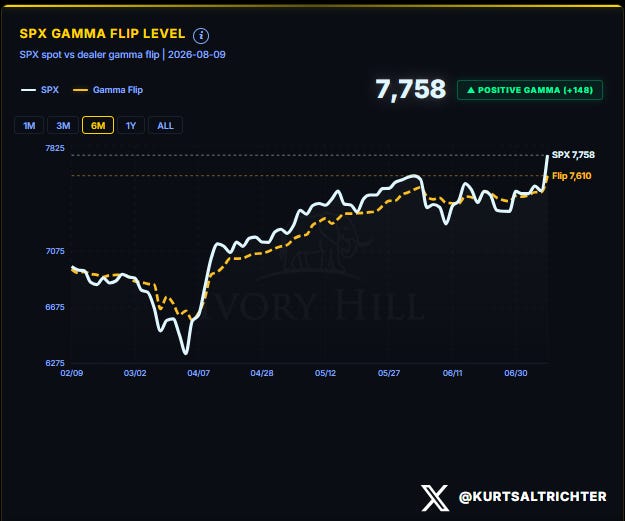
The gamma flip line sits at 7,610. The SPX spot level is at 7,758, which puts dealers 148 points above the gamma flip line, in positive gamma. Dealers are long gamma, which means they sell into strength and buy into weakness, suppressing volatility as long as spot holds above the gamma flip line.
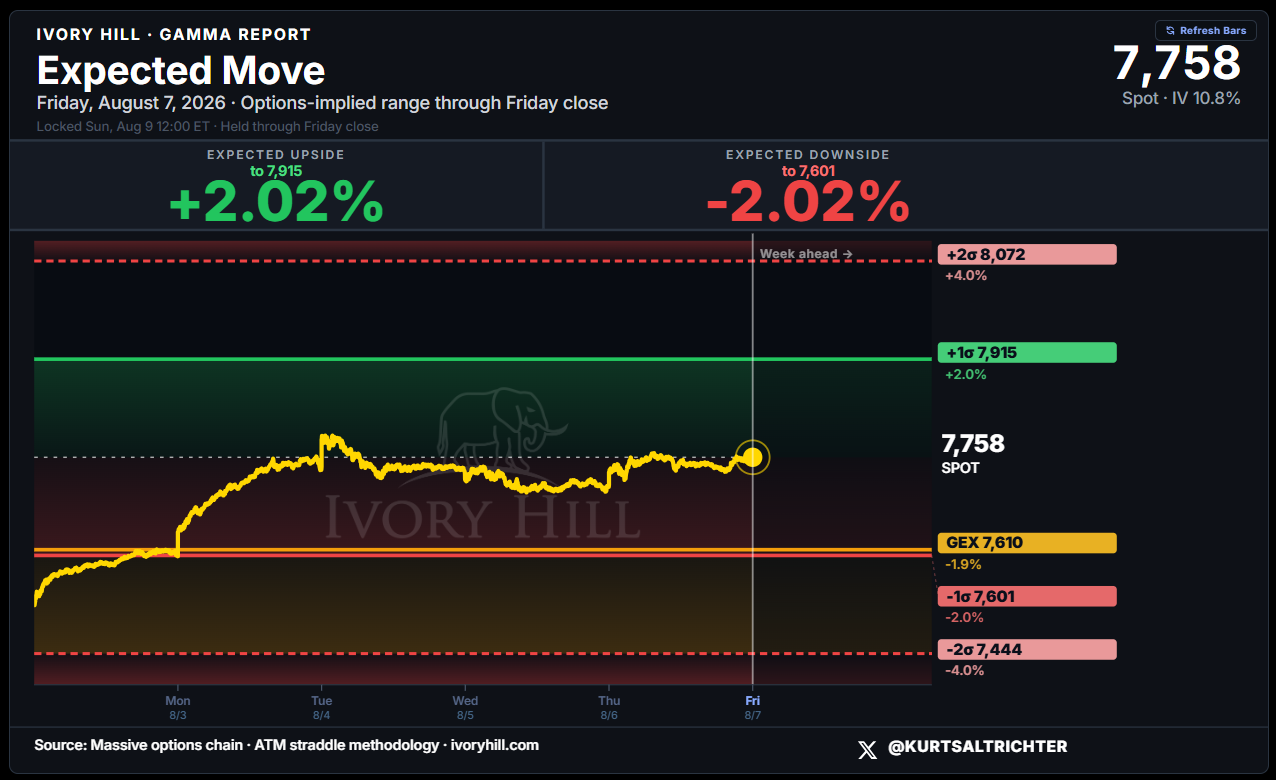
The one-sigma expected move is 2.02% in either direction off the 7,758 close. That band runs from 7,915 on the upside to 7,601 on the downside. That is the operating range dealers are hedged for. The flip at 7,610 sits just inside the lower band. A break below 7,610 forces dealers negative, which accelerates any move lower. A hold above 7,610 keeps the vol suppression burner on. GEX sits at 7,610. For now, dealers are hedged for 2.02%, and that is what you trade until CPI hits.
I recommend revisiting these levels throughout the week so you don’t surprise yourself out of a trade that was expected.
Volatility Regime
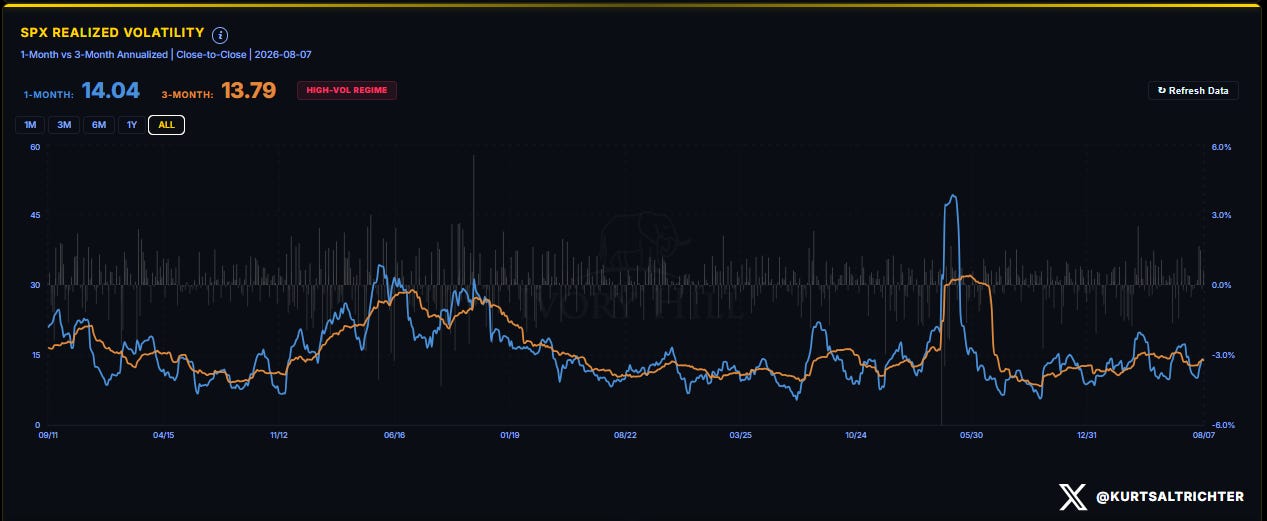
One-month realized volatility sits at 14.04, above the three-month at 13.79. The regime reads high-vol, and one-month over three-month is the inversion that fires the signal. Realized vol climbed on the week as the 268-point rally added daily range. A single day of realized vol above 18 forces a 15% unwind in notional exposure across the vol-control universe. That is the mechanical risk in place.
Systematic Fund Flows
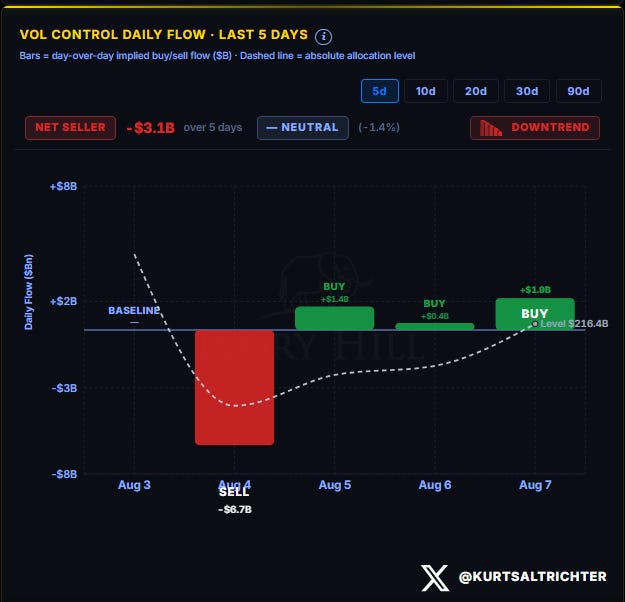
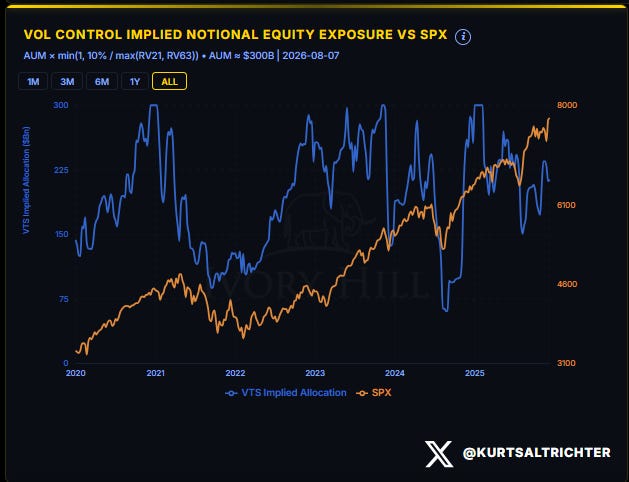
The two systematic flows split this week. Vol-control funds were net sellers of 3.1 billion over the past five days, with a peak sell of 6.7 billion Tuesday before three straight days of buying that recovered most of it. The absolute allocation level sits at 216.4 billion. The Tuesday sell was the mechanical response to the prior week’s realized-vol spike; the recovery is those same funds re-leveraging as vol stabilized.
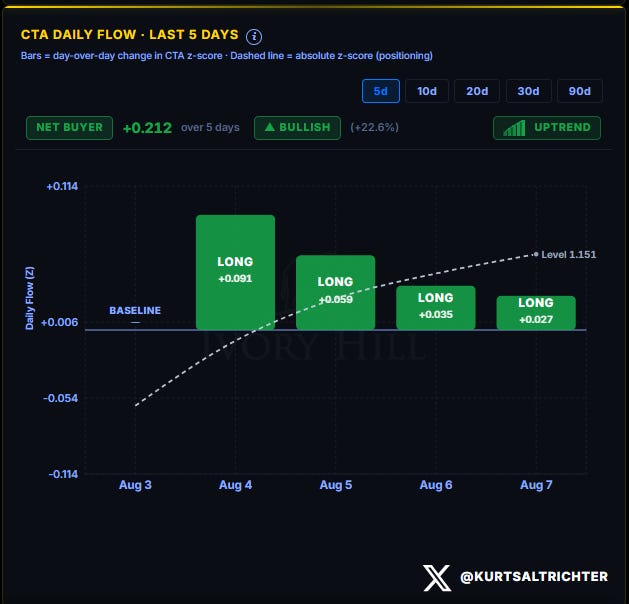
CTAs went the other way. Net buyers of +0.212 on the z-score over five days, bullish at +22.6%, in an uptrend, back near the top of the chart. The CTA long that turned every dip into a buy has been built right back up. That can cut both ways though: it amplifies strength, but it also means the mechanical bid is fully committed with little dry powder left to add, and the light switch can go the other way. FAST.
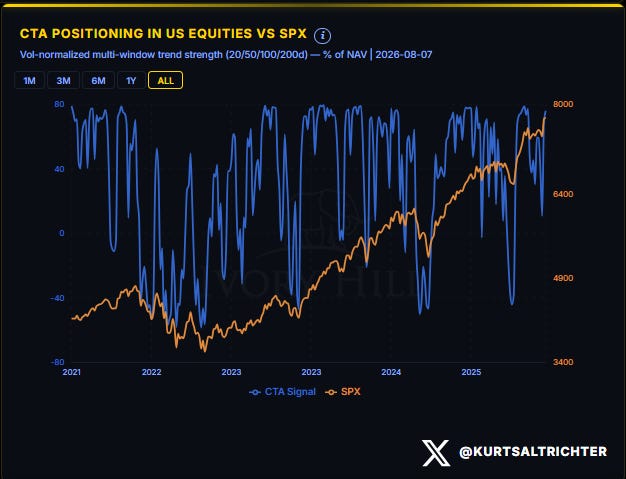
Both algos point in the same direction into this week. Vol-control is re-leveraging as realized vol stabilizes, and CTAs are long and buying. The systematic bid is back, and it could be getting stretched on a short-term basis. The risk is that a hot CPI print flips realized vol higher, which forces vol-control to sell into a CTA book that is already max long. That is how the mechanical bid becomes a mechanical unwind.
Positioning Index: Systematic Z-Score
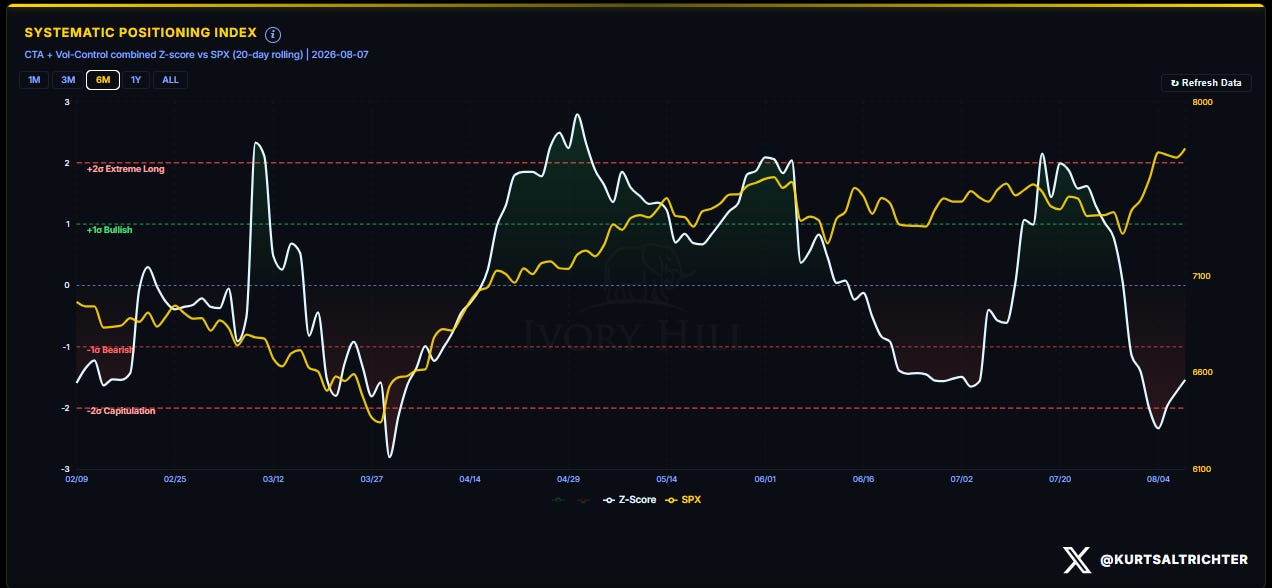
The combined CTA and vol-control z-score sits near +0.5 sigma. The algo rebuild is driven by both components: the CTA trend portion pushed back toward extreme long, and the vol-control signal recovered as realized vol stabilized. The systematic complex is re-leveraged into the data.
Market Breadth
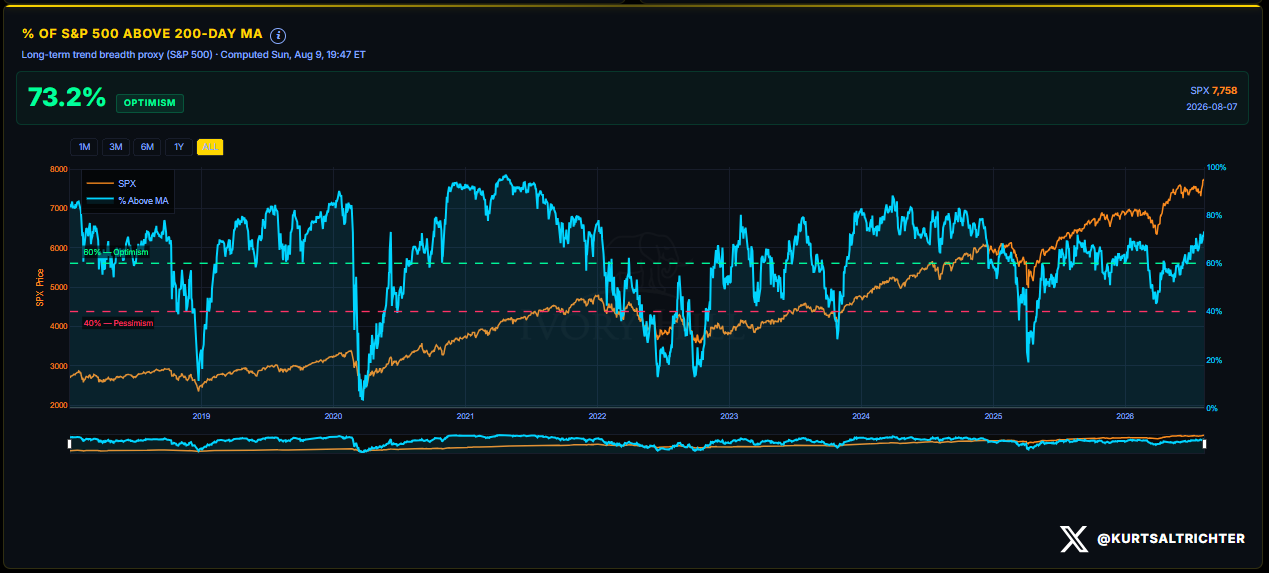
Breadth is 73.2% of the S&P 500 above its 200-day moving average, up from 68.3% two weeks ago. The data improved with the rally and sits far from the 40% pessimism line. Breadth confirming the move higher is what separates this from a narrow-leadership top.
Dealer Gamma Dashboard
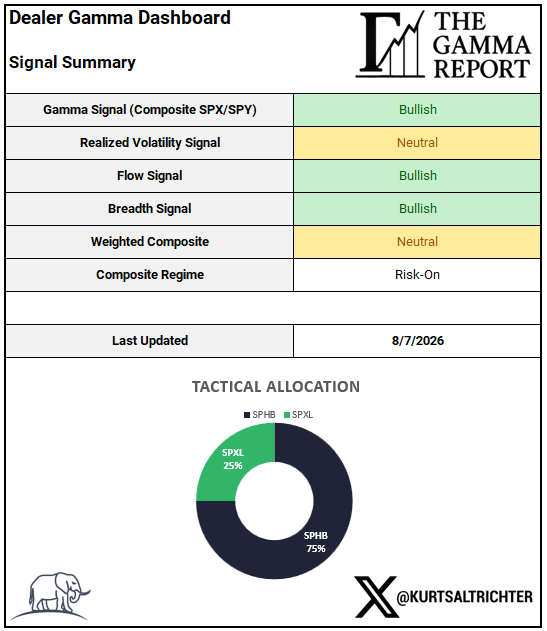
The regime output is Risk-On, which reflects that the bullish signals outweigh the neutral composite. The allocation holds at 75% SPHB (high beta) and 25% SPXL (leveraged beta), putting the gas pedal to the floor for the second week.
Tactical Allocation Performance YTD
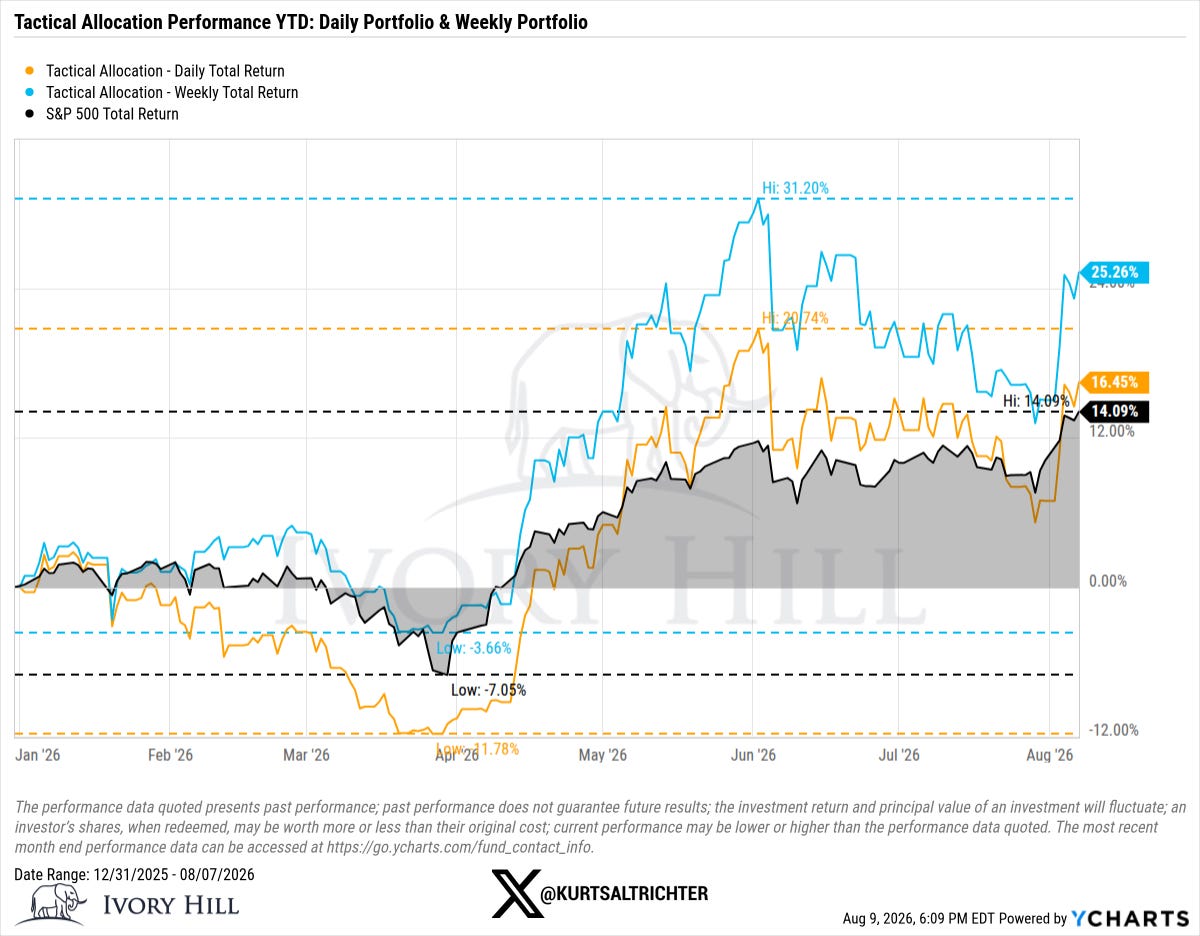
The weekly sleeve sits at 25.26% year-to-date against the S&P 500 at 14.09%. The daily sleeve sits at 16.45%, ahead of the index by 2.36%. Both sleeves beat the benchmark, and the weekly sleeve is running more than 11 points ahead. The distance between the weekly and daily performance reflects the allocation’s sensitivity to the vol-control rebalancing cycle. Weeks that see inflows build leverage early Monday and capture strength early. Last week’s rally captured that dynamic on the weekly sleeve.
Closing Position
The market is priced for a benign CPI. Wednesday will say whether that assumption holds. A cool print re-opens the case for rate cuts and sends the momentum names higher into a re-leveraged systematic book. A hot print flips realized vol, forces vol-control to sell into a max-long CTA book, and the same mechanical bid that drove the 268-point rally becomes the unwind. Dealers are long gamma above 7,610, which suppresses the move until spot breaks that line. Below it, the suppression is gone.
And remember: the one fact pertaining to all conditions is that they will change.
Feel free to use me as a sounding board.
Follow me on X for more updates.
Best regards,
Schedule a call with me by clicking HERE
Kurt S. Altrichter, CRPS®
Wealth Advisor | President
Disclosure
The Gamma Report is published by Ivory Hill, LLC. All opinions and views expressed in this report reflect our analysis as of the date of publication and are subject to change without notice. The information contained herein is for informational and educational purposes only and should not be considered specific investment advice or a recommendation to buy or sell any security.
The data, models, and tactical allocations discussed in this report are designed to illustrate market structure and positioning trends and may differ from portfolio decisions made by Ivory Hill, LLC or its affiliates. Investing involves risk, including the possible loss of principal. Past performance is not indicative of future results.
Ivory Hill, LLC, and its members, officers, directors, and employees expressly disclaim any and all liability for actions taken based on the information contained in this report.