

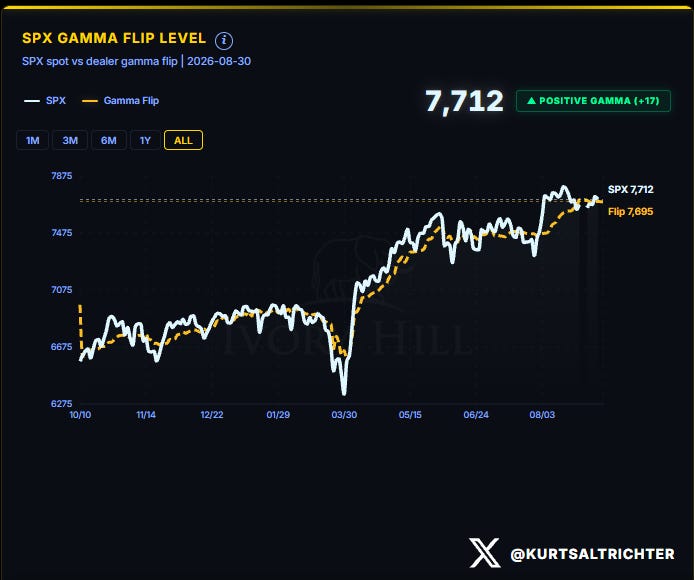
The S&P 500 closed Friday at 7,711.76, up about 0.50% on the week despite a Friday selloff. Dealers are back in positive gamma, the S&P 500 is sitting 17 points above the 7,695 gamma flip line, the exact reversal last week’s report said could happen and it happened within days. Underneath, systematic positioning moved the other way: CTAs turned a 3-day selling streak into a 2-day buying spree, pushing the combined systematic z-score through the extreme-long line, the highest reading in six months. Some what calm dealer positioning stacked on top of stretched systematic longs leaves little room for a disappointing print, and Friday brings the biggest one on the calendar: non-farm payrolls.
Asset Performance
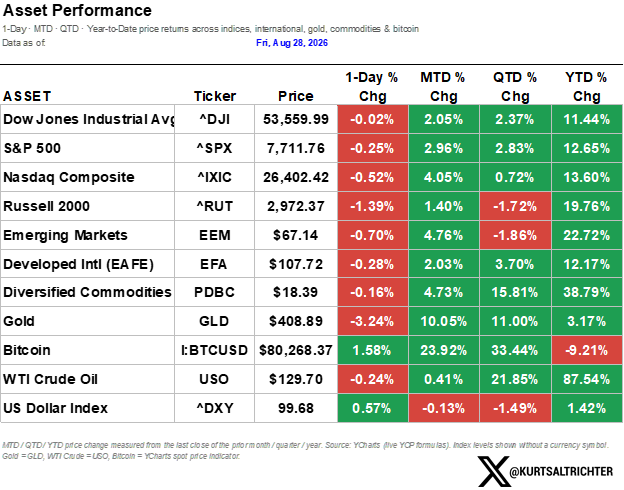
Gold is the reversal of the month, down 3.24% Friday, the sharpest 1-day drop on the table, cutting the year-to-date gain from 6.83% last week to 3.17% now even with the month still up over 10%. Bitcoin keeps closing its gap, up 23.92% on the month and 1.58% on the day, trimming the year-to-date loss to negative 9.21% from negative 17.32% last week. WTI crude is flat on the week but still up 87.54% year-to-date, and the dollar firmed 0.57% on the day without breaking its soft quarter, still down 1.49%.
Implied Correlation
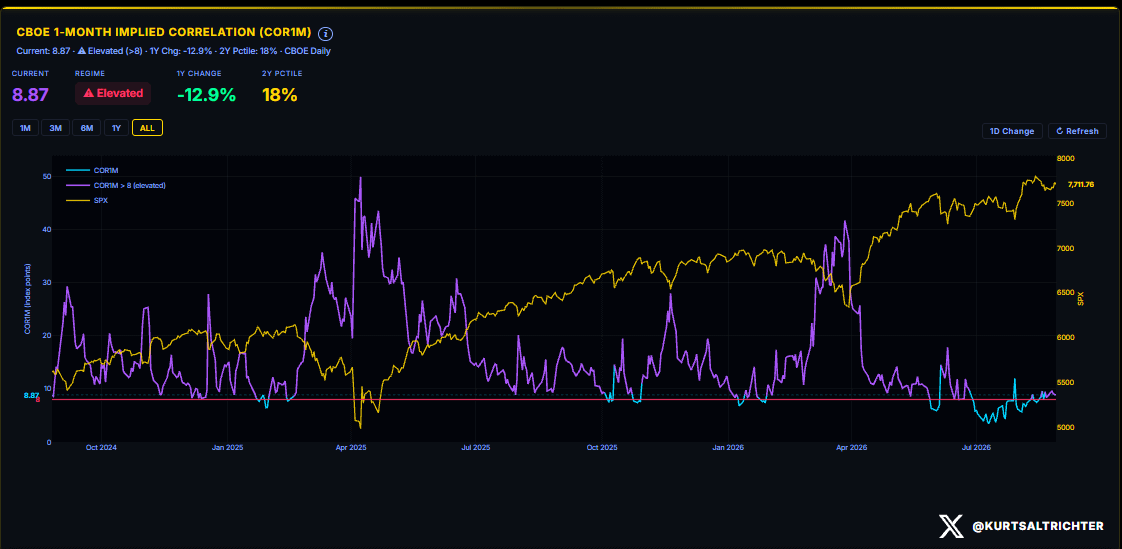
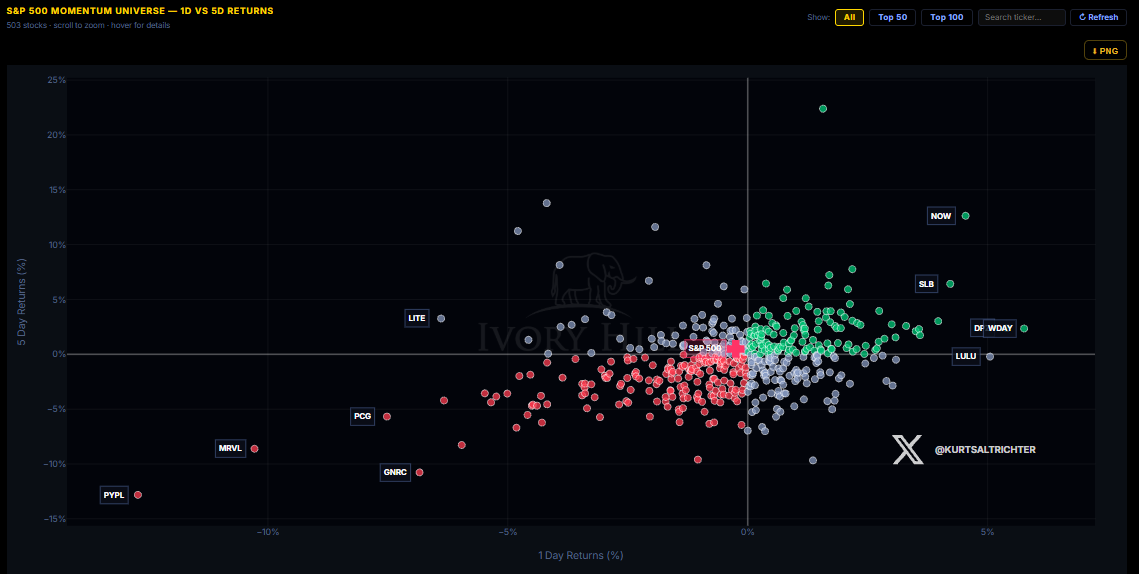
CBOE one-month implied correlation is still historically low but climbing for a second straight week. Correlation is heading the direction dispersion normally implies single stocks trading further apart from each other and from the index, which the momentum universe below confirms directly.
Vol Term Structure and Economic Calendar
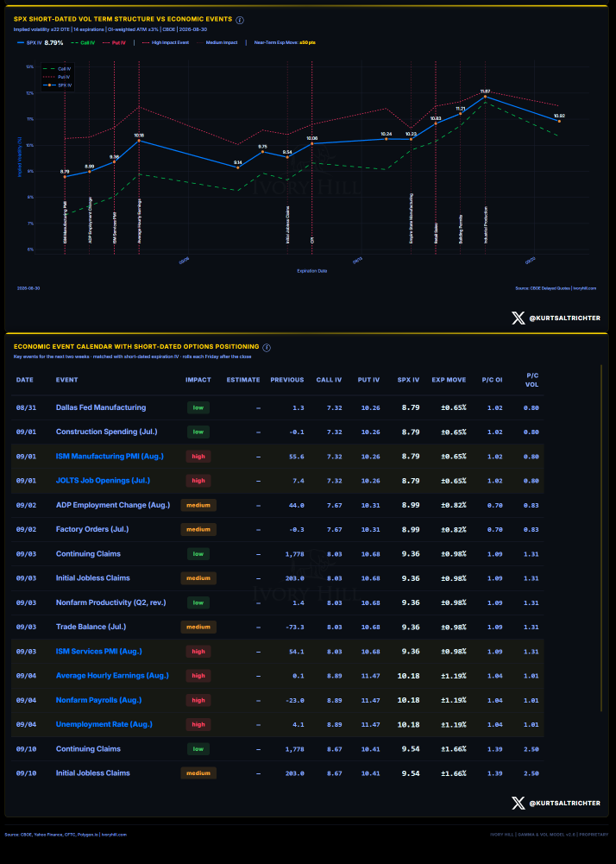
Front-dated SPX implied vol is 8.79%, up slightly from last week’s 8.49% floor but still cheap for what’s on the calendar. ISM manufacturing and JOLTS both land on Tuesday, high-impact but priced at only plus or minus 0.65%. Wednesday’s ADP report carries plus or minus 0.82%. The real event is Friday, when ISM services, average hourly earnings, nonfarm payrolls, and the unemployment rate all land the same day, priced at a plus or minus 1.19% expected move, the widest of the 2-week window before the extended read out to September 10th. Worth watching going in: the prior nonfarm payrolls print came in at negative 23,000, a contraction, not a slowdown. Friday either confirms the labor market cracked or shows that print was noise.
Earnings
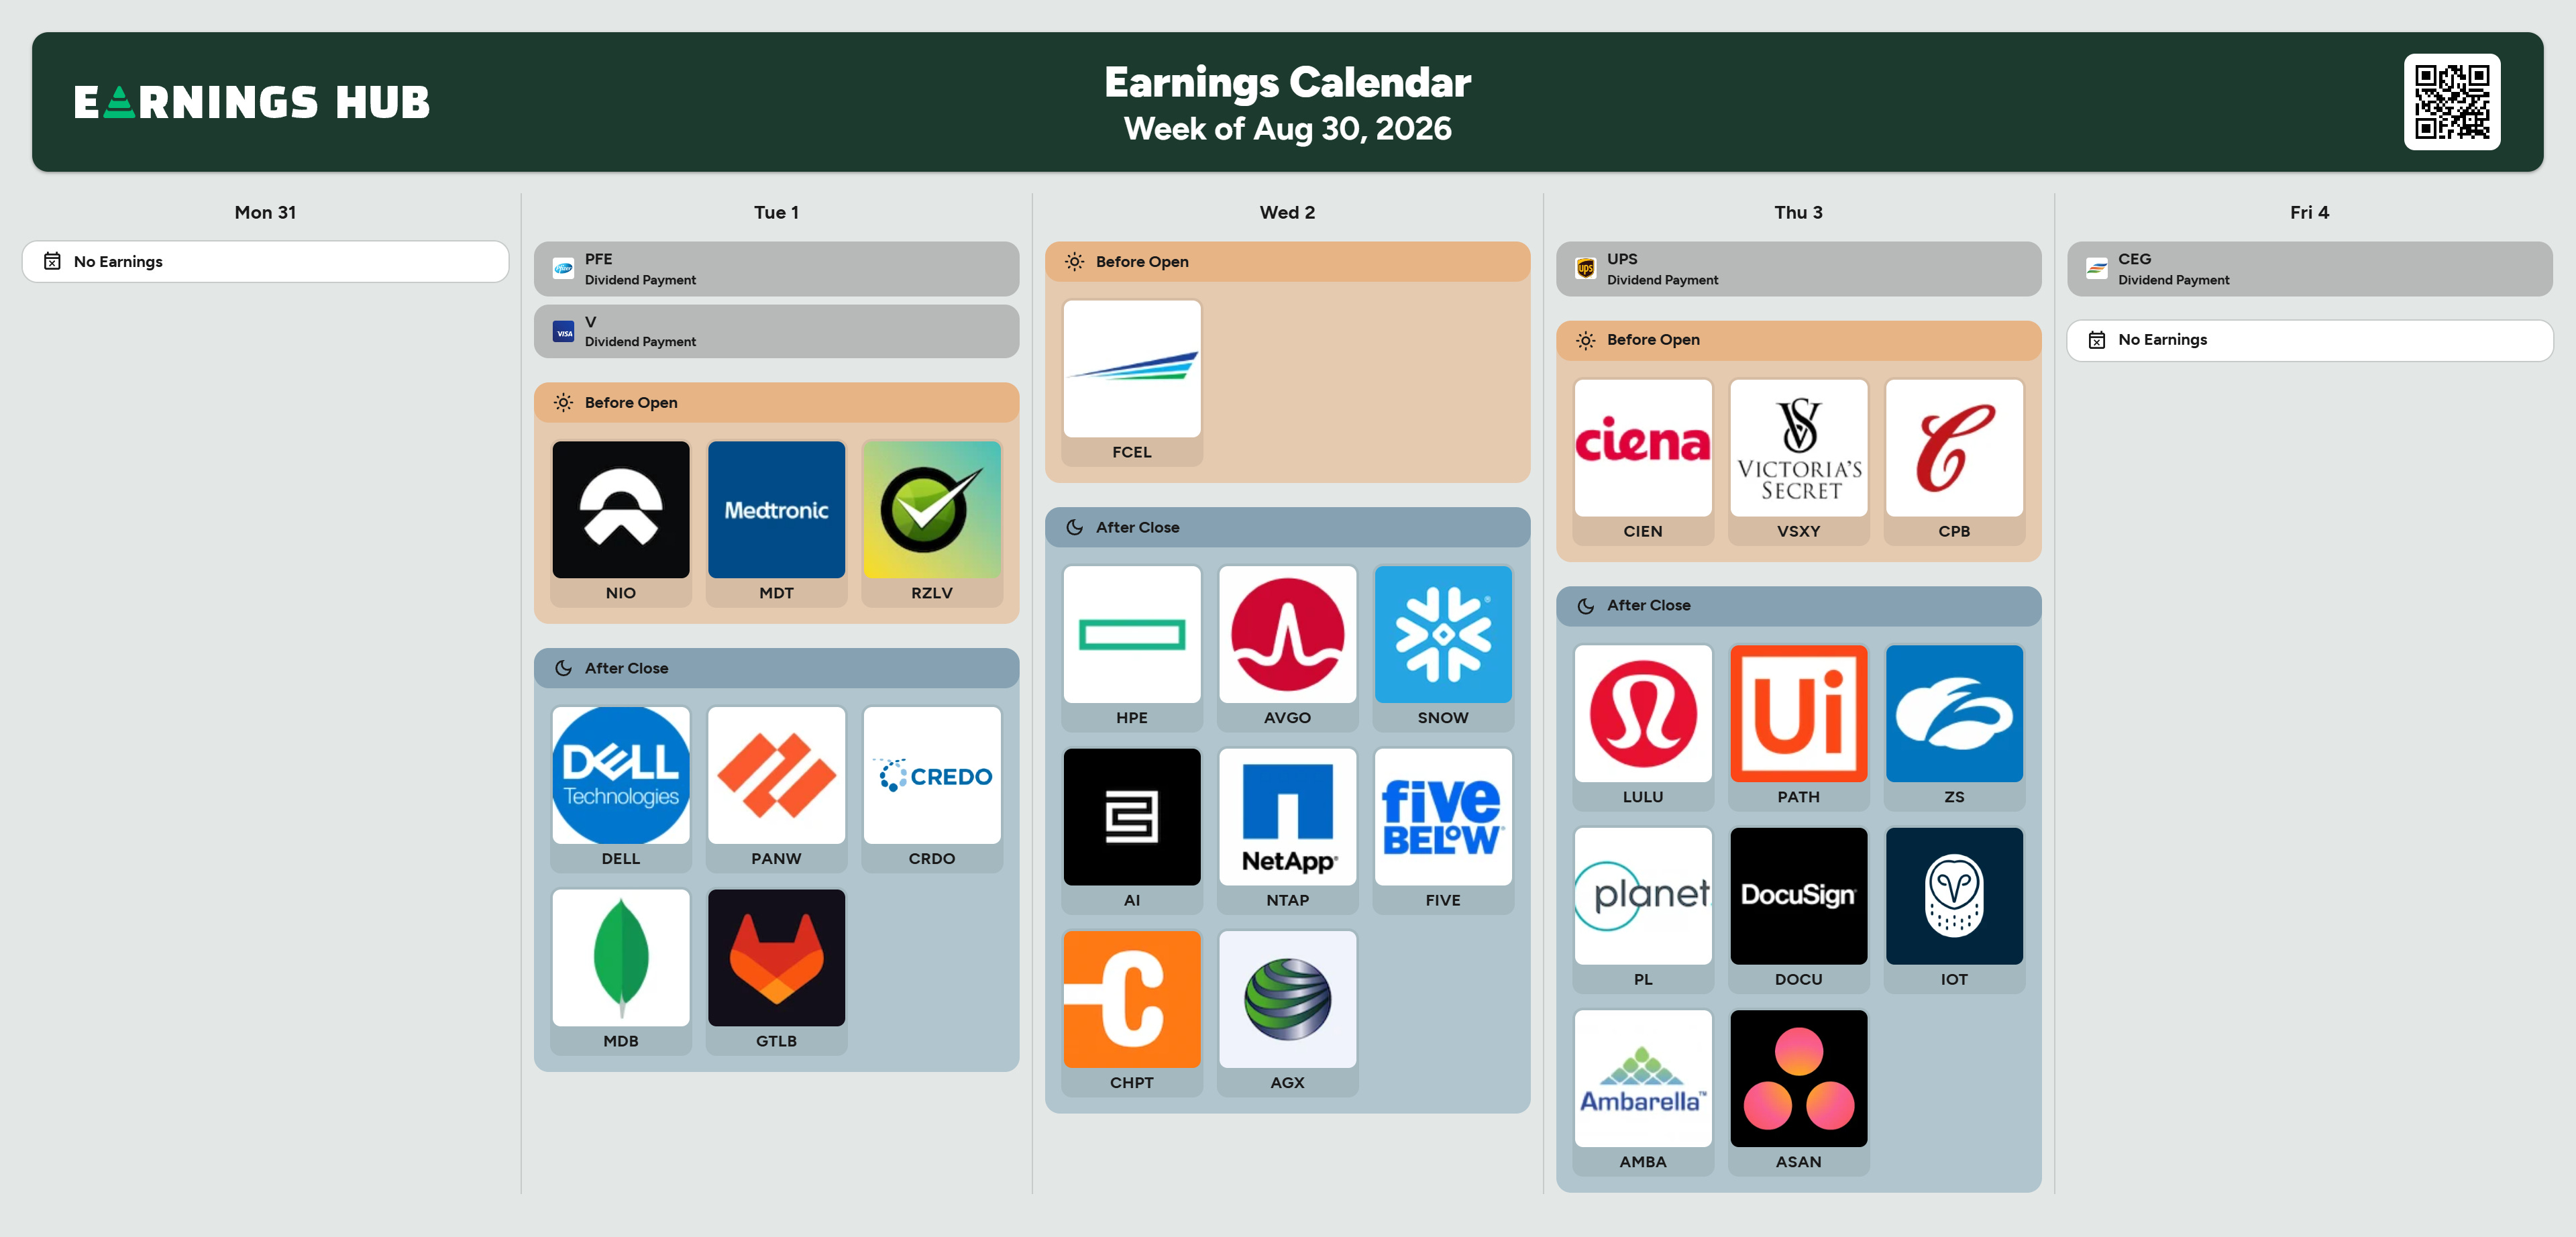
Nvidia earnings guidance: $108 billion for Q3, gross margin 74% next quarter, then a bottom of 71% to 72% in Q4 before recovering to 72% to 73% in fiscal 2028. Memory pricing has moved further and faster than the company expected, and management is treating that as a symptom of the same AI buildout driving its own growth, not a separate problem. The more important line from the call is that management called the 70% fiscal 2028 revenue growth guide a supply number, not a demand number, and said unconstrained demand runs well above it, meaning Nvidia is telling you it could sell more than it’s guiding to if it could build it. On the balance sheet, Nvidia is now financing part of its own demand: roughly $50 billion invested directly into frontier AI labs, a new partnership with six infrastructure capital providers (Apollo, BlackRock, Blackstone, Brookfield, Goldman Sachs, and KKR) to raise over $500 billion in third-party financing for those labs, and a specific commitment to backstop nearly 2 gigawatts of compute for one lab’s credit. Management called this circular financing directly on the call and disagreed with the label, but the mechanics are real: Nvidia sells the chips, then helps arrange the financing that buys the chips. That isn’t automatically a problem, but it’s a dependency worth tracking, and it’s new. None of this is why the stock didn’t run. It spiked as much as 8.5% intraday. Demand isn’t the risk here. Cost is. And because Nvidia carries close to 8% of the S&P 500’s weight, a stock trading a ten-point range on one print moves index-level realized vol and dealer gamma on its own, independent of anything else on the tape that week. This week’s calendar carries the same AI capex theme one level down the chain: Dell and Palo Alto Networks report Tuesday after the close, Broadcom and Snowflake Wednesday after the close, and Lululemon, DocuSign, UiPath, and Zscaler round out Thursday. Broadcom in particular is a direct read on the custom AI chip side of the same buildout Nvidia just confirmed is still accelerating.
Sector Momentum
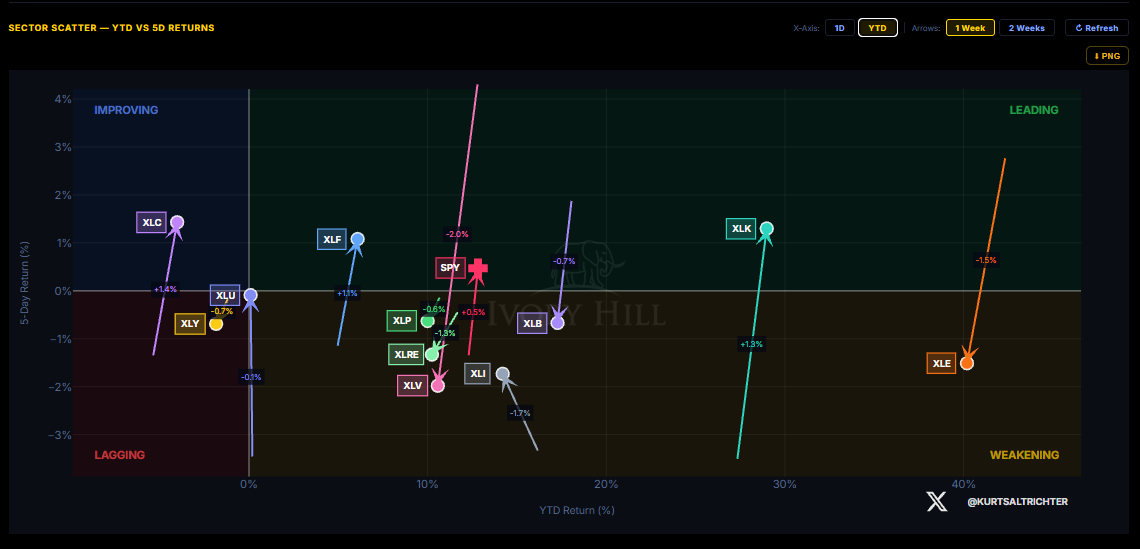
Energy again leads on both axes, XLE up another 2.8% on the week and still the top year-to-date sector by a wide margin. Communication services and financials improved, XLC up roughly 1.4% and XLF up roughly 1.1%. Health care gave back all of last week’s surge and then some, sliding roughly 2% after being the week’s best mover at plus 4.3% seven days ago, the sharpest reversal on the board. Technology and industrials kept cooling, down roughly 1.5% and 1.7% respectively even with strong year-to-date returns still intact.
Single-Name Momentum Universe
Marvell is this week’s cautionary tale. It went into last Thursday’s print already sitting in the laggard cluster, and by Friday it was among the worst performers in the entire 503-name universe, confirmation that the skepticism going in was earned. ServiceNow is the standout on the other side, up roughly 22% over five days, the single largest mover in the universe. PayPal is the single worst, down double digits on both the day and the week, with no clear catalyst visible in the data alone. Nvidia, by contrast, is nowhere near either tail this week. After last Wednesday’s print and the wild single-day swing that followed, the stock has settled back into the pack, a sign the initial reaction is fading rather than compounding.
Market Structure: Gamma Flip
Dealers are back in positive gamma, spot at 7,712 sitting 17 points above the 7,695 flip. Last week’s report said this could flip back positive within the week. It did, within days. The cushion is thin either way, but the direction of the surprise now runs the other way: dealers buy dips and sell rips as long as spot holds above 7,695, which suppresses the range instead of widening it.
Weekly Expected Move
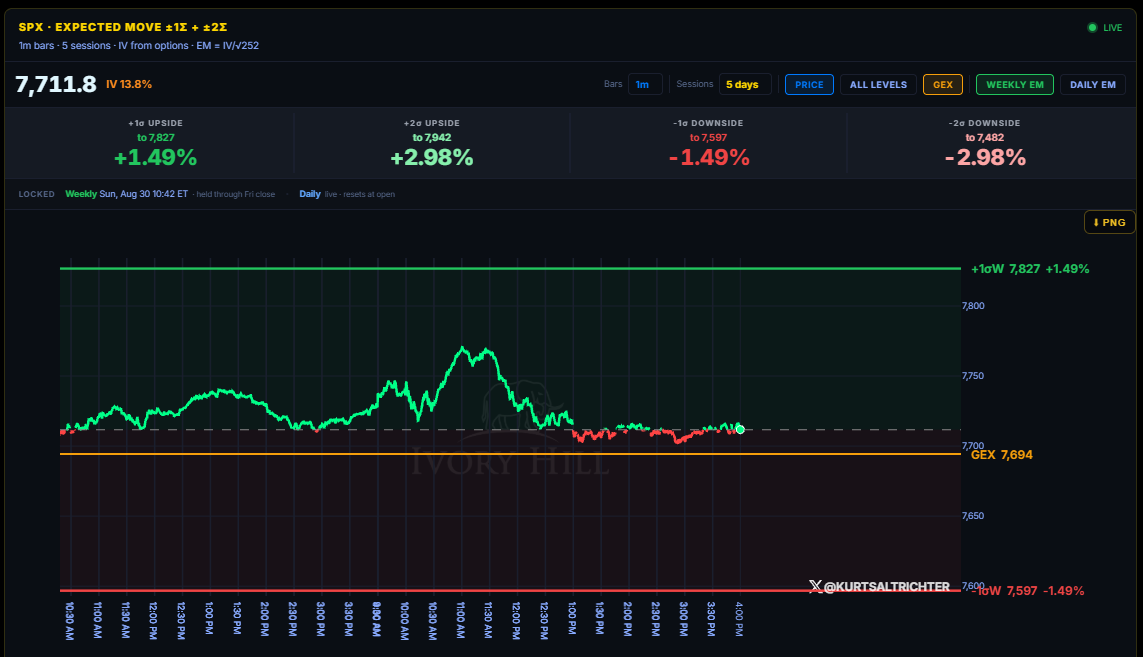
SPX priced a 1.49% weekly range in either direction, upside to 7,827 and downside to 7,597, with the two-sigma band out to 7,942 and 7,482. GEX sits at 7,694, right at the gamma flip level, and spot already tested down toward it by Friday afternoon after spending most of the week in the upper half of the range.
Volatility Regime
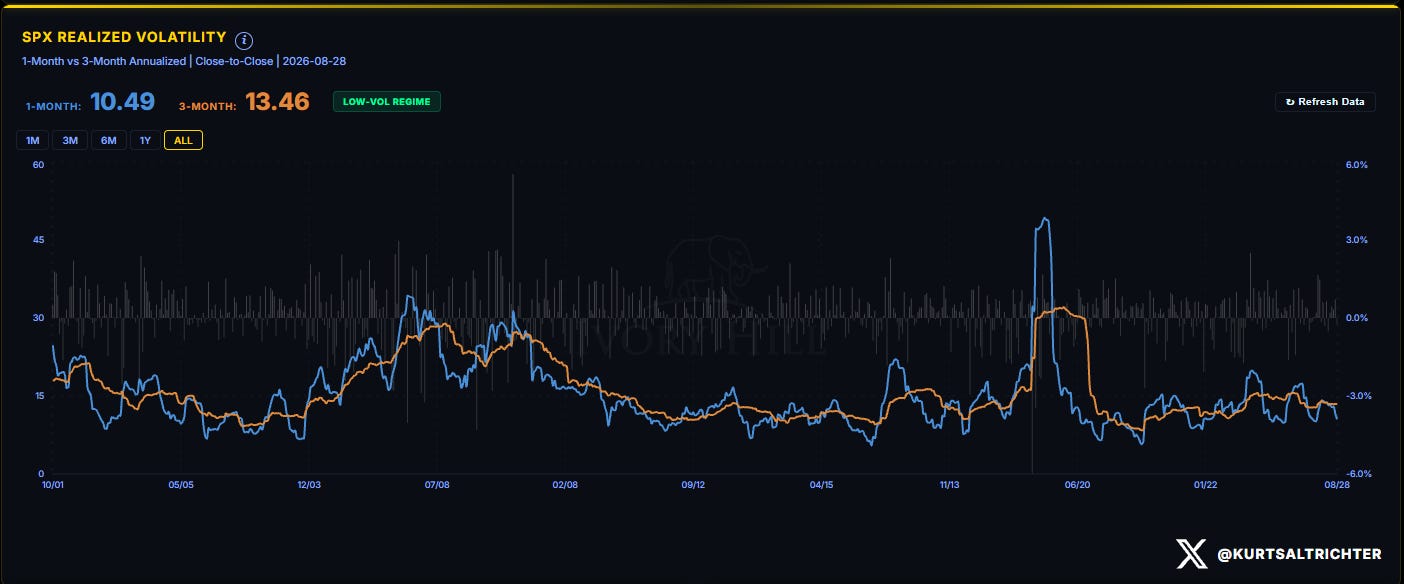
One-month realized vol dropped again, to 10.49 from 12.85 last week. Three-month held at 13.46. The gap between the two readings is the widest it’s been in months, and realized vol fell even as dealers flipped back positive, meaning last week’s negative-gamma break never showed up as an actual volatility event. Low-vol regime, confirmed again.
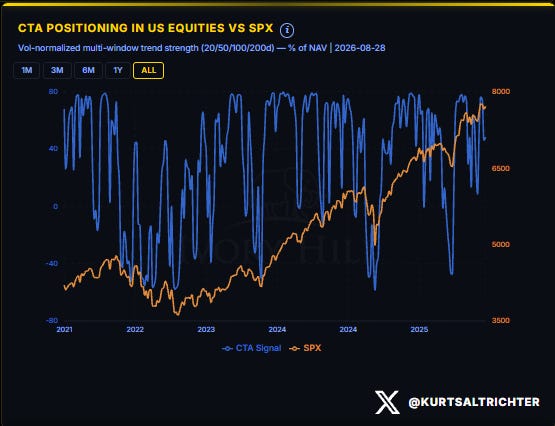
Systematic Fund Flows
The two systematic engines swapped roles this week. CTAs, sellers for three straight days last week, reversed hard: two long days Wednesday and Thursday pushed the five-day change to plus 0.040 in z-score terms, a clean uptrend now tagged bullish. Vol-control did the opposite of its usual job, staying a net buyer at plus $0.2 billion over five days but decelerating from plus $0.4 billion the week before, enough of a slowdown that the system now flags it as a downtrend even with the sign still positive. Notional exposure barely moved, $224.6 billion against $224.2 billion last week. The buyer that showed up this week wasn’t the one that showed up last week.
Positioning Index: Systematic Z-Score
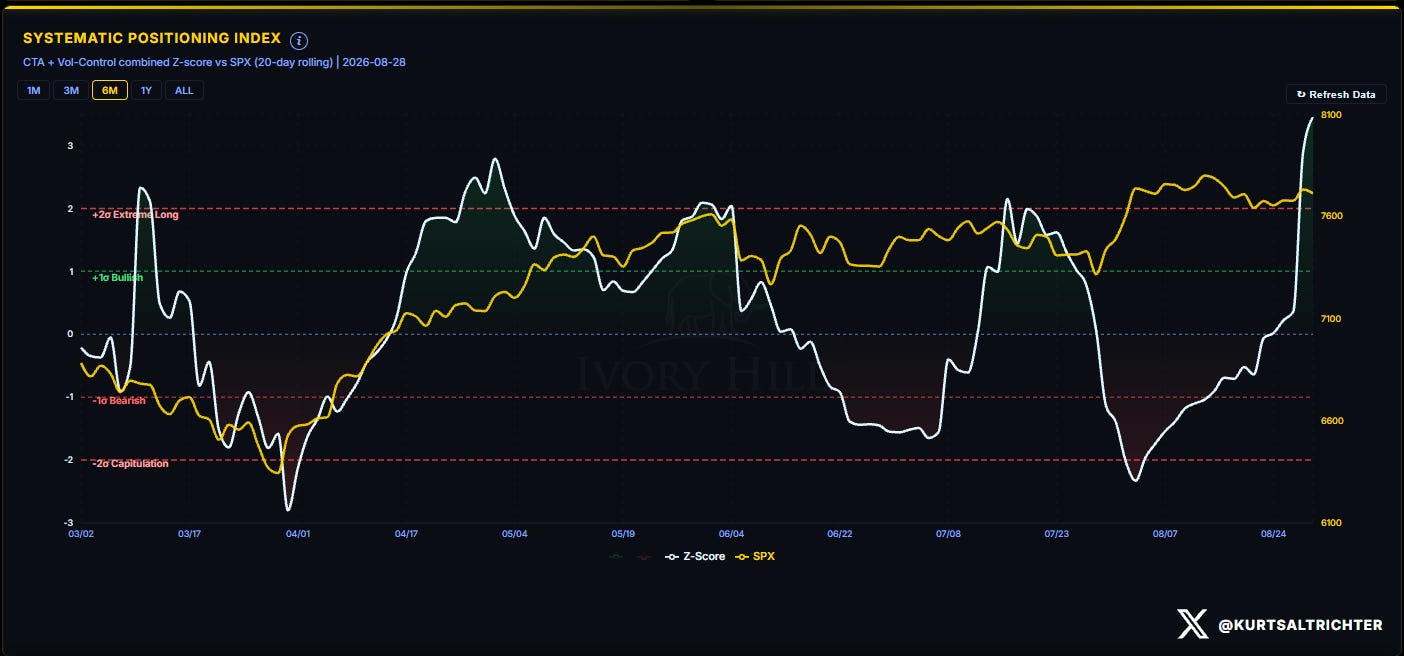
The combined z-score didn’t just recover; it spiked. After sitting near the plus 1 bullish line last week, it jumped through plus 2 by Friday, the highest reading anywhere in the 6-month window and territory the index hasn’t touched since the rally off April’s lows. The CTA reversal above is the driver: two aggressive long days moved the 20-day rolling number further and faster than the underlying flow data alone would suggest. Positioning is now stretched on the long side, which typically means less dry powder to extend gains and more room for an air pocket on any disappointing print, exactly what Friday’s jobs data could deliver.
Market Breadth
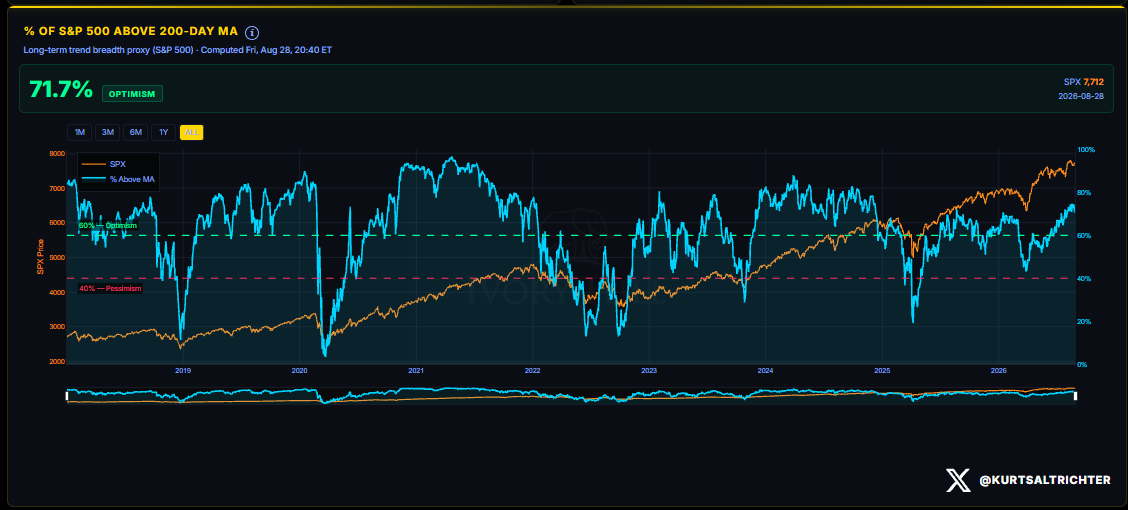
Breadth slipped again, to 71.7% of the S&P 500 above its 200-day moving average from 72.5% last week and 74.4% two weeks before that, the third straight weekly decline. Still solidly inside the optimism zone above 60%, but the trend is now three weeks old: fewer stocks are participating even as the index sits near highs.
Dealer Gamma Dashboard and Composite Regime
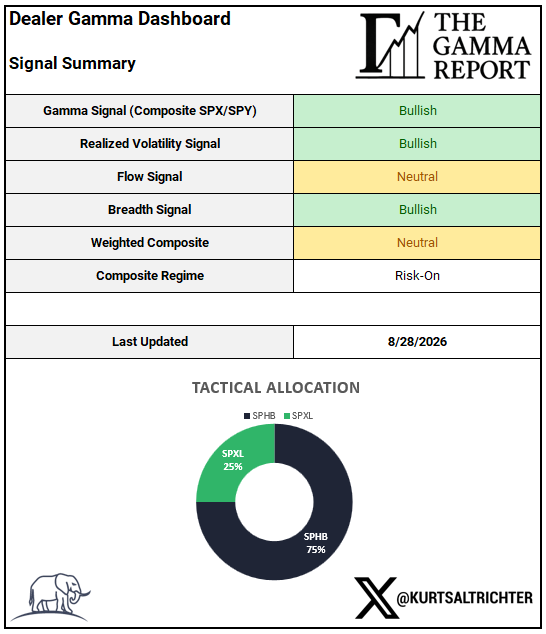
Gamma, realized volatility, and breadth all read bullish; flow is neutral given the CTA reversal, and the weighted composite stays neutral, same output as before dealers went negative two weeks ago. But the composite regime upgraded to Risk-On, and the allocation moved back with it: out of the 50% SPHB and 50% SPLV defensive split from two weeks ago, back into 75% SPHB and 25% SPXL.
Tactical Allocation Performance
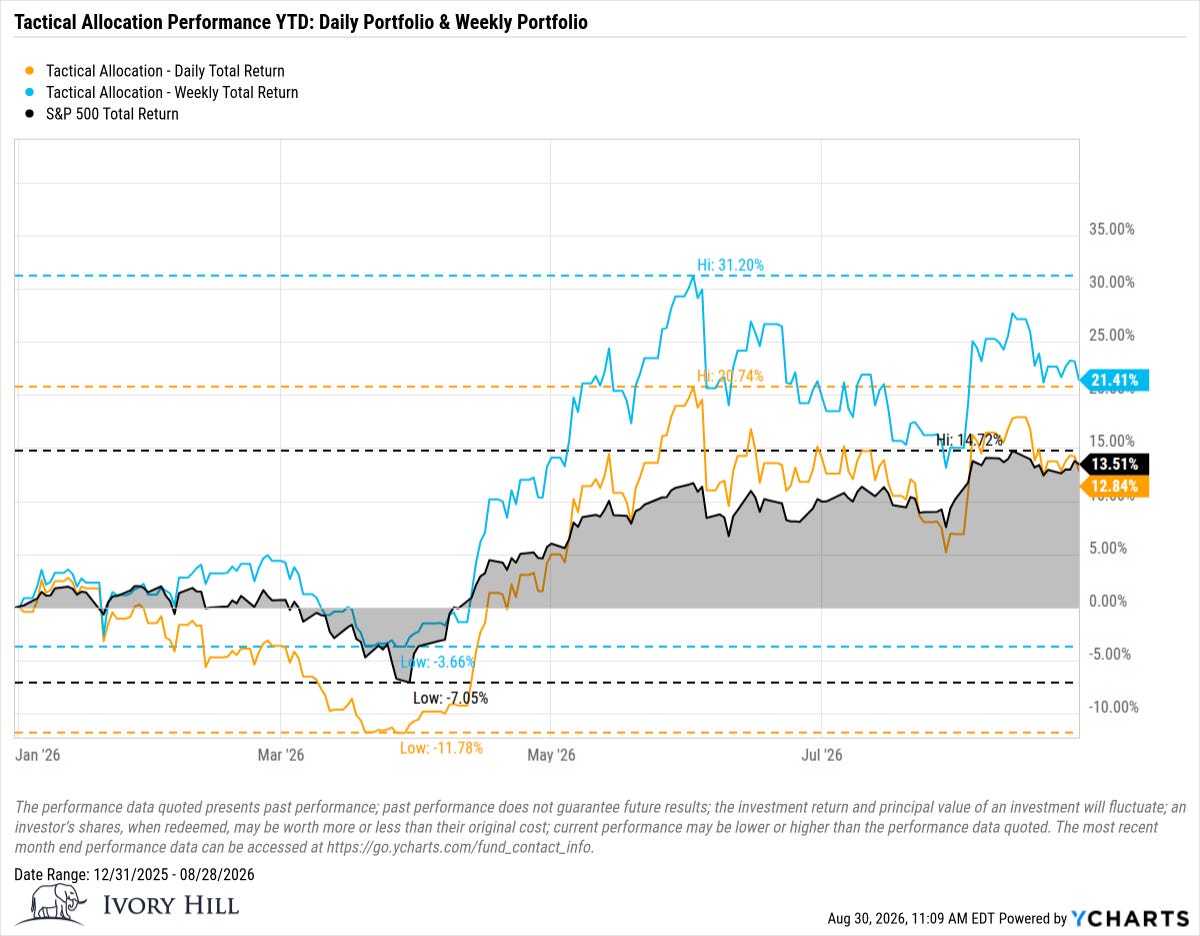
The weekly sleeve is down to 21.41% year-to-date from 22.66% last week. The daily sleeve fell to 12.84% from 13.76%, and with the S&P 500 total return now at 13.51% year-to-date, up from 12.95%, the daily sleeve is behind the index for the first time this cycle, by 0.67 points. The weekly sleeve’s lead also narrowed to 7.90 points from 9.71. This is a rules-based process, and two straight weeks of giveback while the benchmark grinds higher is exactly the stretch it’s built to survive, not the stretch that proves it wrong.
And remember: the one fact pertaining to all conditions is that they will change.
Feel free to use me as a sounding board.
Follow me on X for more updates.
Best regards,
Schedule a call with me by clicking HERE
Kurt S. Altrichter, CRPS®
Wealth Advisor | President
Disclosure
The Gamma Report is published by Ivory Hill, LLC. All opinions and views expressed in this report reflect our analysis as of the date of publication and are subject to change without notice. The information contained herein is for informational and educational purposes only and should not be considered specific investment advice or a recommendation to buy or sell any security.
The data, models, and tactical allocations discussed in this report are designed to illustrate market structure and positioning trends and may differ from portfolio decisions made by Ivory Hill, LLC or its affiliates. Investing involves risk, including the possible loss of principal. Past performance is not indicative of future results.
Ivory Hill, LLC, and its members, officers, directors, and employees expressly disclaim any and all liability for actions taken based on the information contained in this report.
The flip back to positive gamma is a useful contrast with the systematic positioning: spot is only 17 points above 7,695 while the combined z-score has pushed through +2. The note that GEX sits at 7,694 and the cushion is thin makes the dealer behavior easier for me to picture—buying dips and selling rips can suppress the range, but not remove event risk. The Friday 1.19% expected move puts that positioning tension in context.