

The S&P 500 closed Friday at 7,489.72, up 0.70% on the day and 9.41% year-to-date. Nasdaq Composite up 1.00% Friday and 9.17% for the year. Dow up 0.53% Friday at 52,485, tracking 9.20% YTD. The dispersion regime has not reversed. When four mega-cap names control the breadth signal, what you see is the market paying two premiums at once: one for AI optimism, one for defensive positioning against what comes next.
The allocation shifted this week to 75% SPHB / 25% SPXL. The move is tactical, not strategic. Gamma sits 12 points beneath the 7,490 spot, which means dealers are short and absorbing weakness rather than amplifying it. That is the only fact that matters this week as earnings and macro data arrive.
Asset Performance
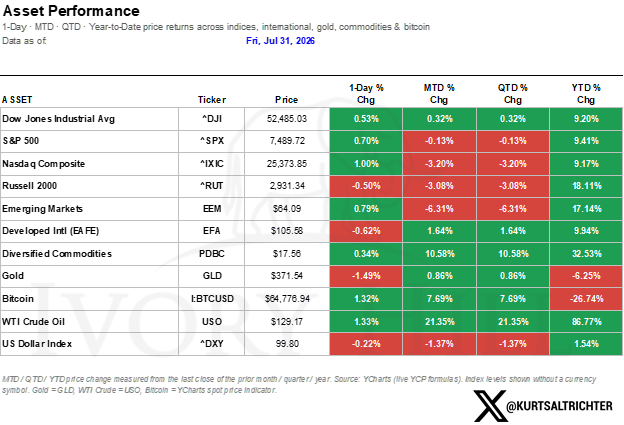
While the futures this morning would have you thinking otherwise, energy is the only asset class printing new highs. Crude at +86.77% YTD is an extreme read that typically signals either stagflation risk or geopolitical premium. When oil runs this hard this late in the year, and equity volatility sits neutral, it means the tape is pricing two different things at once: upside for rates staying high, downside for rates staying high. That conflict is what cap allocators are trying to hedge into.
Implied Correlation
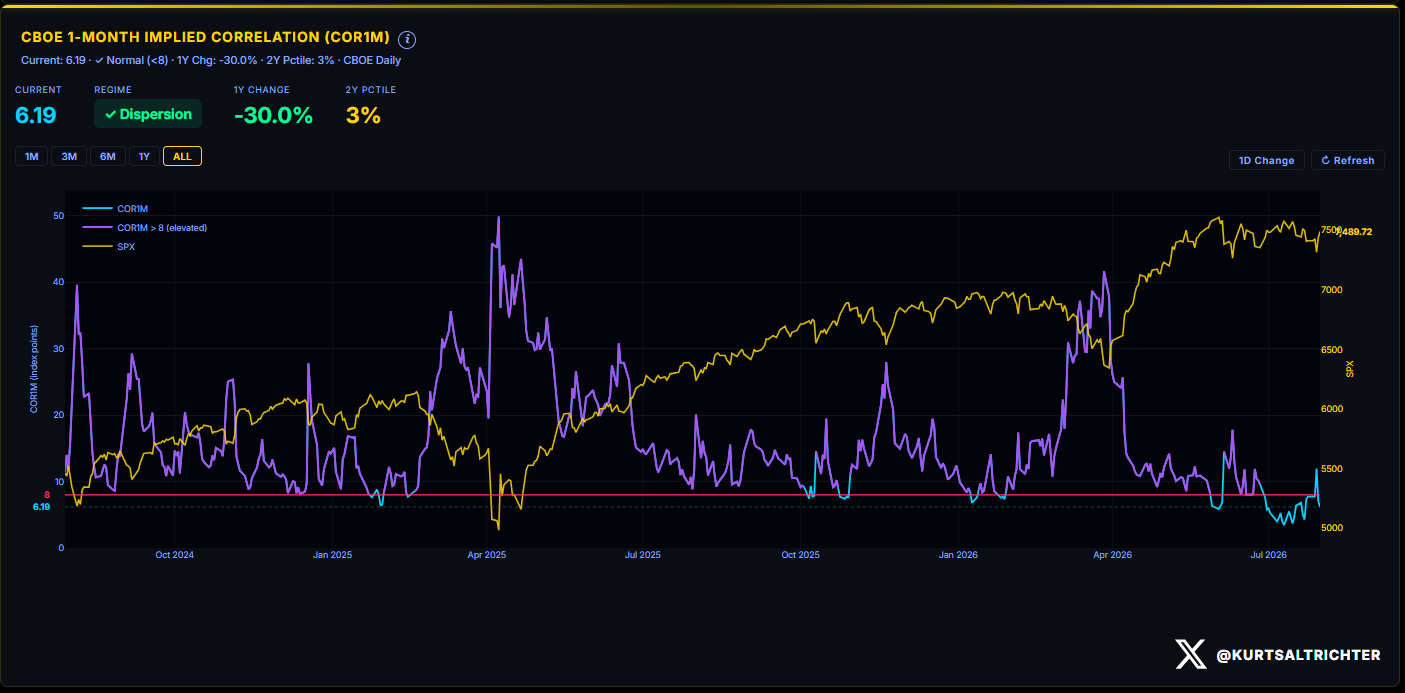
One-month implied correlation sits at 6.19, the tightest reading in two years at the third percentile historically. The one-year change is -30.0%, meaning the market has compressed from dispersed into concentrated. This is the regime that precedes either a breakout or a breakdown with no middle ground. When the broadest index is driven by the fewest names, vol sits pinned, and breadth cannot provide a cushion. That is the mechanical risk.
Vol Term Structure & Economic Calendar
One-month realized vol is 12.16, three-month is 13.44. The term structure is flat and low. The regime is low-vol, which means vol-targeting funds remain de-leveraged and stay there until realized vol climbs past the 13.5 band. This week brings Initial Jobless Claims Wednesday, followed by Average Hourly Earnings, Nonfarm Payrolls, and Unemployment Rate Thursday. CPI and Core CPI land Tuesday next week. These events sit in the high-impact bucket and are marked on the vol surface already.
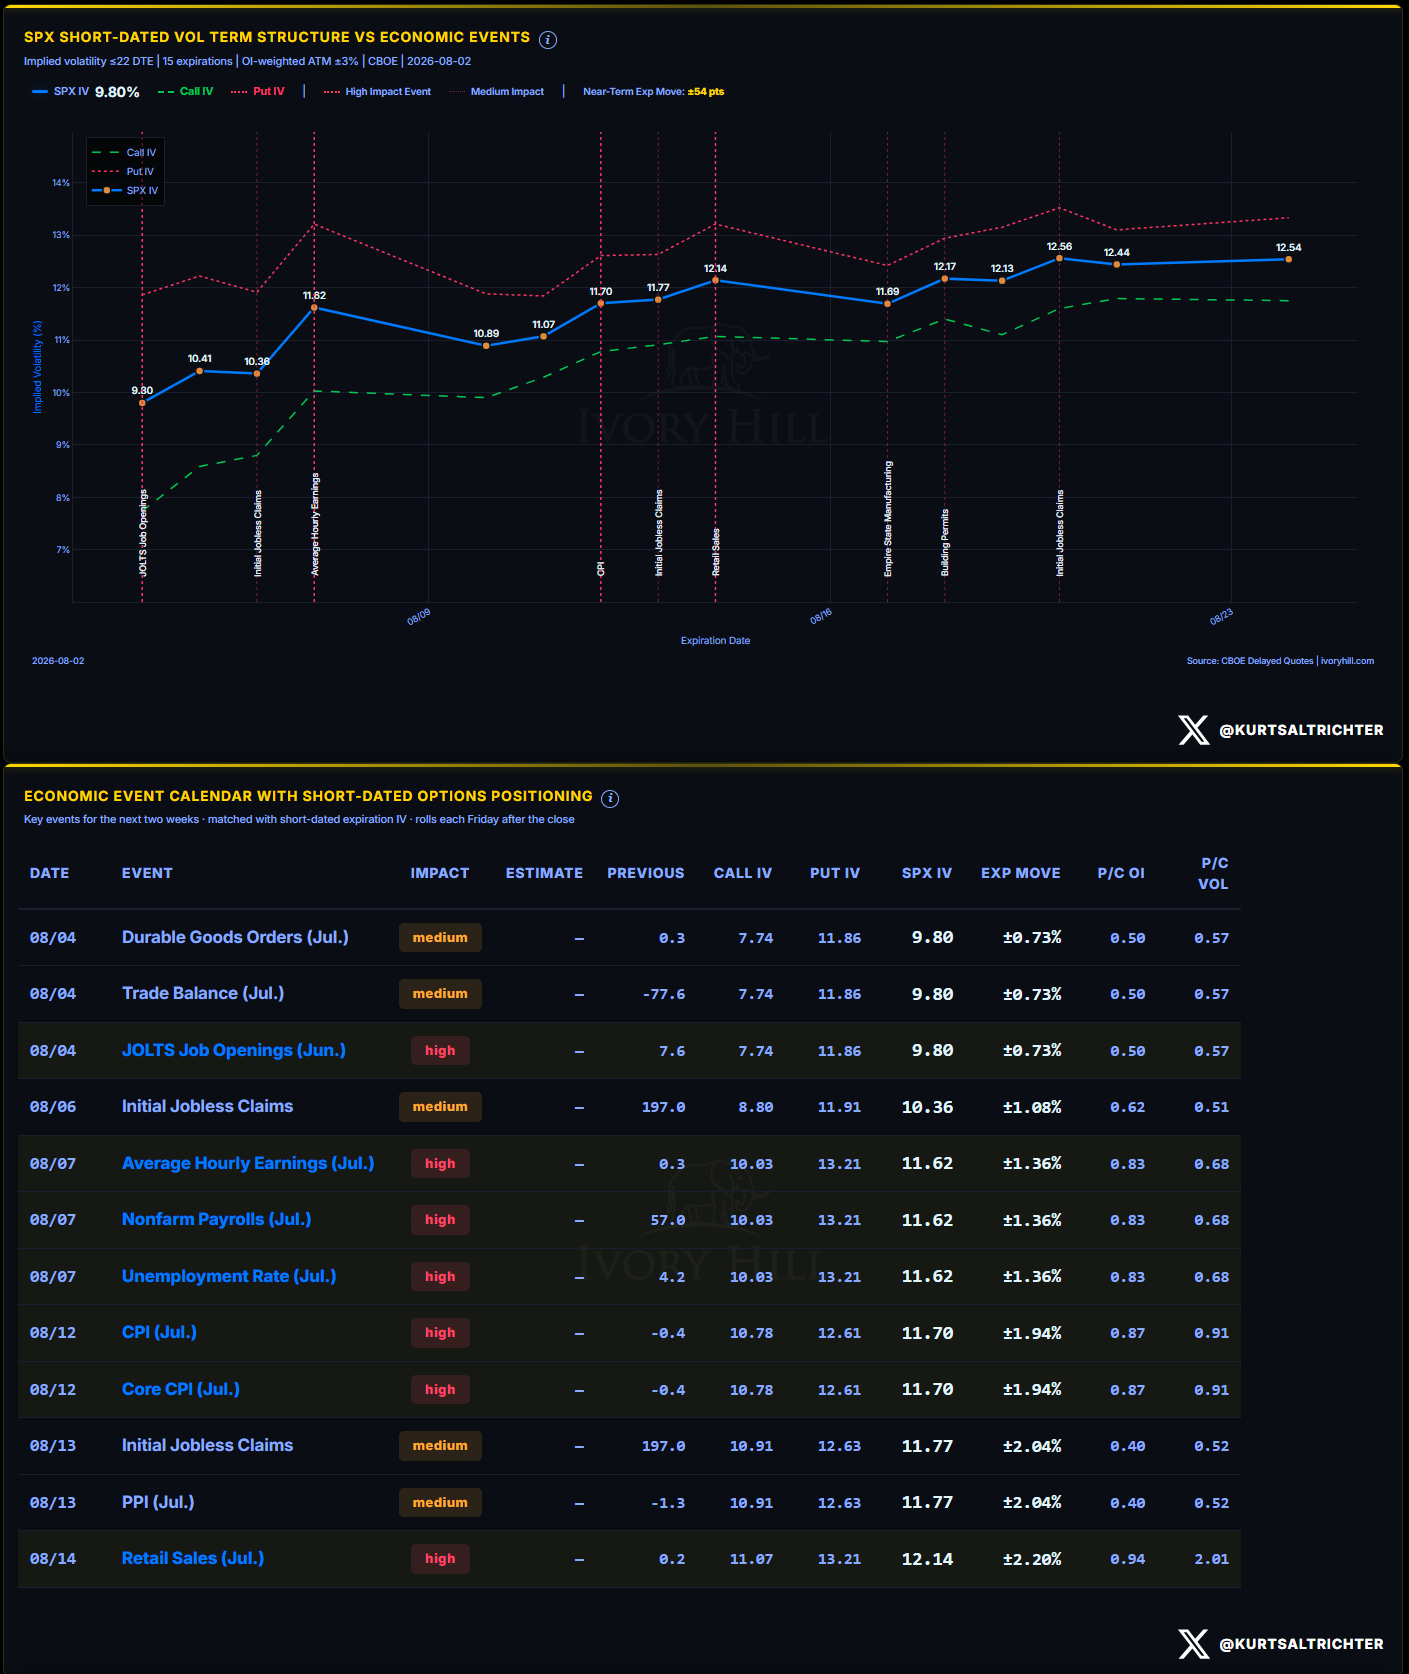
The vol surface shows put IV trading consistently higher than call IV across the event calendar. Put IV at 13.21 against call IV at 10.03 ahead of Thursday’s jobs data, with the P/C vol ratio at 0.68. That premium on puts is defensive skew, meaning traders are pricing downside tail risk into the tape ahead of these prints. The market is not complacent on the data arriving.
Earnings
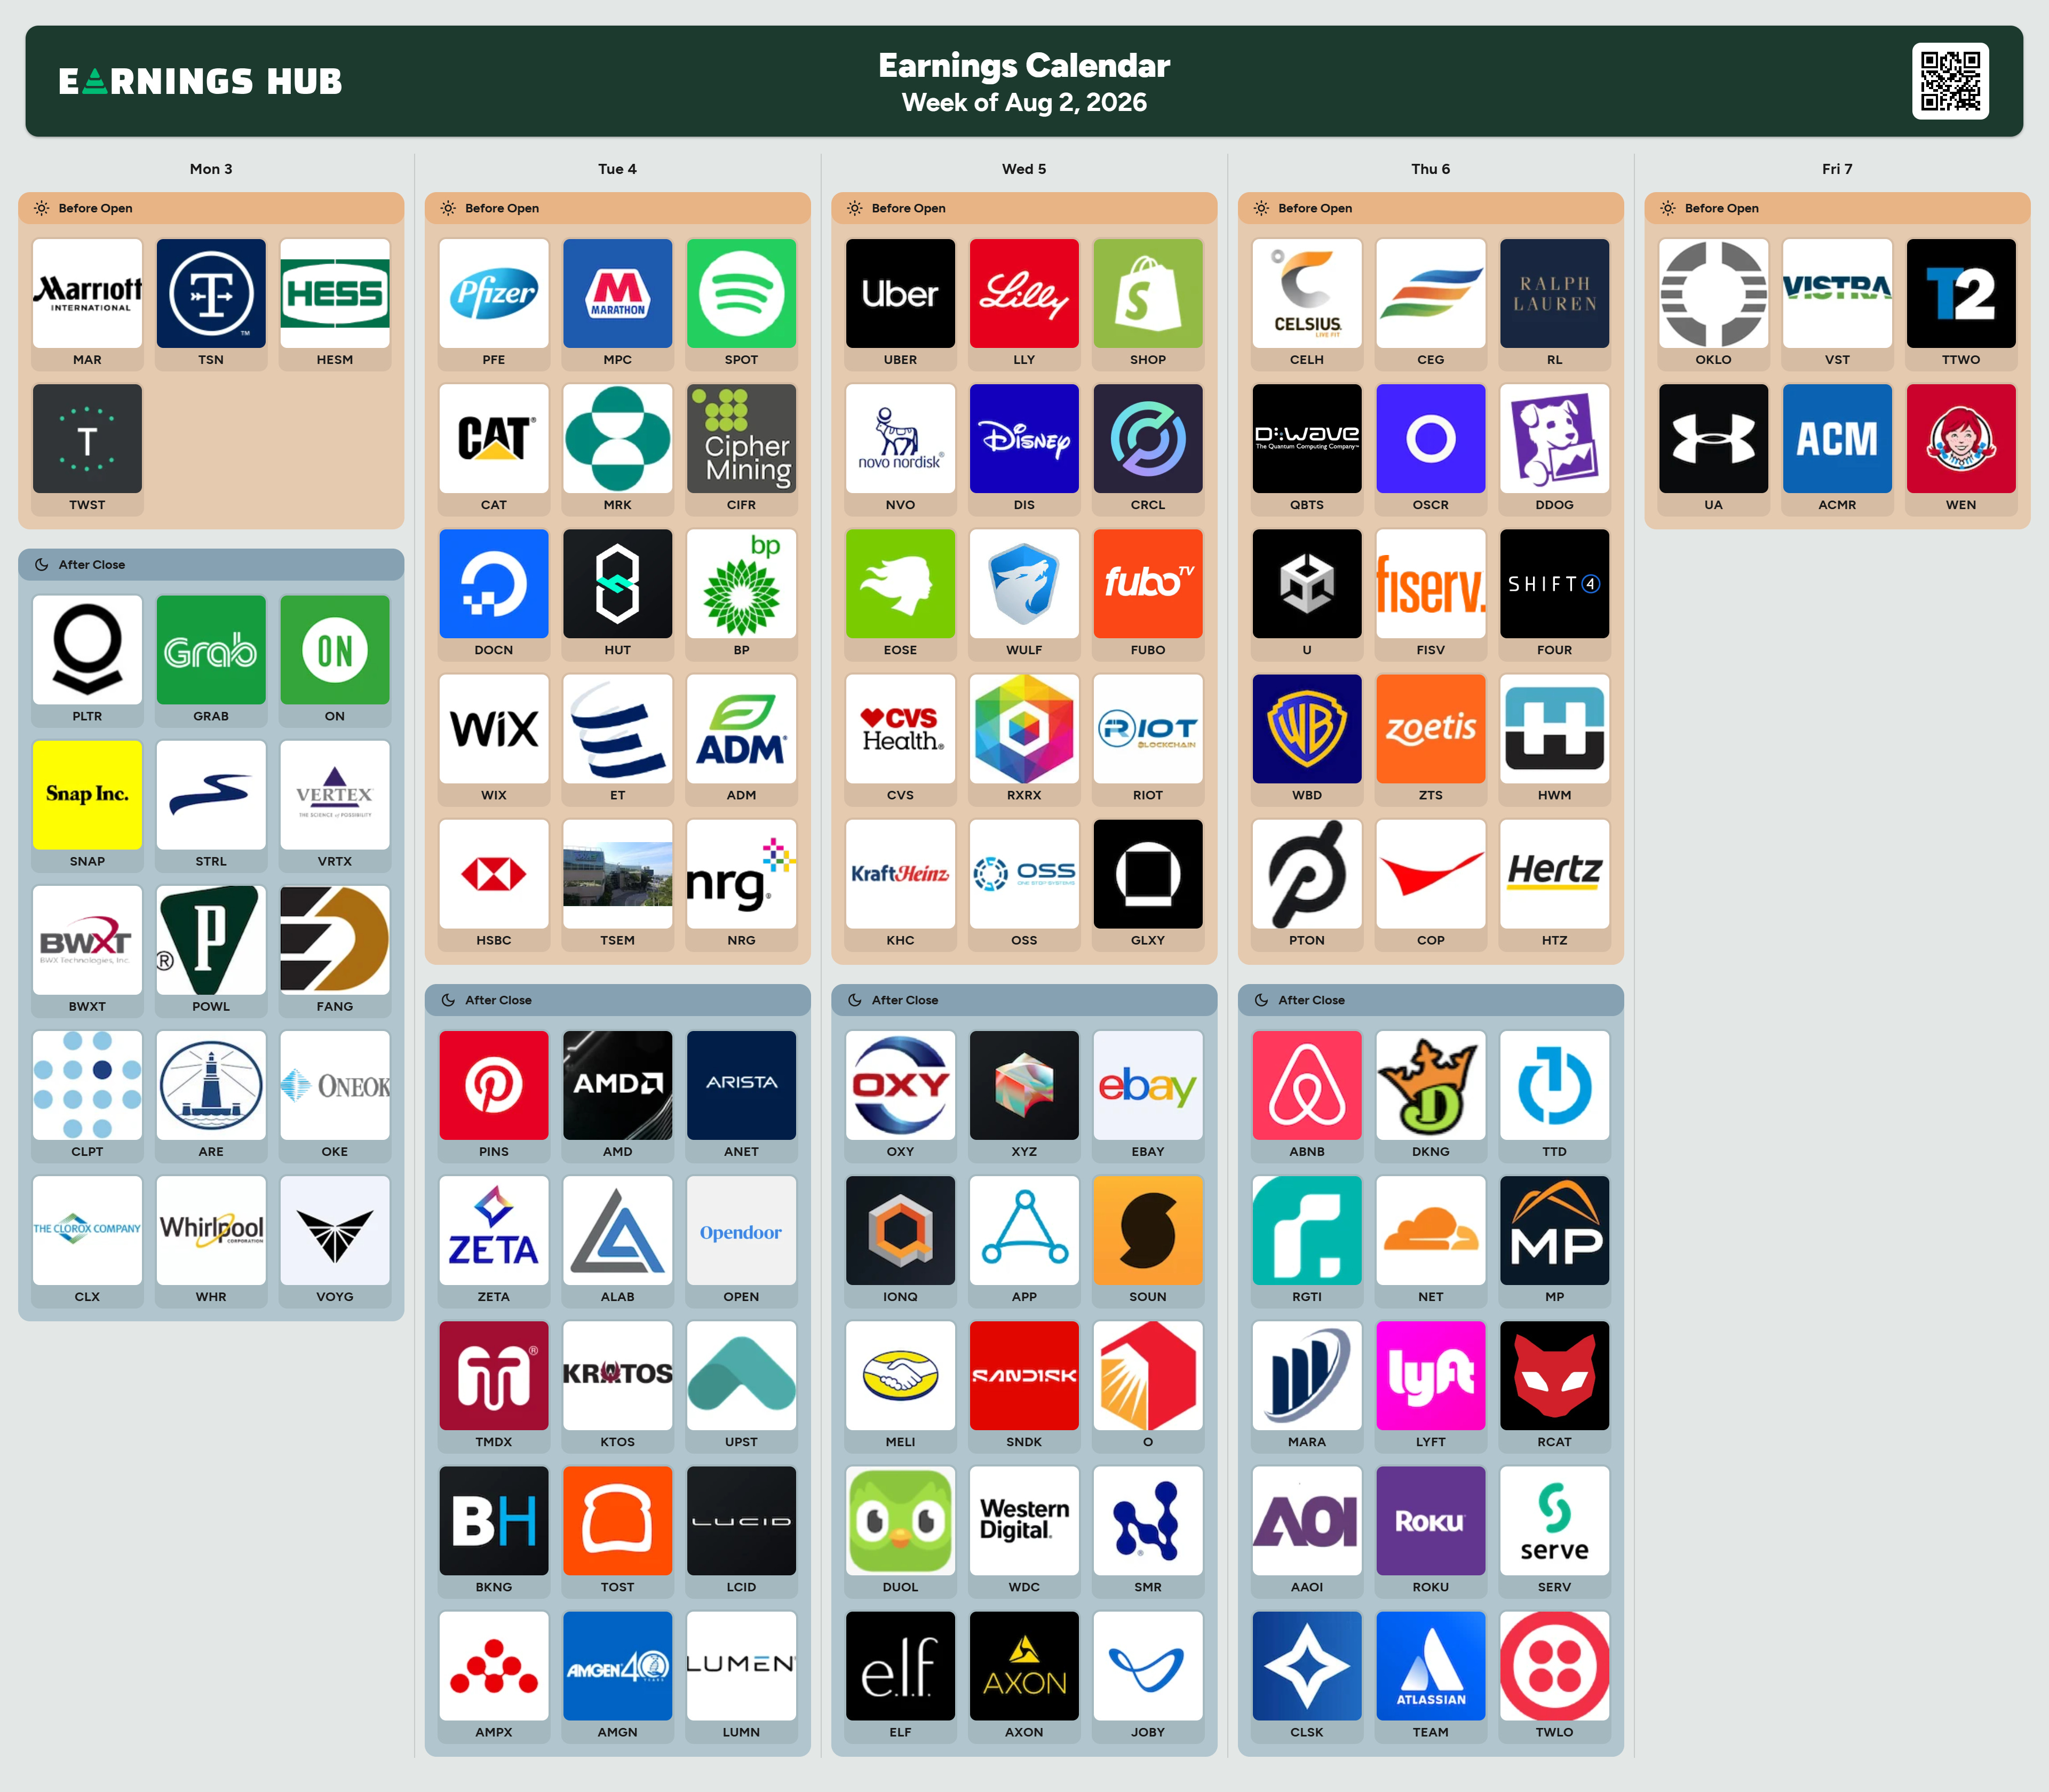
Lam Research, Seagate, and Coherent report this week. The semiconductor capital equipment cycle is the single tell on whether the AI capex cycle continues to sustain growth or rolls over. Lam misses on guidance, the cycle is real; Lam guides up, the cycle holds. That result is binary and moves the entire sector.
Three weeks running the earnings calendar brought execution misses in hardware and storage names. This week’s reports will answer whether those misses were cyclical or structural. The market has been building out 2026 guidance at 7.5 to 8% earnings growth. A rollover in capex spending invalidates that entirely.
Sector Momentum
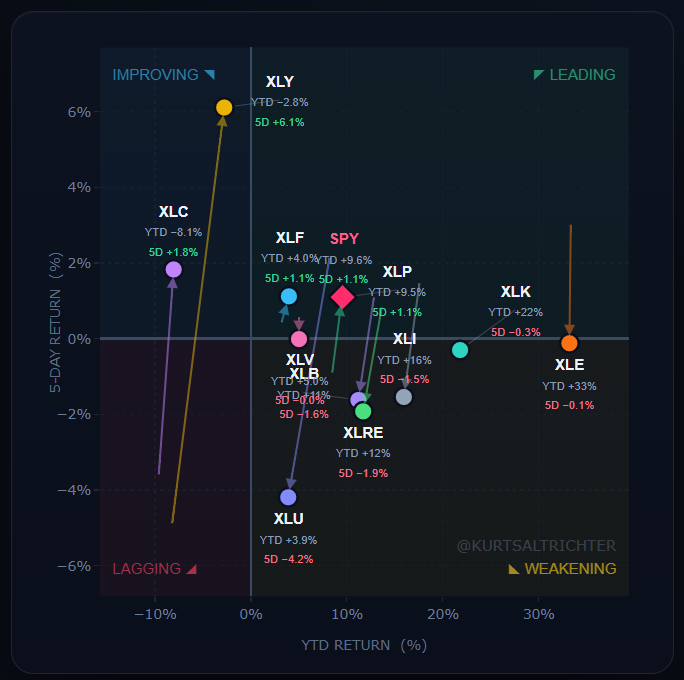
Energy sits at +33% year-to-date but momentum is stalling. XLE is flat on the 5-day at -0.1%, which means the carry trade that funded the entire rally is losing steam. Tech is +22% YTD but also rolling over 5-day at -0.3%. Both leaders are decelerating into the data week ahead, which is bearish for anyone long strength.
The real move is discretionary. XLY is the worst-performing sector year-to-date at -2.8% but up 6.1% on the 5-day, a massive reversal. Communications XLC is down 8.1% YTD and up 1.0% on the 5-day, also recovering. That mean reversion is the only thing working. Utilities are the only true break. XLU is down 4.2% on the 5-day despite being up 3.9% for the year, which signals defensive positioning is not working and capital is fleeing safety. Materials XLB is a structural disaster at -11% YTD with no 5-day bid. Industrials and real estate are both rolling over from YTD strength, confirming that breadth is cracking fast.
Single-Name Momentum Universe
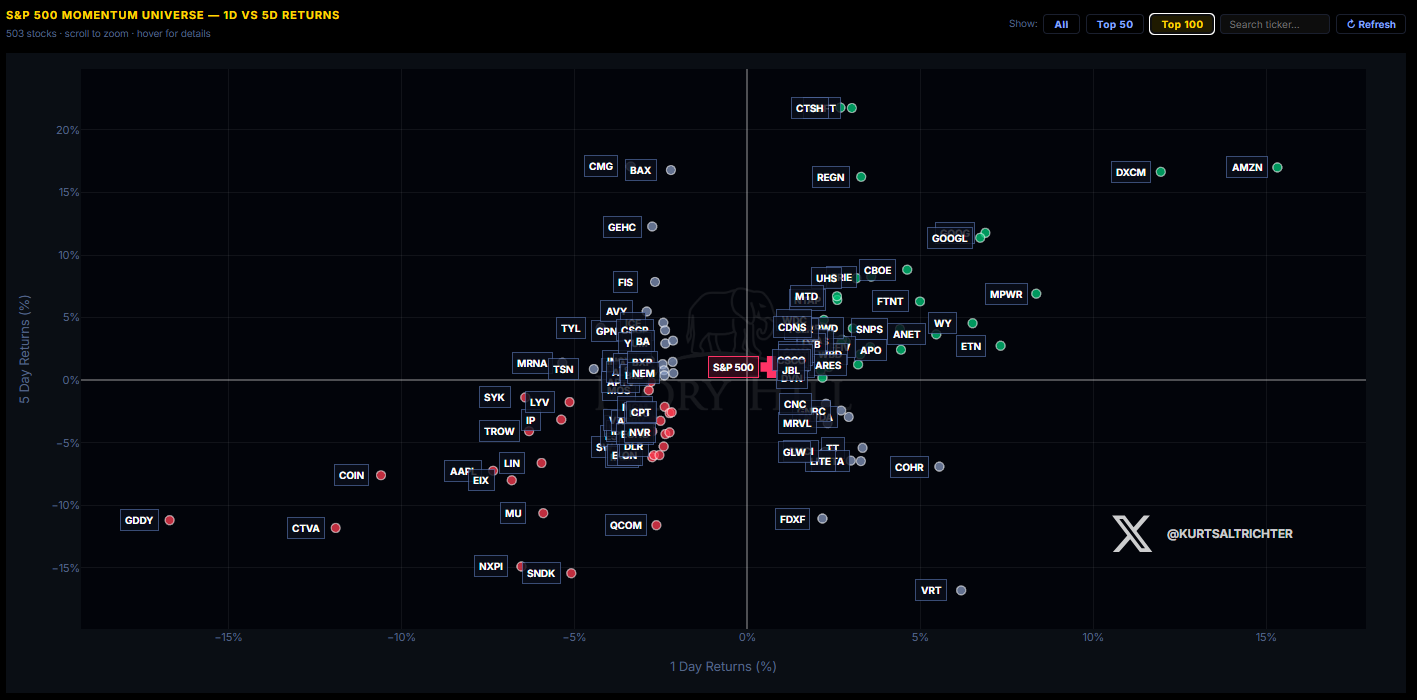
The dispersion is extreme and structural. The right side is all mega-cap cloud and software: CTSH at +22%, AMZN +15%, GOOGL +12%, DXCM +15%. These names are positive on both 1-day and 5-day, which means momentum is self-reinforcing and capital is not rotating out.
The left side is a semiconductor graveyard. NXPI, SNDK, MU, QCOM all trade with red X indicators showing they are momentum shorts. NXPI sits at -15% 1D and -17% 5D. SNDK is -12% and -15%. MU is -5% on the day but -12% on the 5-day, which signals capitulation is playing out in slow motion. CTVA is -10% on both axes. The entire hardware complex that powered the first half is now in the bottom-left corner with no bid.
The center holds the bulk of the index at zero, which means the S&P 500 itself is a barbell: extreme winners in software and mega-cap cloud platforms, extreme losers in semiconductors and capital equipment, and nothing in between. That barbell breaks when the leaders stop levitating. The moment AMZN or GOOGL rolls over, the gap below them is 25% down, and there is no support to catch it.
Market Structure: Gamma Flip & Weekly Expected Move
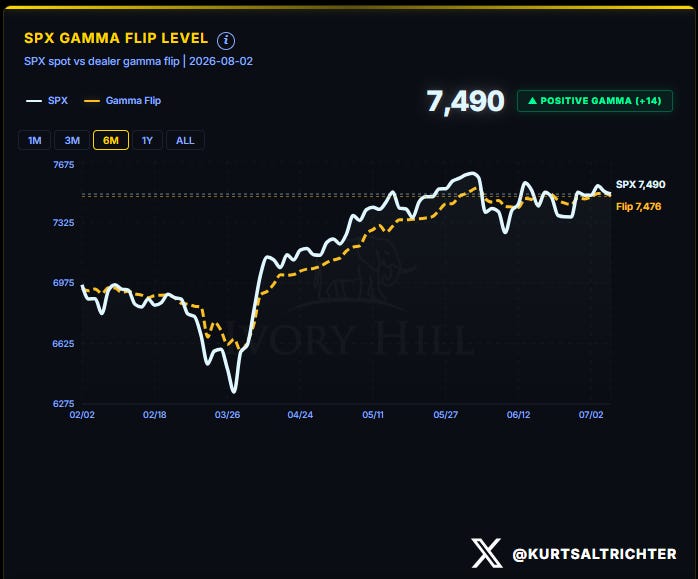
The gamma flip sits at 7,476. The spot level is 7,490, which puts dealers 14 points short of the flip line. Positive gamma is currently +14M notional, showing in the weighted gamma exposure chart as a modest cushion above spot.
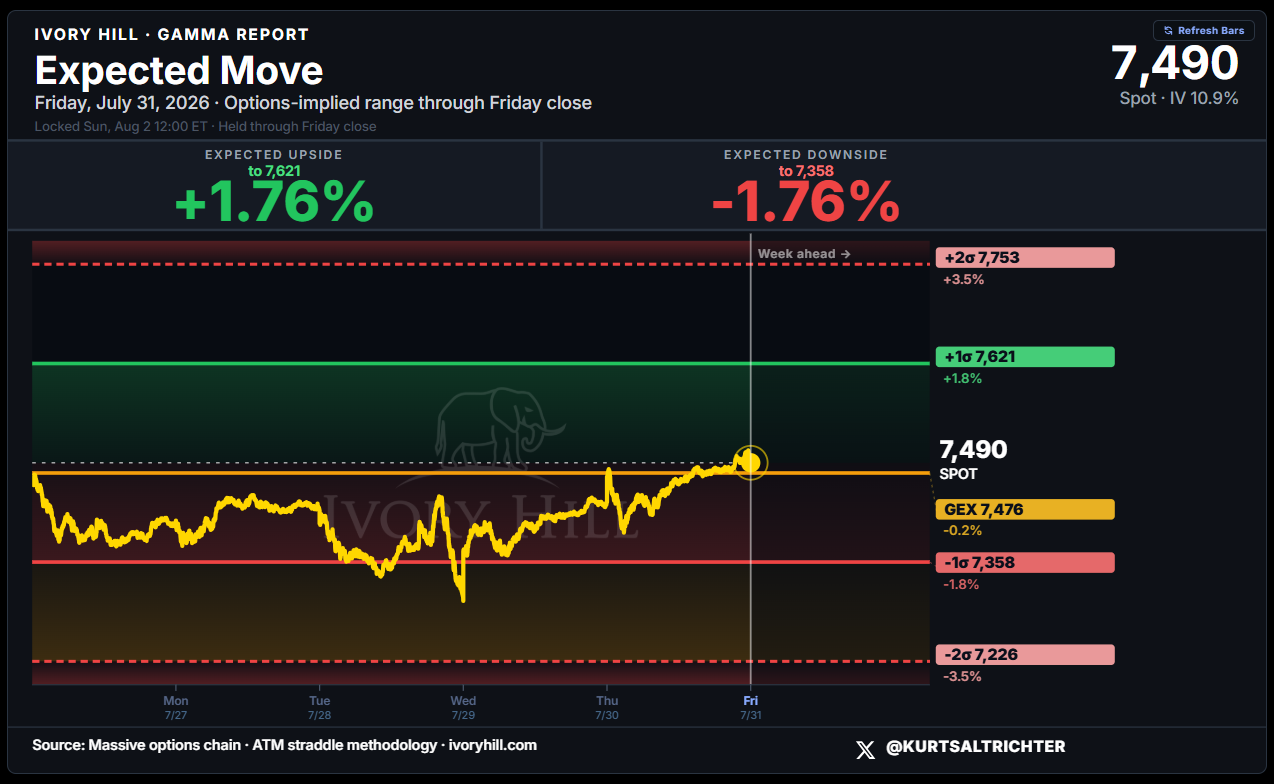
The one-sigma expected move is 1.76% in either direction off the 7,490 close. That band runs from 7,621 on the upside to 7,358 on the downside. That is the operating range dealers are hedged for. The gamma flip sits at 7,476, which puts us 14 points inside the one-sigma band on the downside. A break below 7,476 forces dealers negative, which accelerates any move lower. A hold above 7,476 keeps dealers short and neutral.
The two-sigma band (roughly 3.5% in either direction) extends to 7,753 on the upside and 7,226 on the downside, which is where the true tail risk lives. That wider band is the “if the data breaks hard” scenario. For now, dealers are hedged for 1.76%, and that is what you trade until data arrives.
Volatility Regime
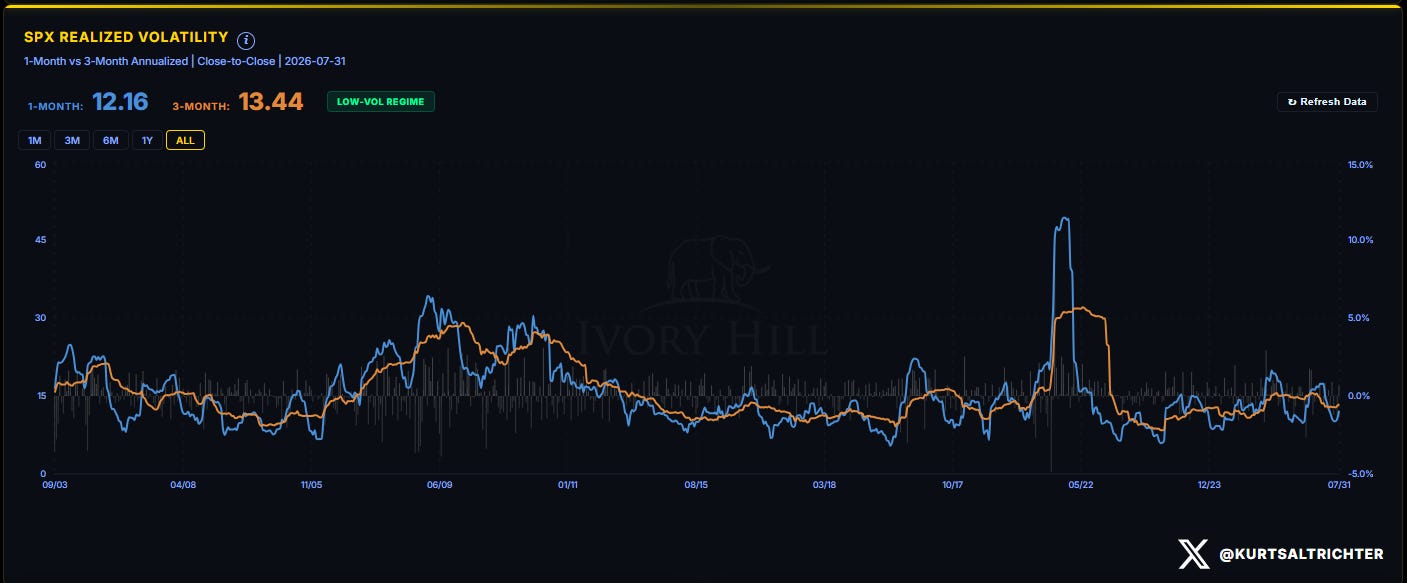
One-month realized volatility sits at 12.16, well beneath the three-month at 13.44. The regime reads low-vol and keeps vol-control funds allocated. Realized vol fell further on the week as price swings compressed and intraday ranges tightened. The low-vol regime has persisted for eight weeks now, which means vol-targeting programs remain leveraged to the downside. A single day of realized vol above 18 forces a 15% unwind in notional exposure across the vol-control universe. That is the mechanical risk in place.
Systematic Fund Flows: The Situational Awareness Unwinding
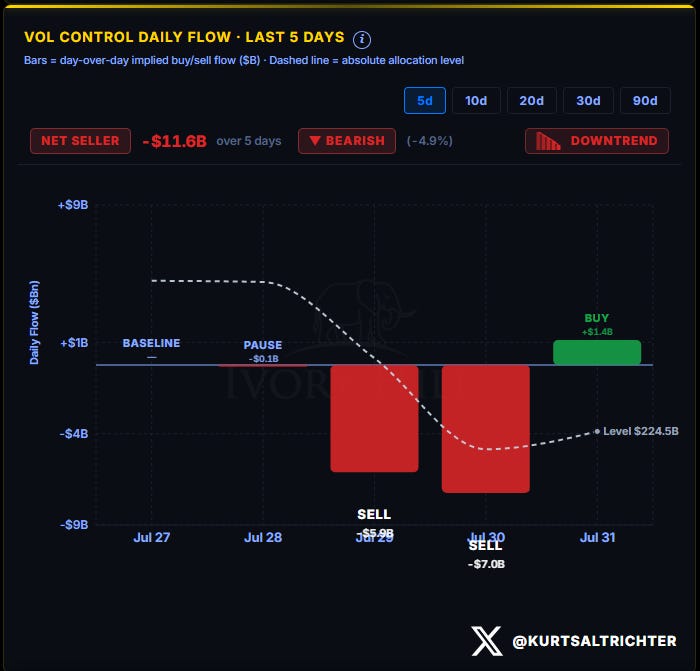
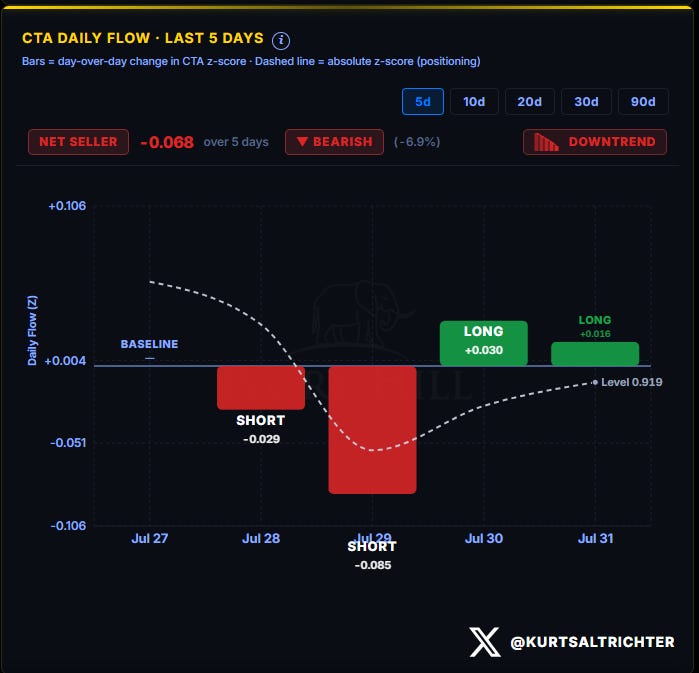
Vol-control funds were net sellers of 11.6 billion over the past five days, marking the largest five-day outflow since the March selloff. The selling accelerated Tuesday and Wednesday, hitting a peak sell of 7 billion Thursday before a partial recovery Friday morning. The absolute allocation level sits at 224.5 billion, roughly 75% of the 300 billion pool, which means the formula has keyed off the higher of one-month and three-month realized vol. That binding is what persists until realized vol falls further.
CTA positioning is the more interesting tell. The vol-normalized signal dropped from near the top of its range toward flat, and the combined systematic z-score moved from +2 sigma two weeks ago to +1 sigma now. The mechanical long that turned every June dip into a buy is half gone. That cuts in two directions: less forced selling if this week breaks, and less forced buying if this week holds.
What happened here matters because it is not random. Leopold Aschenbrenner’s Situational Awareness fund managed close to 45 billion at its peak, running a 1,000% cumulative return since launch and 439% gains in the first half of 2026 alone. The fund carried massive leverage on a concentrated long equity portfolio targeting AI hardware and semiconductor capex beneficiaries. When the AI stock rotation began in mid-July, the feedback loop was vicious: mark-to-market losses on leveraged positions forced margin calls. On July 29, those margin calls came. By July 30, Citadel acquired roughly 16 billion worth of Situational Awareness’s public equity holdings at a substantial discount in a brief “bidding” process. Assets under management collapsed from 45 billion to 10 billion in hours.
That forced liquidation is exactly what you see printed in the vol-control daily flows chart. Tuesday through Thursday is the mechanical consequence of a large leveraged long equity book being liquidated into existing volatility. The chart shows a baseline allocation level around 1 billion, then a pause of 50 basis points on Tuesday as the selling began, then three days of net selling hitting 4 billion on Wednesday and 9 billion on Thursday before a partial recovery Friday. That recovery is Friday’s AI stock rally, which itself was triggered by the news that Situational Awareness kept its private portfolio of AI companies intact, including a significant stake in Anthropic valued at 965 billion in a Series H round in May.
The vol-control flows did not move randomly. They moved because a single highly leveraged fund’s liquidation force-fed mark-to-market losses into a formula-driven seller that has no discretion and no ability to absorb sudden capital flows. CTA positioning normalized at the same time, meaning the mechanical long that had been amplifying every bid since June is now neutral, reducing the upside amplification on any further strength but also reducing the downside amplification on any breakdown.
Both flows signals improved Friday into the close, but both are bearish on a five-day basis. The vol-control fund sits at absolute levels that mean any further decline in realized vol will force additional rebalancing higher into what could be a declining market. The CTA sits at neutral, meaning it is neither pushing nor pulling into Friday’s close or into the data next week.
Positioning Index: Systematic Z-Score
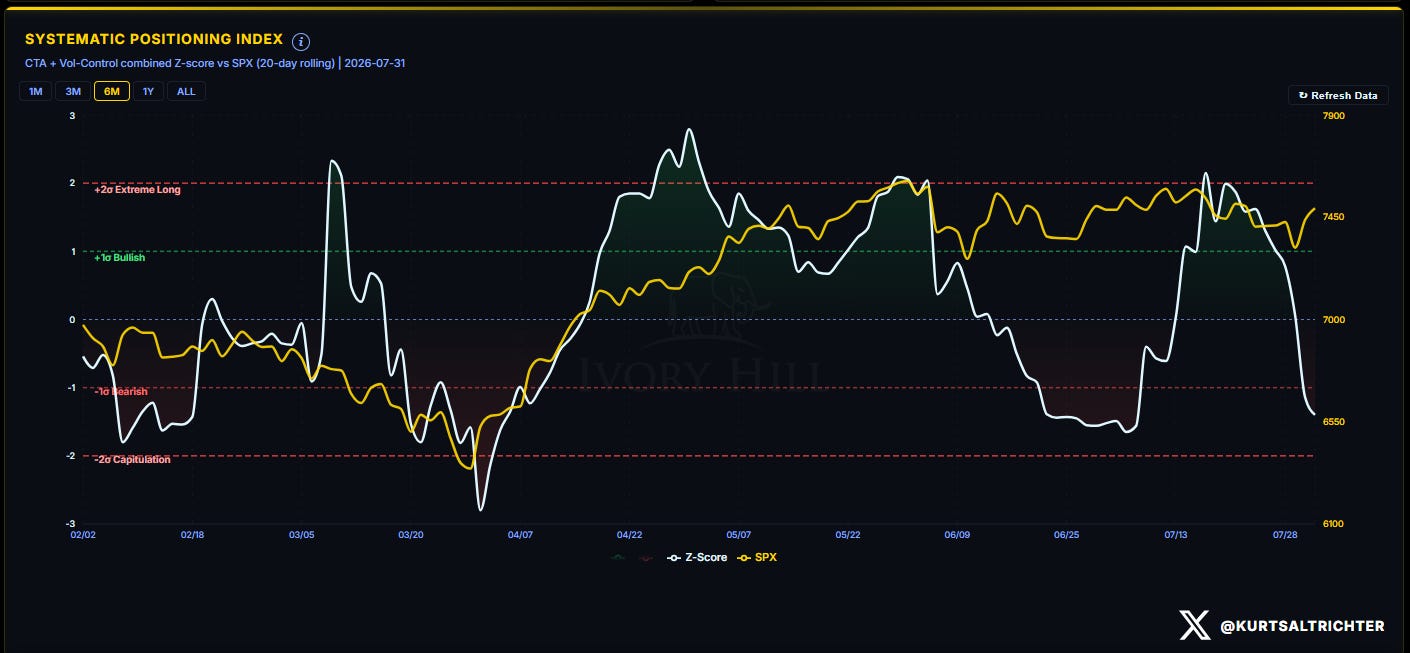
The combined CTA and vol-control z-score sits at roughly -1 sigma against near +2 sigma two weeks ago. The vol-normalized signal is the primary driver of that drop, with the CTA trend portion normalizing from extreme long readings.
Market Breadth
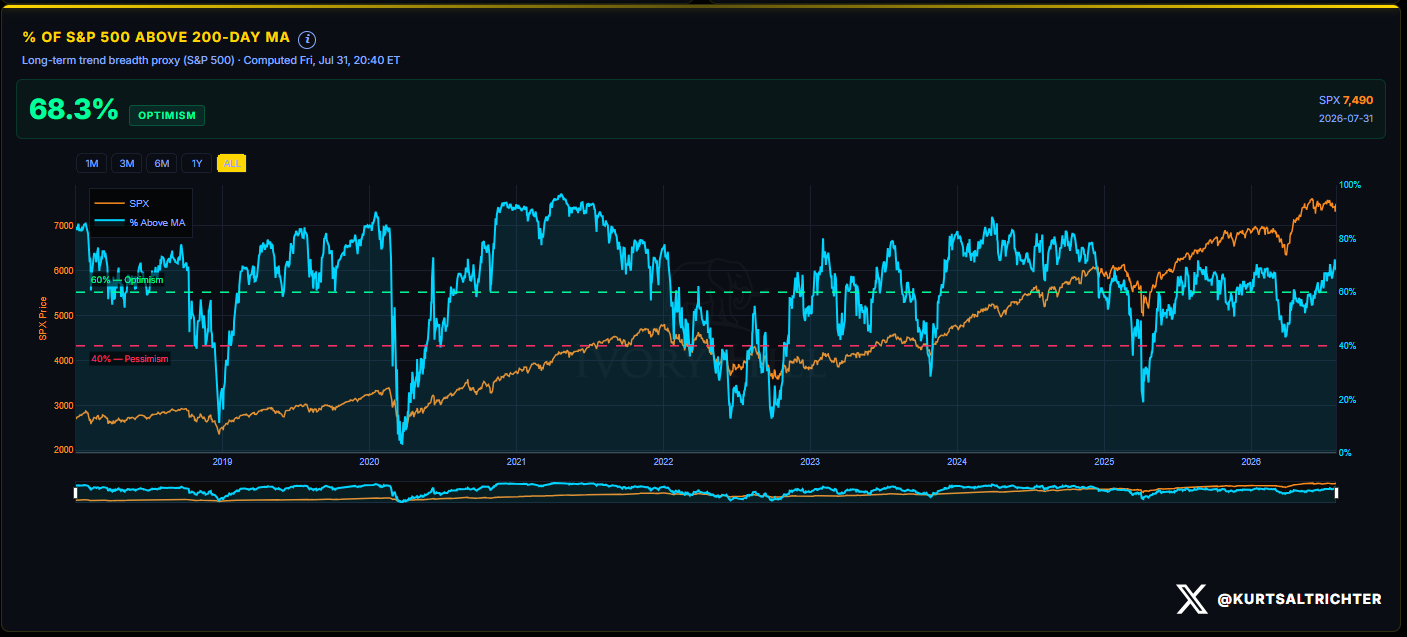
Breadth is 68.3% of the S&P 500 above its 200-day moving average, down from 70.5% two weeks ago but still solidly in optimism territory and far from the 40% pessimism line. The reading is stable and leaves room for either reversion higher or a gradual drift lower without signaling panic.
Dealer Gamma Dashboard
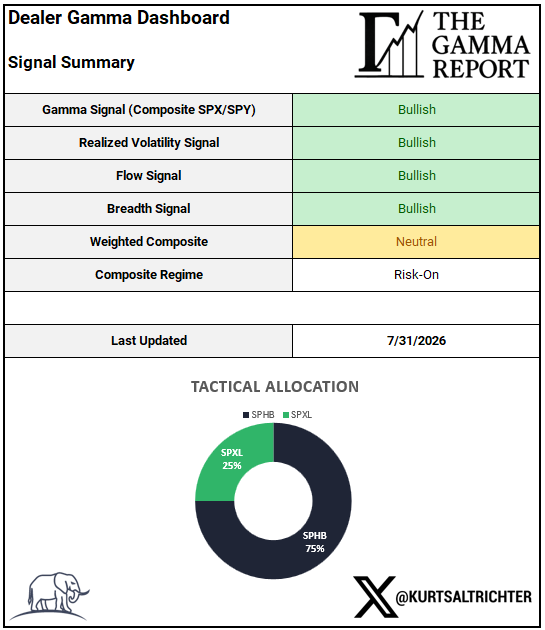
The individual signals remain bullish across gamma, realized vol, flow, and breadth. The weighted composite lands Neutral because those four signals carry different conviction levels and the weighting caps the combined read at the zero line. The regime output is Risk-On, which reflects that the four bullish signals outweigh the neutral weighted composite. The allocation reflects that ambiguity: 75% SPHB (defensive beta) and 25% SPXL (growth beta), a tilt toward safety within the risk-on framework.
Tactical Allocation Performance YTD
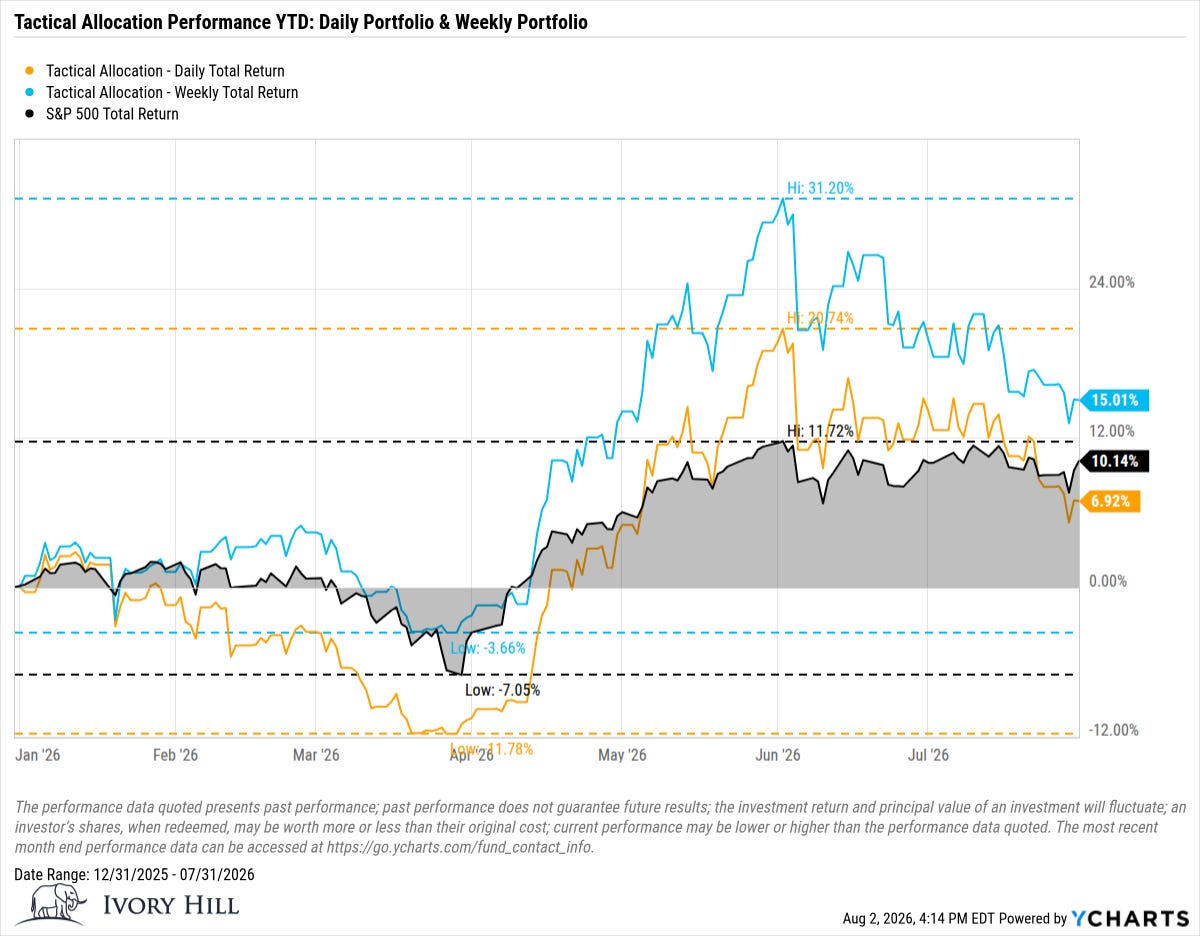
The weekly sleeve sits at 15.01% year-to-date against the S&P 500 at 10.14%. The daily sleeve sits at 6.92%, trailing the index by 3.22%. The gap between weekly and daily performance reflects the allocation’s sensitivity to the vol-control rebalancing cycle. Weeks that see outflows force defensive positioning late Friday and keep damage light. Weeks that see inflows build leverage early Monday and capture strength early. This week’s early selling pressure will reset that dynamic.
Closing Position
The market is priced for a benign data week. Thursday and Friday will say whether that assumption holds. A beat on jobless claims or a miss on Core PCE re-opens the case for rate cuts that the Fed closed on July 31. A miss on claims or a beat on PCE keeps the case for cuts closed and rates at current levels indefinitely. The vol surface is not overextended in either direction and leaves room for a 2 to 3% move in spot level without breaking the technical picture.
And remember: the one fact pertaining to all conditions is that they will change.
Feel free to use me as a sounding board.
Follow me on X for more updates.
Best regards,
Schedule a call with me by clicking HERE
Kurt S. Altrichter, CRPS®
Wealth Advisor | President
Disclosure
The Gamma Report is published by Ivory Hill, LLC. All opinions and views expressed in this report reflect our analysis as of the date of publication and are subject to change without notice. The information contained herein is for informational and educational purposes only and should not be considered specific investment advice or a recommendation to buy or sell any security.
The data, models, and tactical allocations discussed in this report are designed to illustrate market structure and positioning trends and may differ from portfolio decisions made by Ivory Hill, LLC or its affiliates. Investing involves risk, including the possible loss of principal. Past performance is not indicative of future results.
Ivory Hill, LLC, and its members, officers, directors, and employees expressly disclaim any and all liability for actions taken based on the information contained in this report.