

The S&P 500 closed Friday at 7,718.60, up 0.09% for the week after round-tripping more than a hundred points in four sessions. Dealers spent Monday through Wednesday in negative gamma, then flipped positive Thursday when the index cleared 7,747 and held that footing into Friday’s close. This is the second straight week the flip line broke by Thursday and held through Friday.
Underneath, CTAs sold hard Monday, bought back through Wednesday, then sold again lightly into Friday, a net seller for the five days even as the combined positioning z-score stayed pinned above the plus-2 extreme-long line it broke through last week. Vol-control funds did nothing for four sessions, then bought $19.3 billion in one print Friday, the entire week’s net buying in a single day. Breadth kept sliding, down to 66.6 from 71.7% last week. Friday’s jobs data landed on top of all of it. The index fell 0.38% on the day, not the air pocket that the index was vulnerable to.
Asset Performance
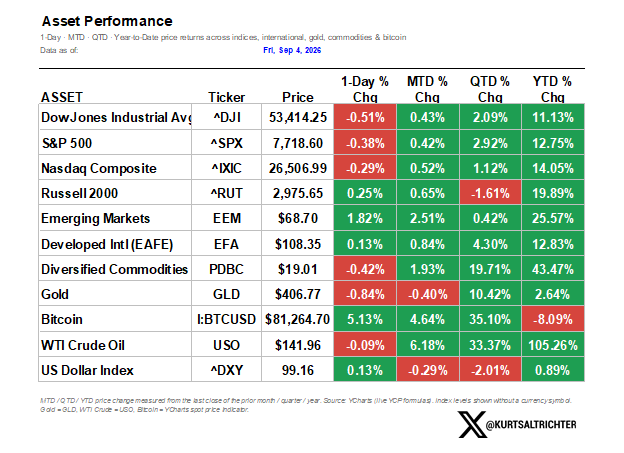
Bitcoin was the mover, up 5.13% on the day, cutting the year-to-date loss to negative 8.09% from negative 9.21% last week. Gold gave back another 0.84% Friday, on top of the 3.24% single-day drop from two weeks ago, but the quarter-to-date gain still holds at 10.42%. Emerging markets led the day at plus 1.82%, and the Russell 2000 still leads every domestic index on a year-to-date basis at 19.89%, even with a red quarter-to-date print of negative 1.61%. WTI crude sat almost flat on the day at negative 0.09%, still up 33.37% for the quarter. The dollar firmed marginally, up 0.13%, doing nothing to interrupt a quarter that has it down 2.01%.
Implied Correlation
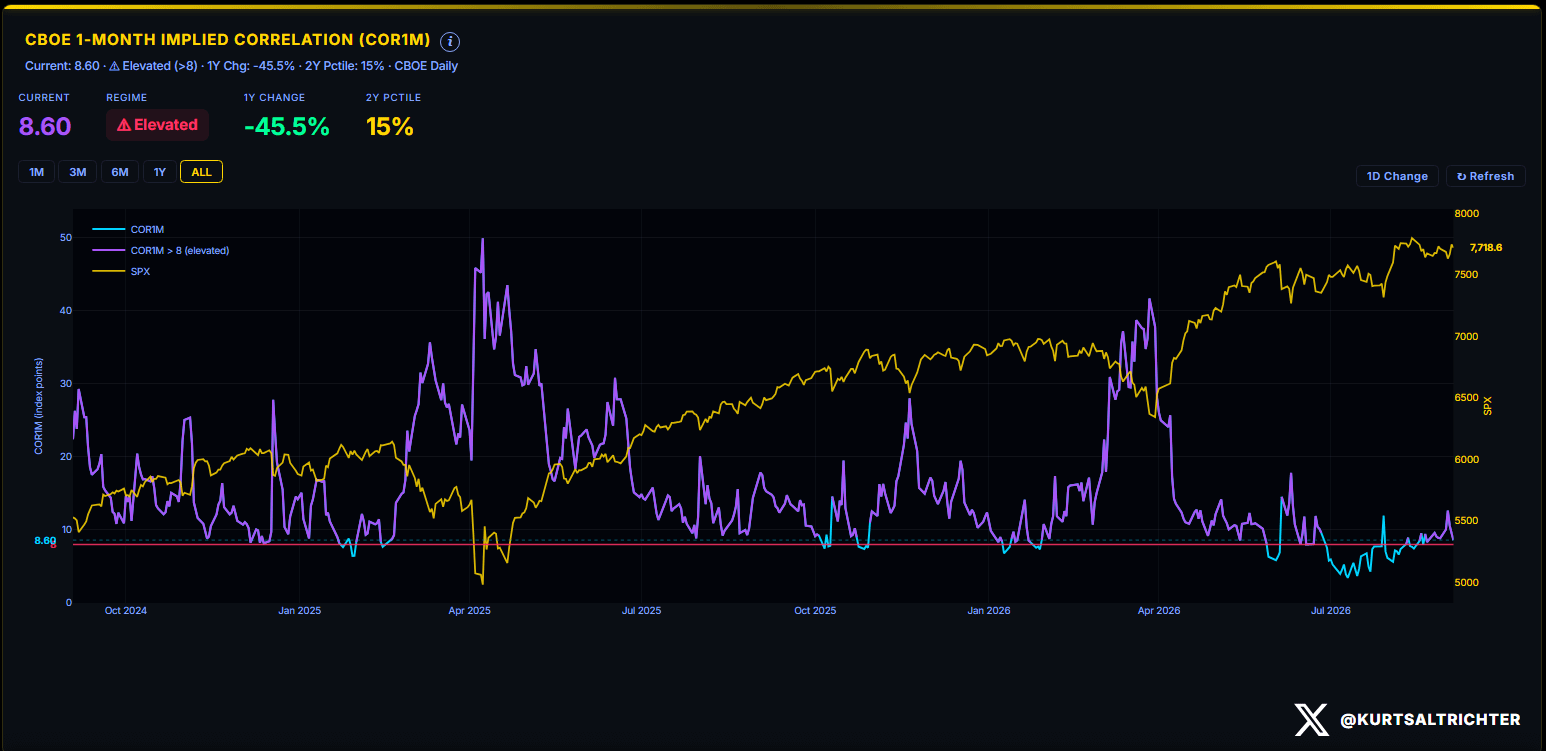
CBOE one-month implied correlation eased to 8.60 from 8.87 last week, still flagged elevated above the 8.0 threshold. The two-year percentile slipped to 15% from 18%, meaning even an elevated reading now sits closer to the bottom of its own two-year range. Correlation staying low keeps single names trading apart from the index, which the momentum universe below confirms directly, with the best and worst performers in the 503-name universe again pulling in opposite directions by a wide margin.
Vol Term Structure and Economic Calendar
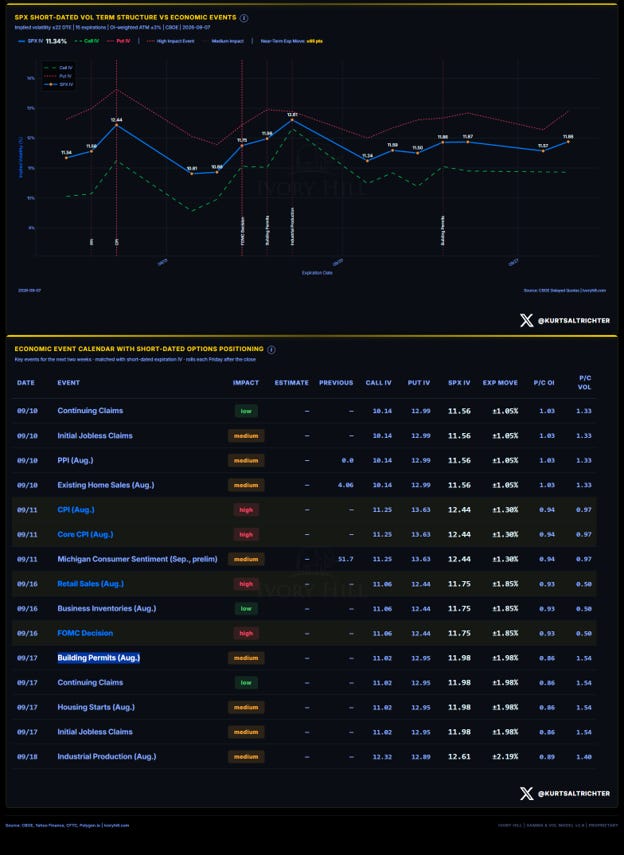
Front-dated SPX implied vol sits at 11.34%, this is cheap relative to what’s on the calendar. The first cluster lands September 10: Continuing Claims, Initial Jobless Claims, PPI, and Existing Home Sales, all lower-impact, priced at a ±1.05% expected move. CPI and Core CPI on September 11 are the first real test, pushing SPX IV up to 12.44% and a ±1.30% expected move, with put implied vol running 2.38 points above calls, the widest skew in the two-week window.
Earnings
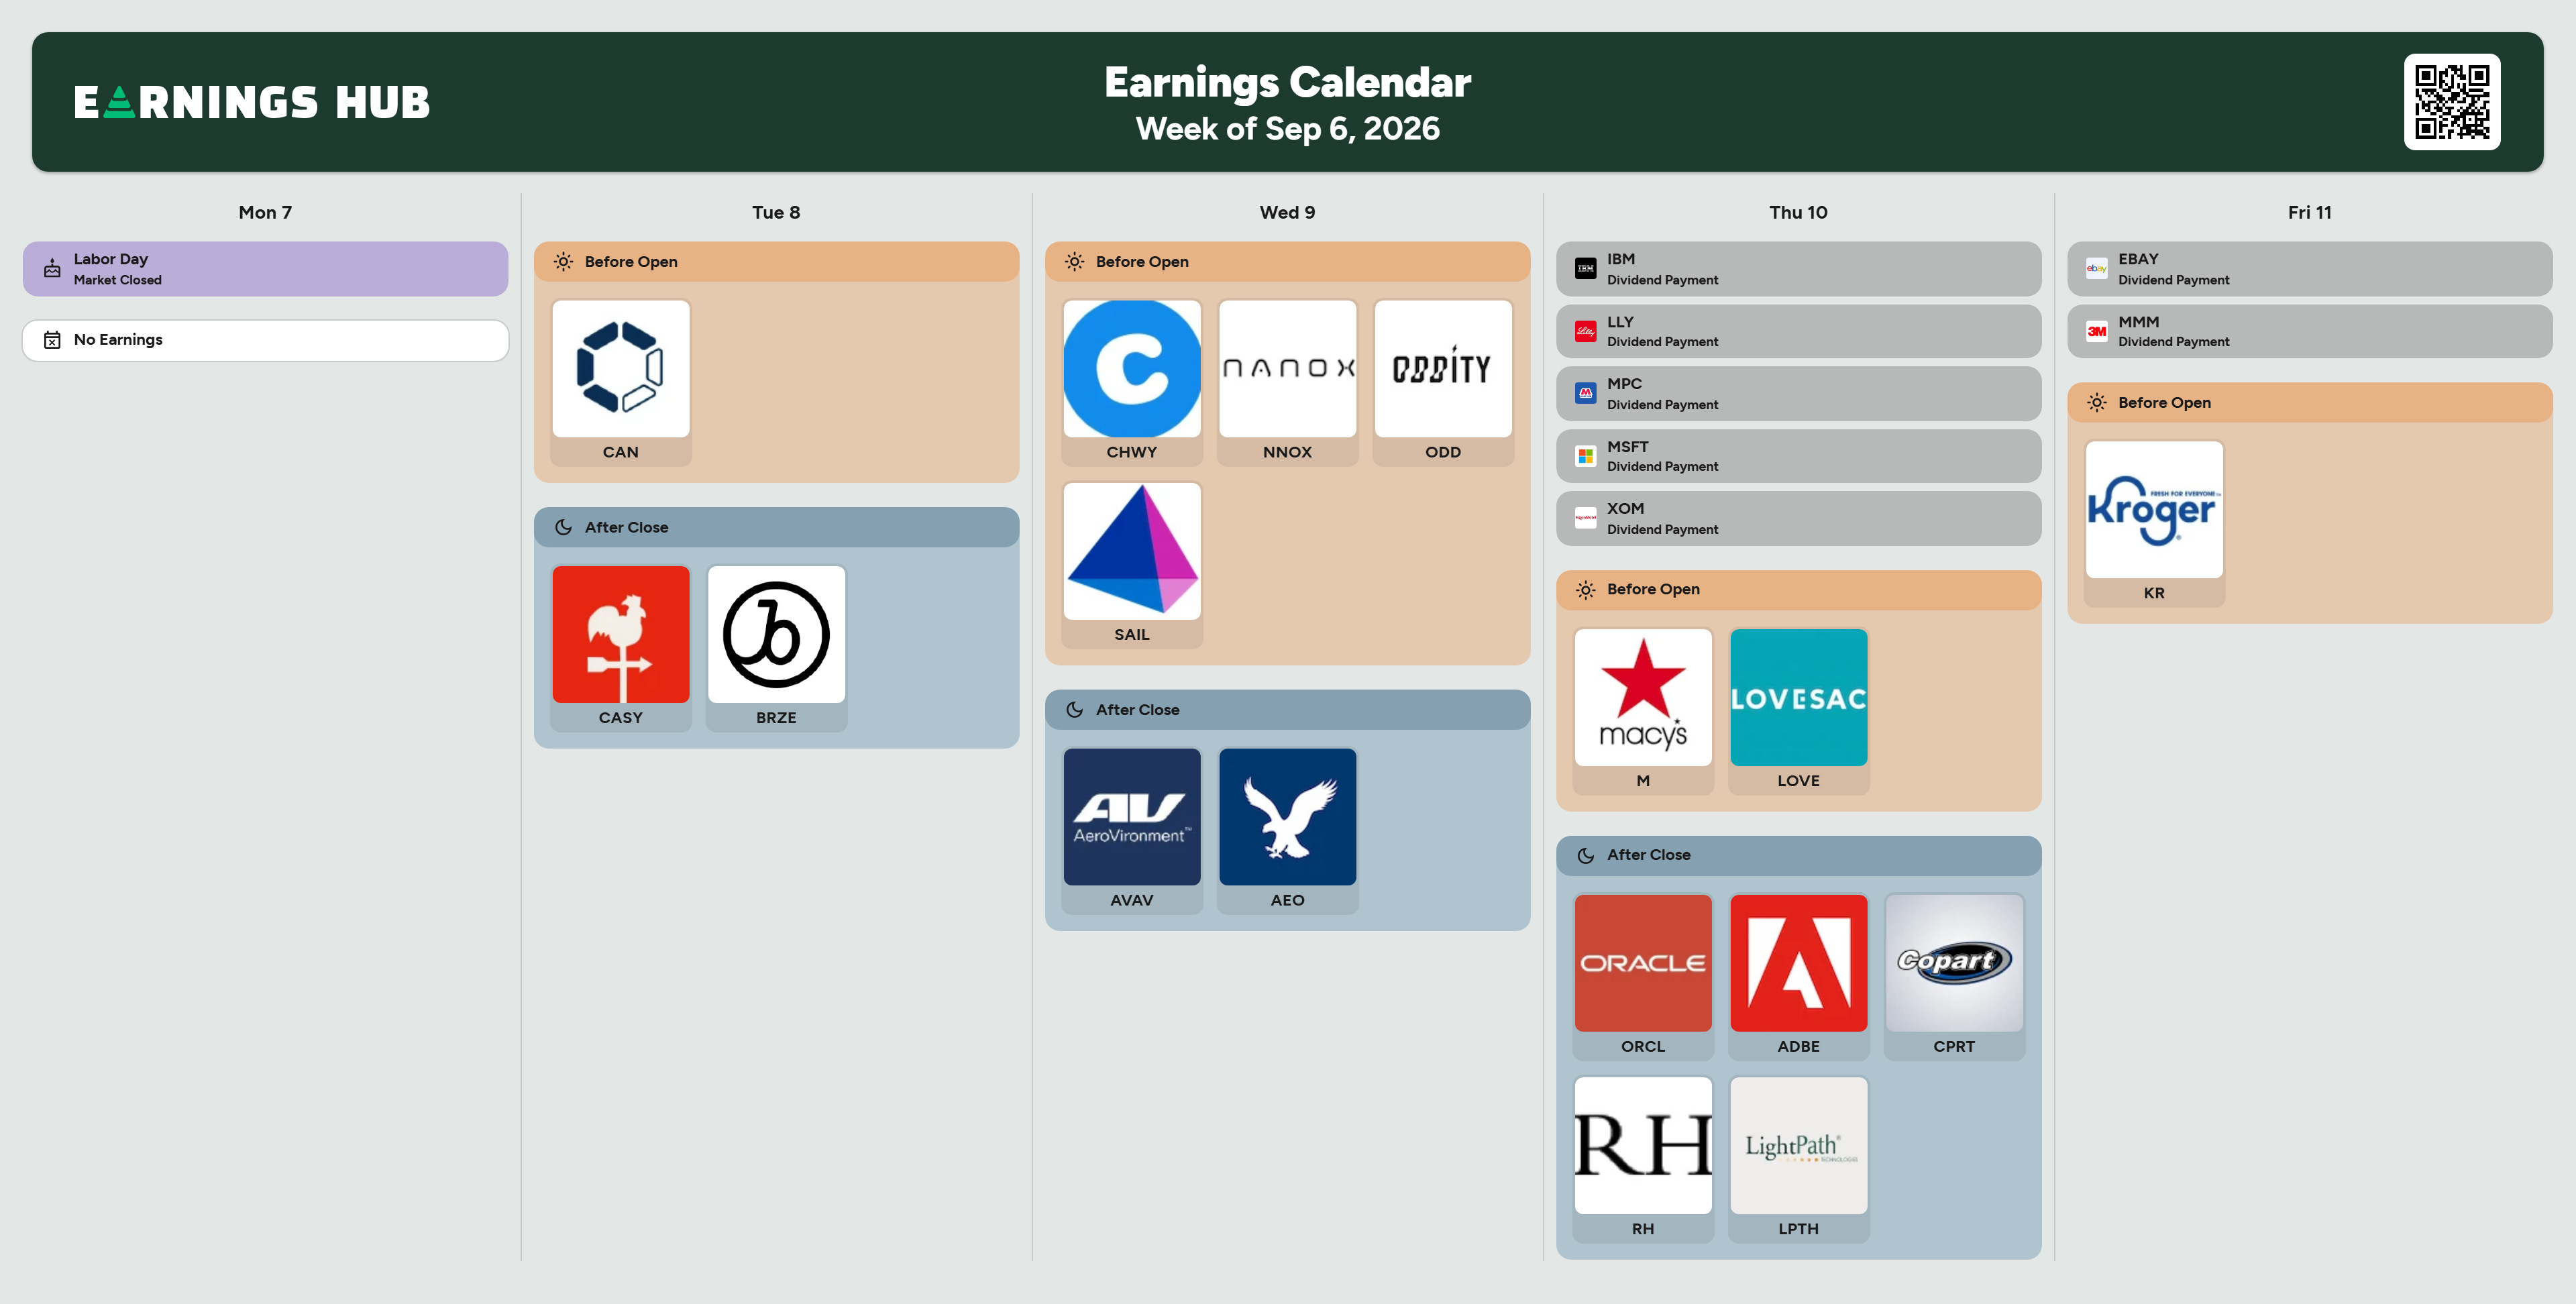
Labor Day closes the market entirely Monday, no earnings scheduled. Wednesday brings Chewy, Nano-X, Oddity, and SailPoint before the open, AeroVironment and American Eagle after the close. The week’s earnings test lands Thursday after the close, when Oracle and Adobe report within the same session, both a direct read on the AI infrastructure and cloud-spending buildout Nvidia’s earnings release reinforced this two weeks ago. Copart, RH, and LightPath round out the same evening. Kroger reports before the open Friday, the week’s only consumer-staples print.
Sector Momentum
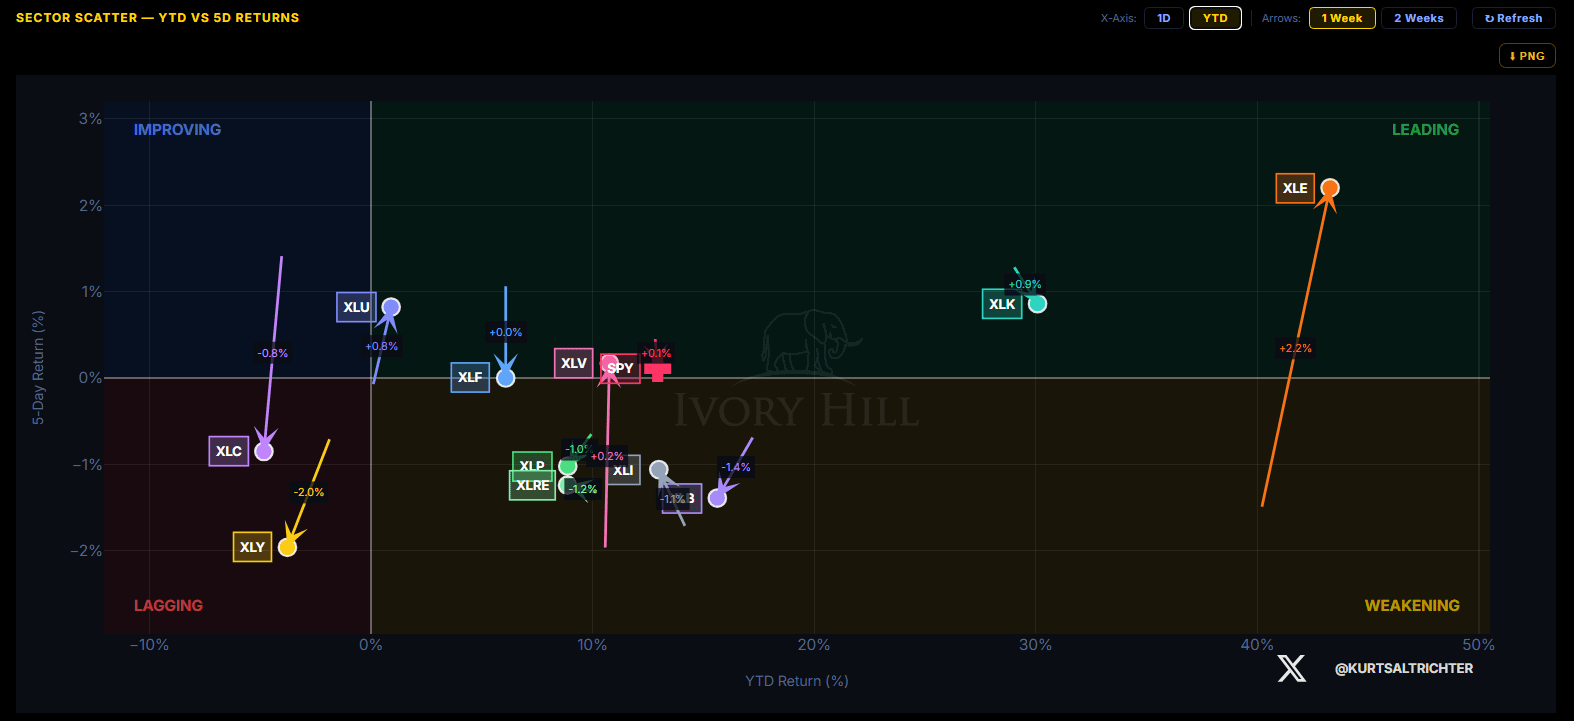
Energy leads again. XLE sits alone in the leading quadrant, up 2.2% over five days on a year-to-date return still well clear of the rest of the group. Technology is the week’s best mover among the majors, XLK up 0.9%, a reversal from last week’s decline. Consumer discretionary is the new laggard, XLY down 2.0% over five days. Real estate and industrials both faded, XLRE down 1.2% and XLI down 1.1%. Financials went flat and communication services slipped 0.8%, giving back the ground both sectors gained last week. Utilities still posted a positive five-day return at 0.8%, but that reading is down from where it stood seven days ago.
Single-Name Momentum Universe
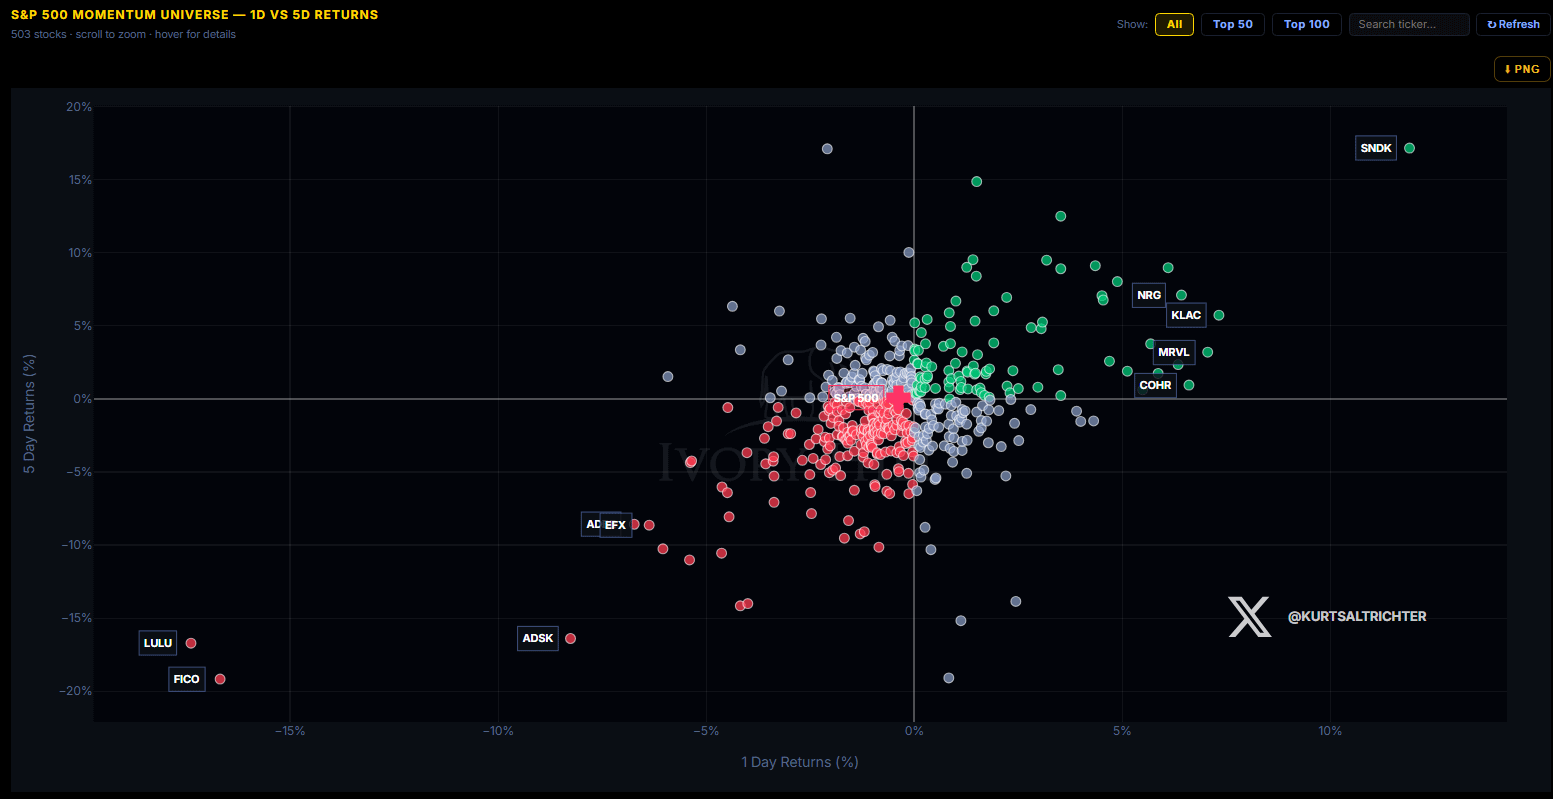
SanDisk is this week’s outlier, alone in the upper right of the 503-name universe and the largest mover on both the day and the week by a wide margin. NRG, KLA, Coherent, and Marvell cluster just behind it, all posting strong five-day gains. Marvell’s presence there is the week’s reversal: last week it was flagged as the cautionary tale of the earnings season, sitting in the laggard cluster and confirming the skepticism heading into its print. This week it sits on the opposite side of the chart entirely. Fair Isaac and Lululemon anchor the bottom, both down double digits on the day, the worst showing in the universe, with Autodesk close behind.
Market Structure: Gamma Flip
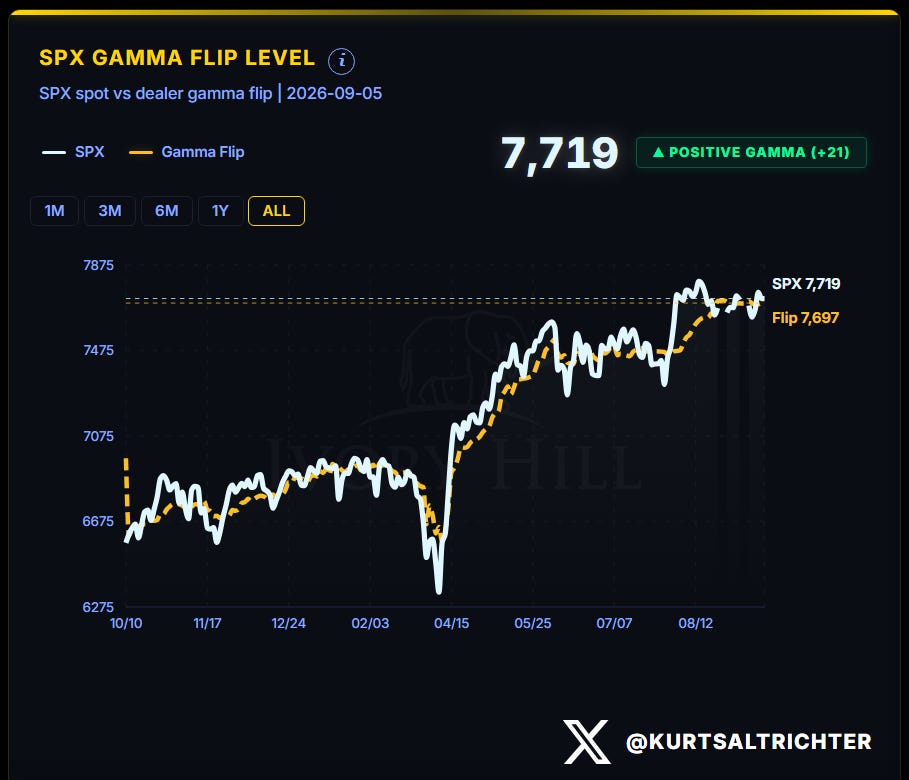
Dealers are back in positive gamma, closing the week at 7,719 against a 7,697 flip line, 21 points of cushion.
Weekly Expected Move
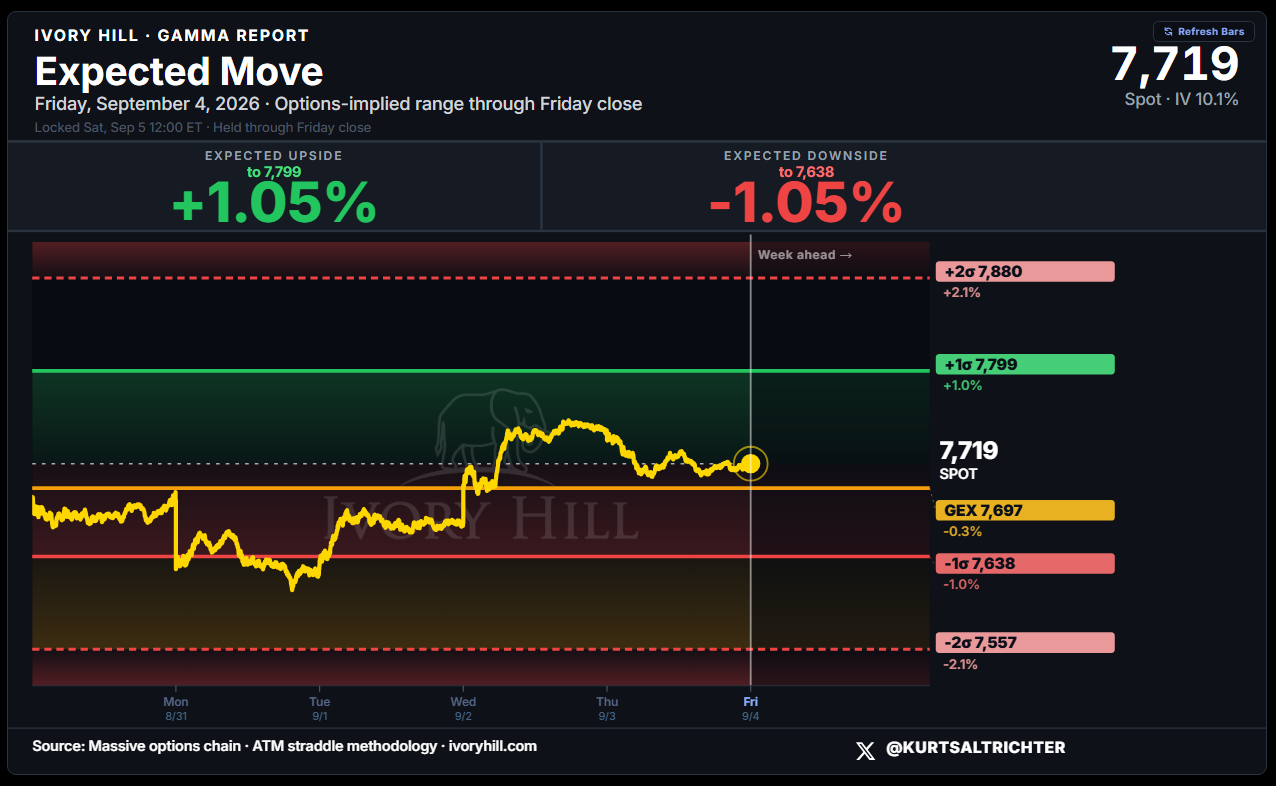
The options chain prices the week ahead at a 1.05% range in either direction, upside to 7,799 and downside to 7,638, with the two-sigma band out to 7,880 and 7,557. Implied volatility sits at 10.1%, and GEX sits at 7,697, essentially the flip level itself.
Volatility Regime
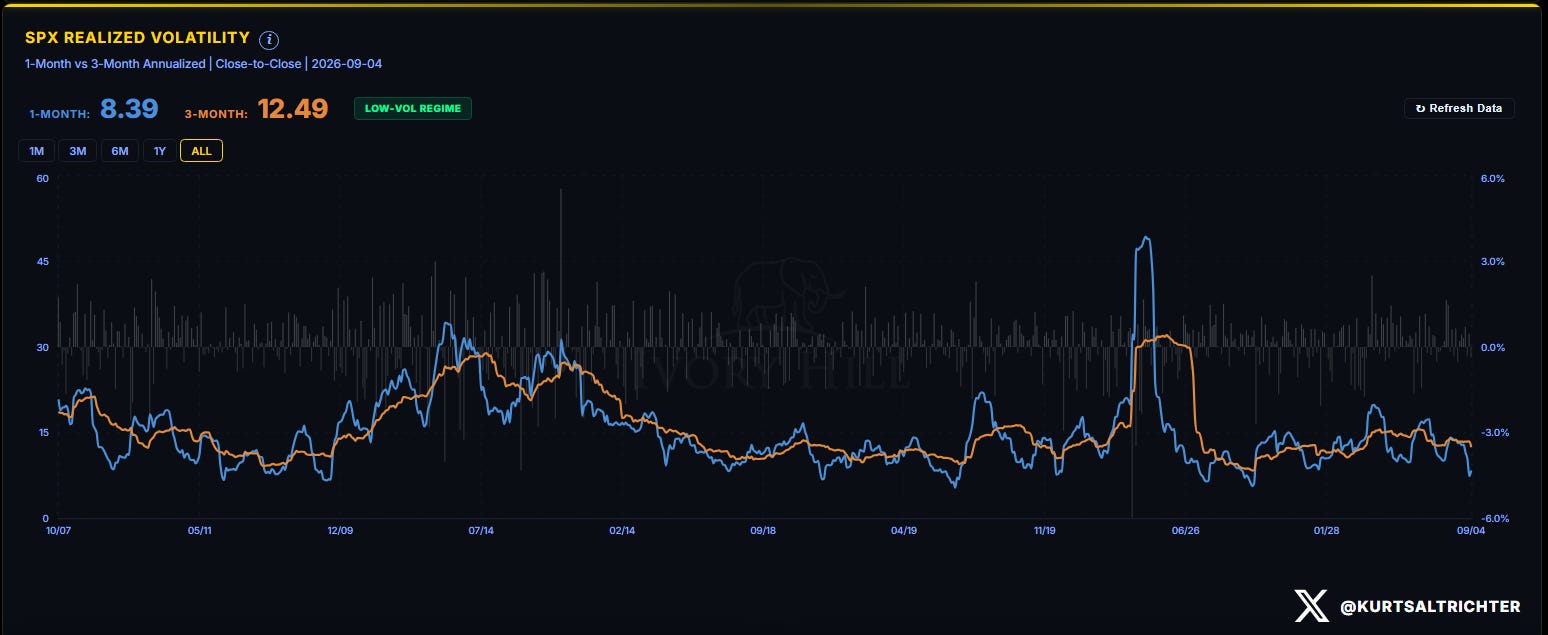
One-month realized vol fell again, to 8.39 from 10.49 last week, while three-month held closer to flat at 12.49 versus 13.46. The gap between the two readings keeps widening even after a week with two multi-day directional swings in the underlying index. Low-vol regime, confirmed for another week.
Systematic Fund Flows
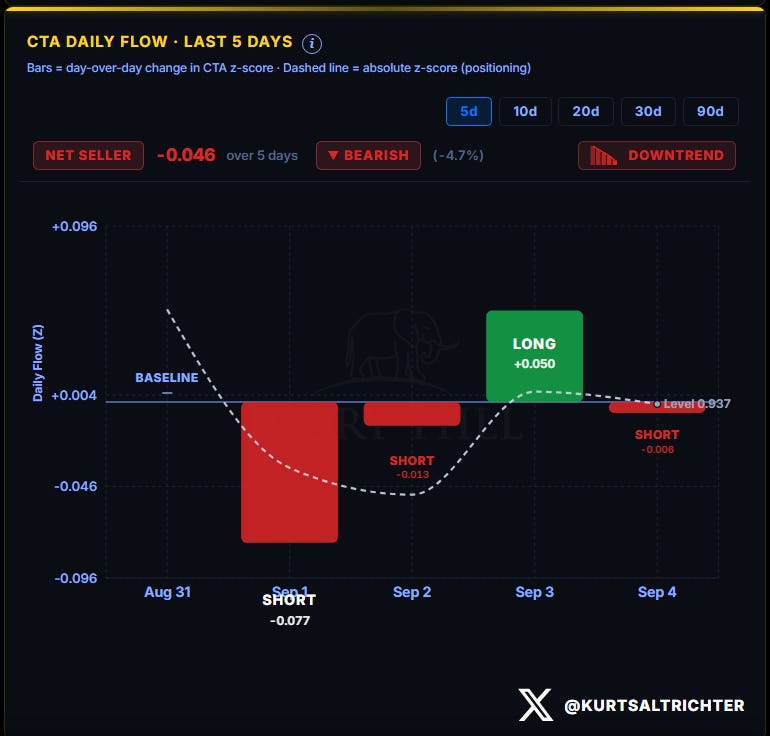
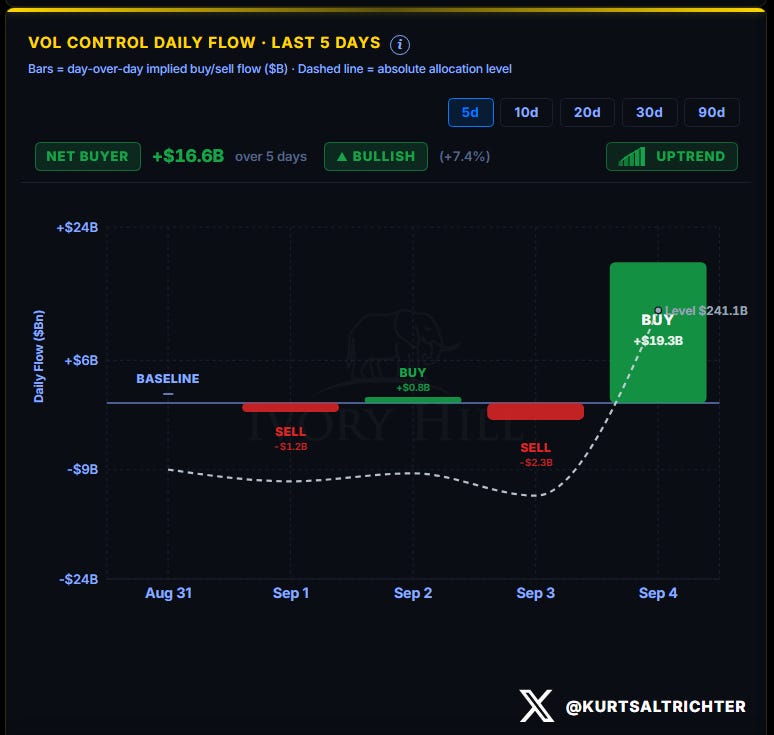
CTAs sold hard to open the week, bought back through Wednesday, then sold lightly again into Friday, a net seller for the five days even as the absolute positioning level stayed pinned near the extreme-long territory. Vol-control did almost nothing for four straight sessions, then bought $19.3 billion in a single print Friday, enough to swing the five-day total to a $16.6 billion net buy and tag the trend bullish.
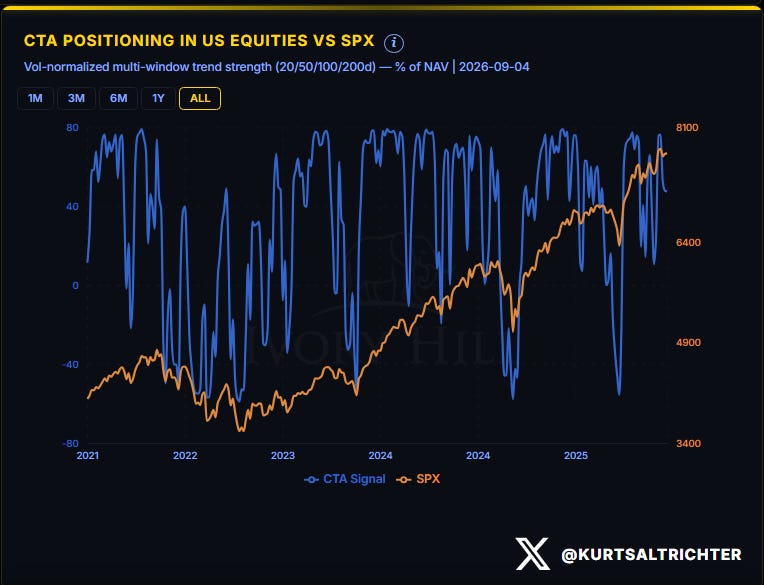
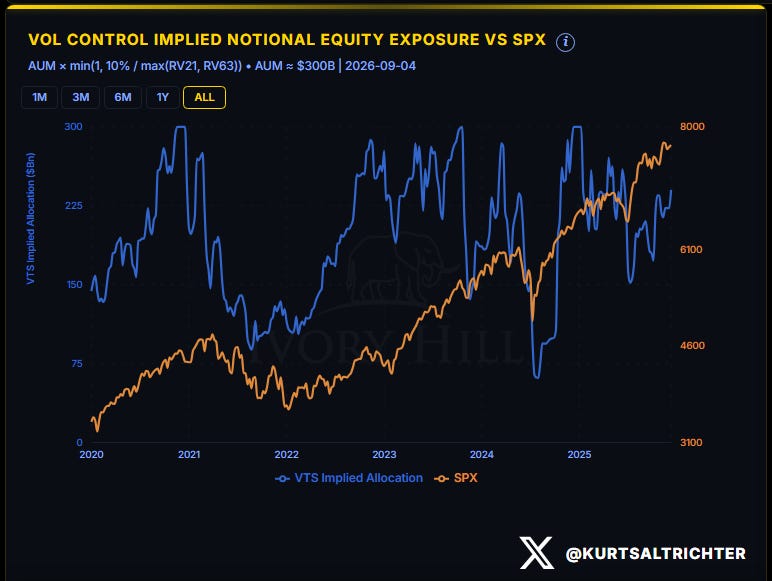
Both engines are running near the top of their multi-year ranges in absolute terms, tracking an index sitting near its own highs. The two landed in the same place they started the week, long, but they took very different roads to get there.
Positioning Index: Systematic Z-Score
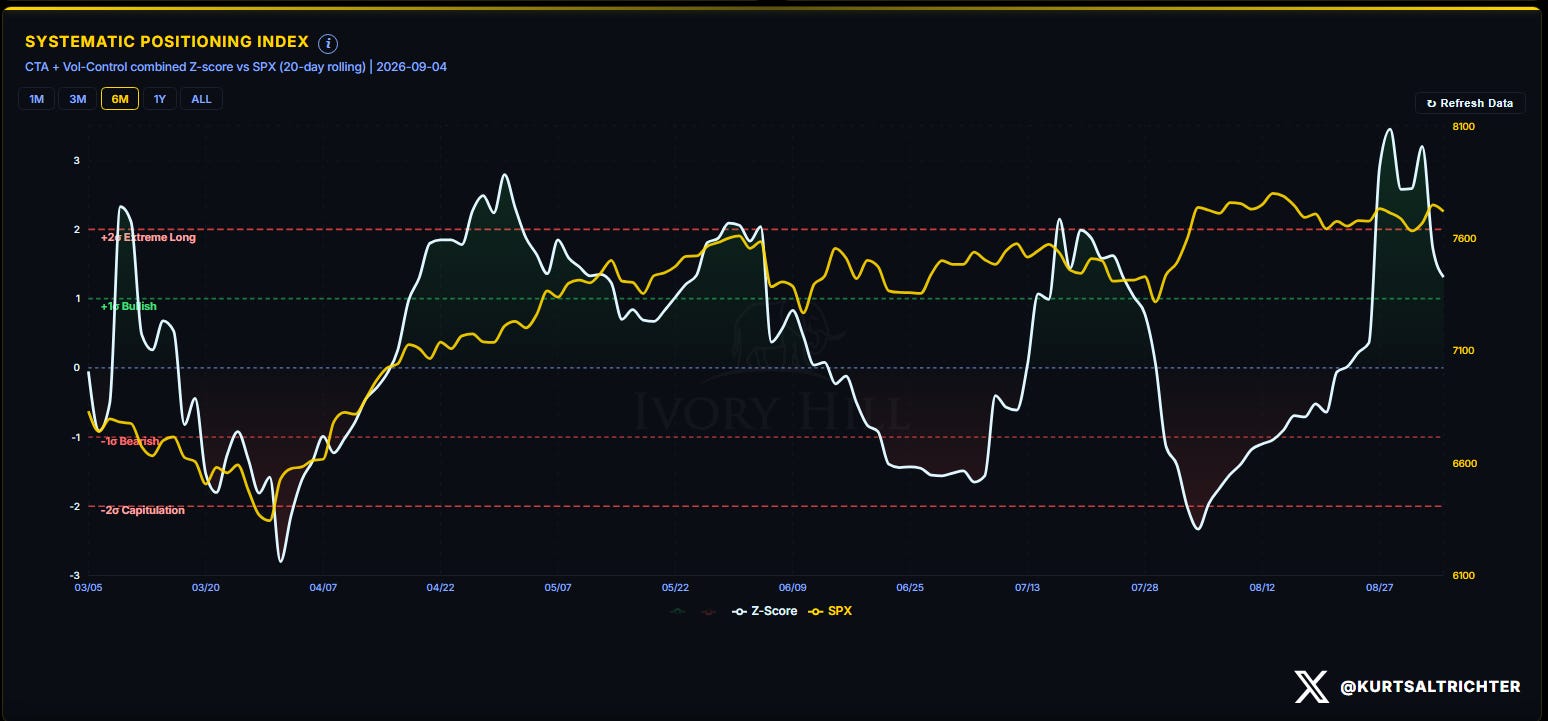
The combined CTA and vol-control z-score is still above the plus-1 line it broke through last week, the highest sustained reading in the six-month window even after a week that saw CTAs turn net sellers. That is the tension in this market: the flow data says selling, the positioning level says stretched-long, and both are true at once because the level was built over months and the flow measures five days. Extreme-long positioning typically means less room to add on strength and more room for an air pocket on disappointing news, exactly the setup heading into Friday’s jobs data, and exactly what a mild 0.38% pullback did not confirm.
Market Breadth
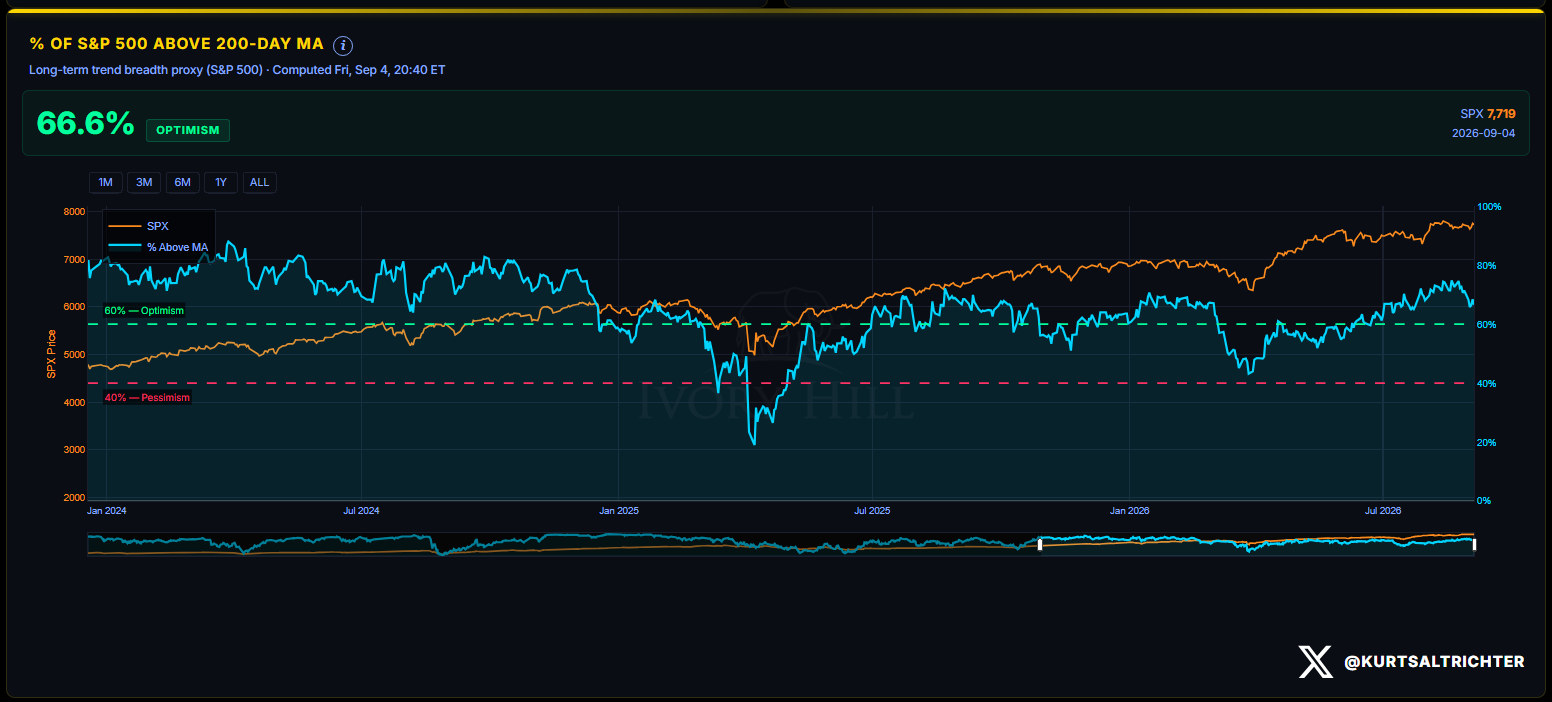
Breadth fell sharply, to 66.6% of the S&P 500 above its 200-day moving average from 71.7% last week, a single-week drop nearly double the size of the two prior weeks’ declines combined. Still solidly inside the optimism zone above 60%, but fewer stocks are carrying the index even as the spot level sits within a percent of its own all-time highs.
Dealer Gamma Dashboard and Composite Regime
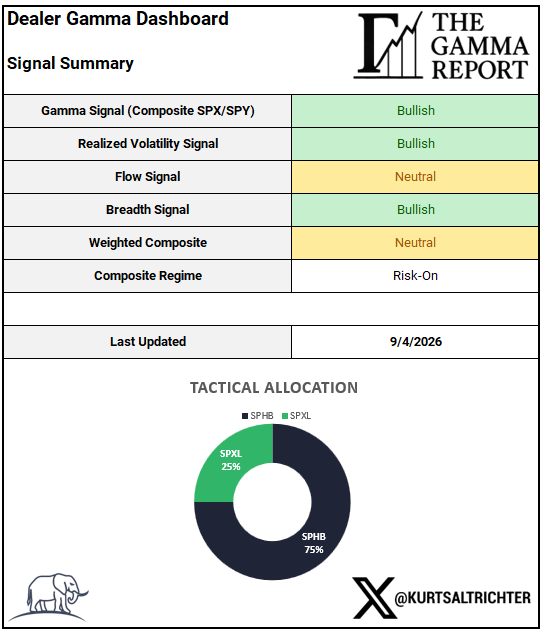
Gamma, realized volatility, and breadth all read bullish. Flow reads neutral given the CTA reversal, and the weighted composite stays neutral, the same output as last week even after a mid-week round trip in every underlying signal. Composite regime holds Risk-On, and the allocation is unchanged: 75% SPHB and 25% SPXL, identical to last week’s close, even though the live signal spent Monday and Tuesday defensive at 50% SPLV and 50% SPHB before flipping back.
Tactical Allocation Performance
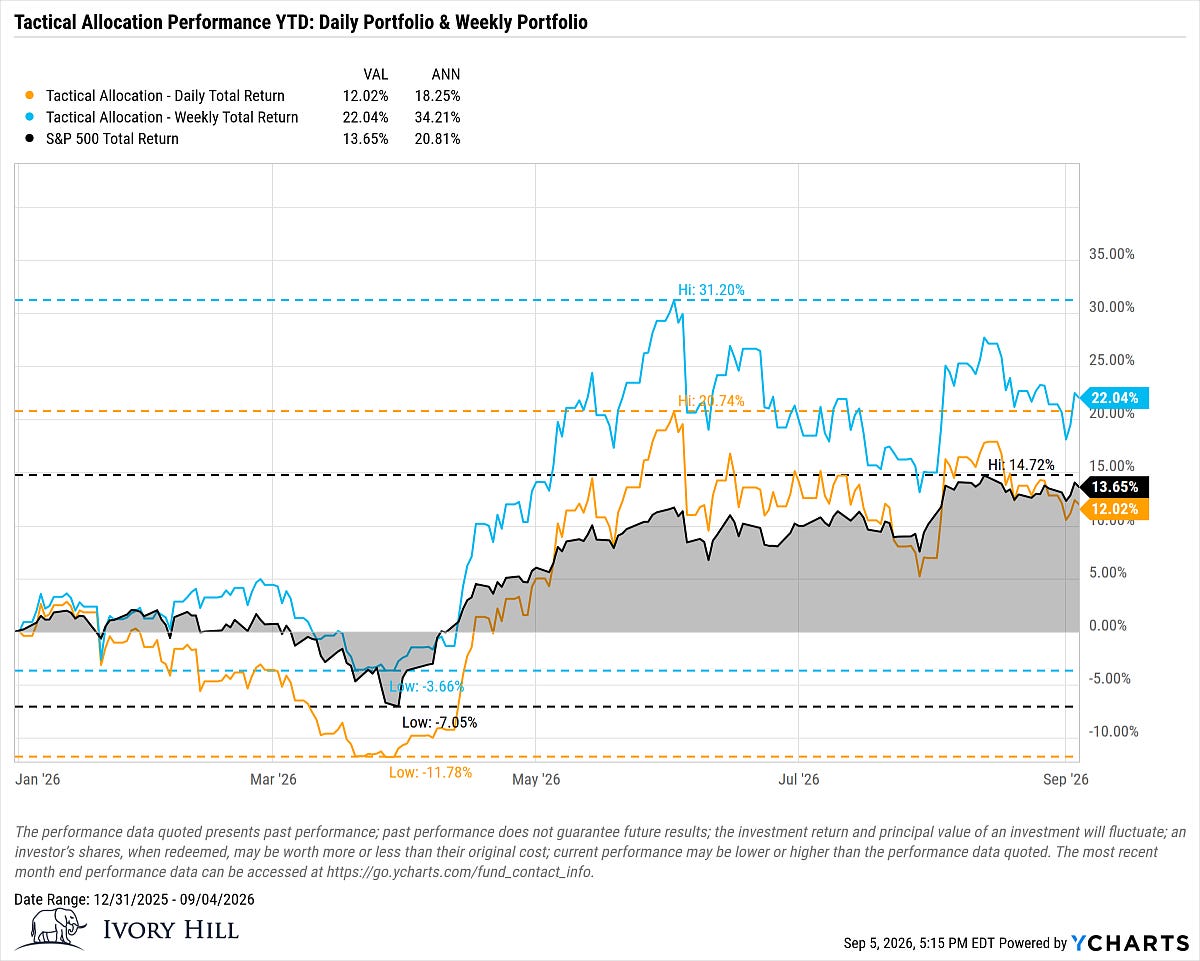
The weekly sleeve recovered, up to 22.04% year-to-date from 21.41% last week, while the S&P 500 total return rose to 13.65% from 13.51%. That widens the weekly sleeve’s lead back out to 8.39 points from 7.90 the week before.
And remember: the one fact pertaining to all conditions is that they will change.
Feel free to use me as a sounding board.
Follow me on X for more updates.
Best regards,
Schedule a call with me by clicking HERE
Kurt S. Altrichter, CRPS®
Wealth Advisor | President
Disclosure
The Gamma Report is published by Ivory Hill, LLC. All opinions and views expressed in this report reflect our analysis as of the date of publication and are subject to change without notice. The information contained herein is for informational and educational purposes only and should not be considered specific investment advice or a recommendation to buy or sell any security.
The data, models, and tactical allocations discussed in this report are designed to illustrate market structure and positioning trends and may differ from portfolio decisions made by Ivory Hill, LLC or its affiliates. Investing involves risk, including the possible loss of principal. Past performance is not indicative of future results.
Ivory Hill, LLC, and its members, officers, directors, and employees expressly disclaim any and all liability for actions taken based on the information contained in this report.