
Iran Is One Problem. This Market Has Three.
Oil started it. The Fed can't finish it. And two other headwinds that have nothing to do with Iran

The Ivory Hill RiskSIGNAL remains red (sell), and we are still sitting 40-51% short-term T-bills and will likely sell more equities this week if conditions continue to deteriorate.
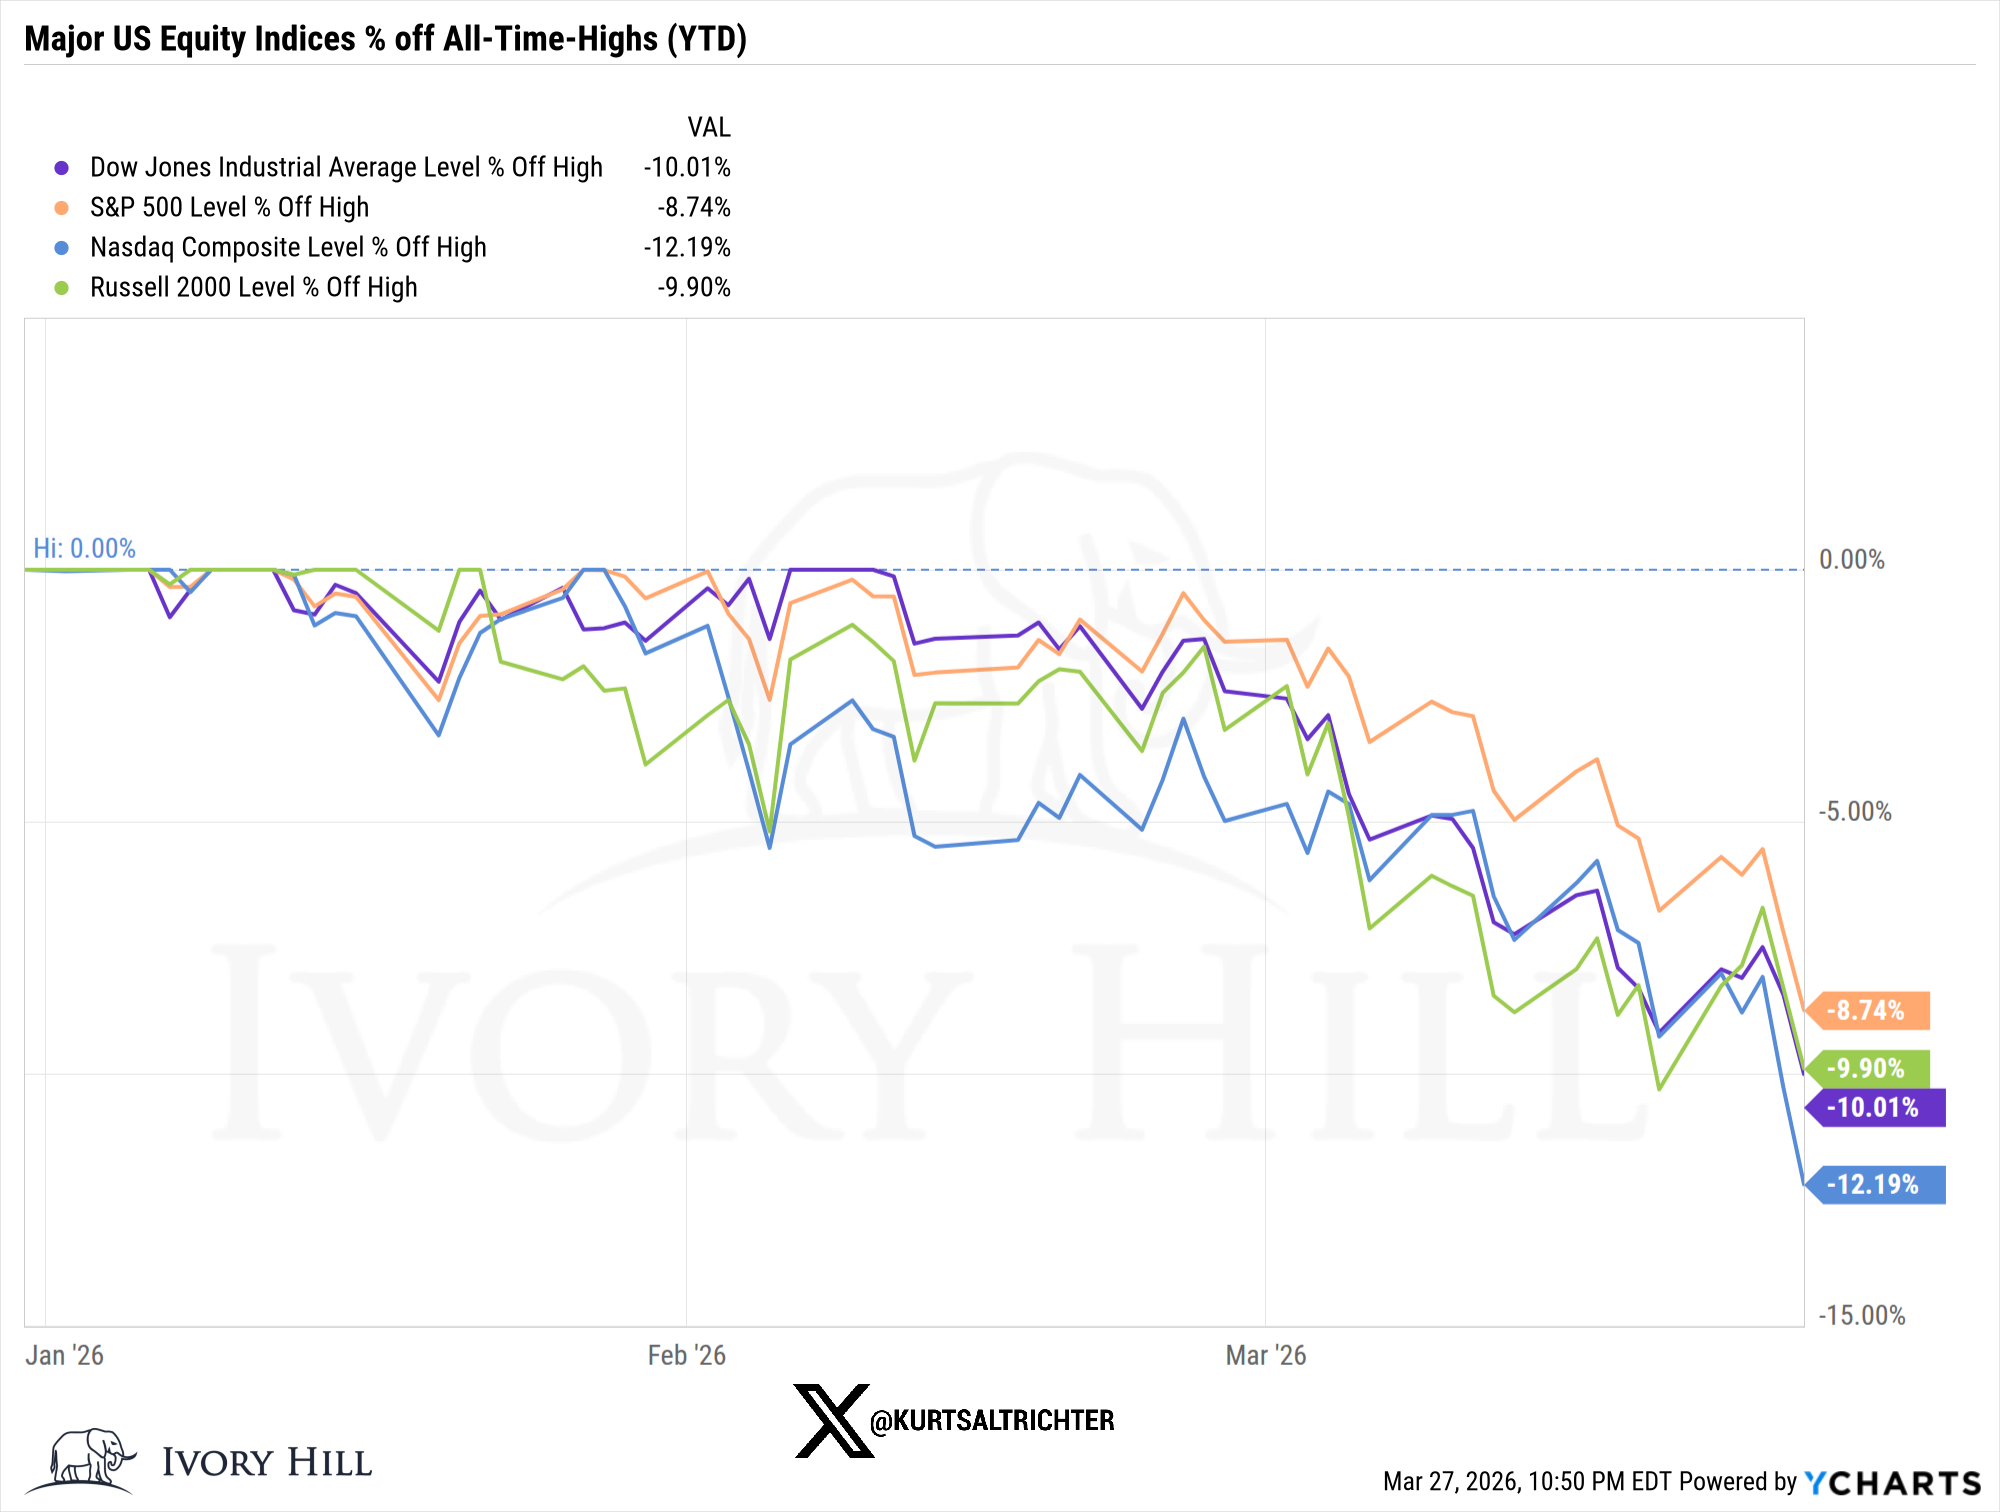
Every major US equity index is now in correction territory.
Nasdaq is down 12.19% from its all-time high. Dow down 10.01%. Russell 2000 off 9.90%. The S&P 500 “holding up” at -8.74% is not a flex; it’s just last in line.
Let’s start with oil, because everything else flows from it.
WTI was in a multi-year downtrend heading into 2026, bottoming near $55 a barrel. Declining oil was a gift to the Fed, to inflation, to the consumer. If oil goes down, so does everything else. When oil goes up, so does everything else.
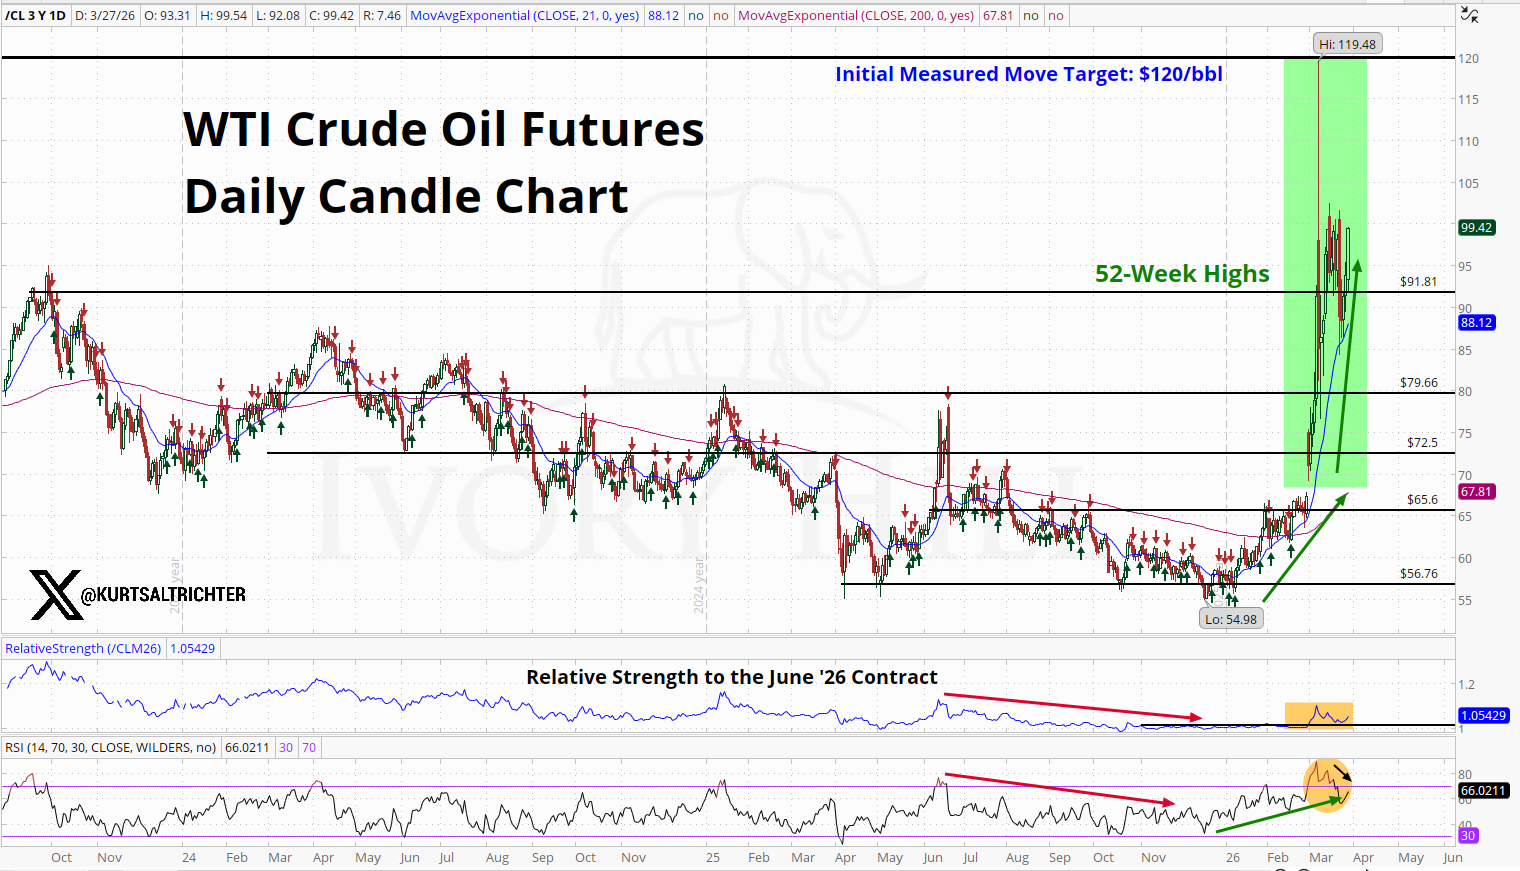
WTI is pressing $100, with a measured-move target of $120, driven entirely by a war-related supply disruption that has lasted longer than anyone expected. The front-month contract is trading at a premium to deferred contracts, that is, backwardation, and backwardation tells you the physical market is very tight right now. This is now a real supply problem.
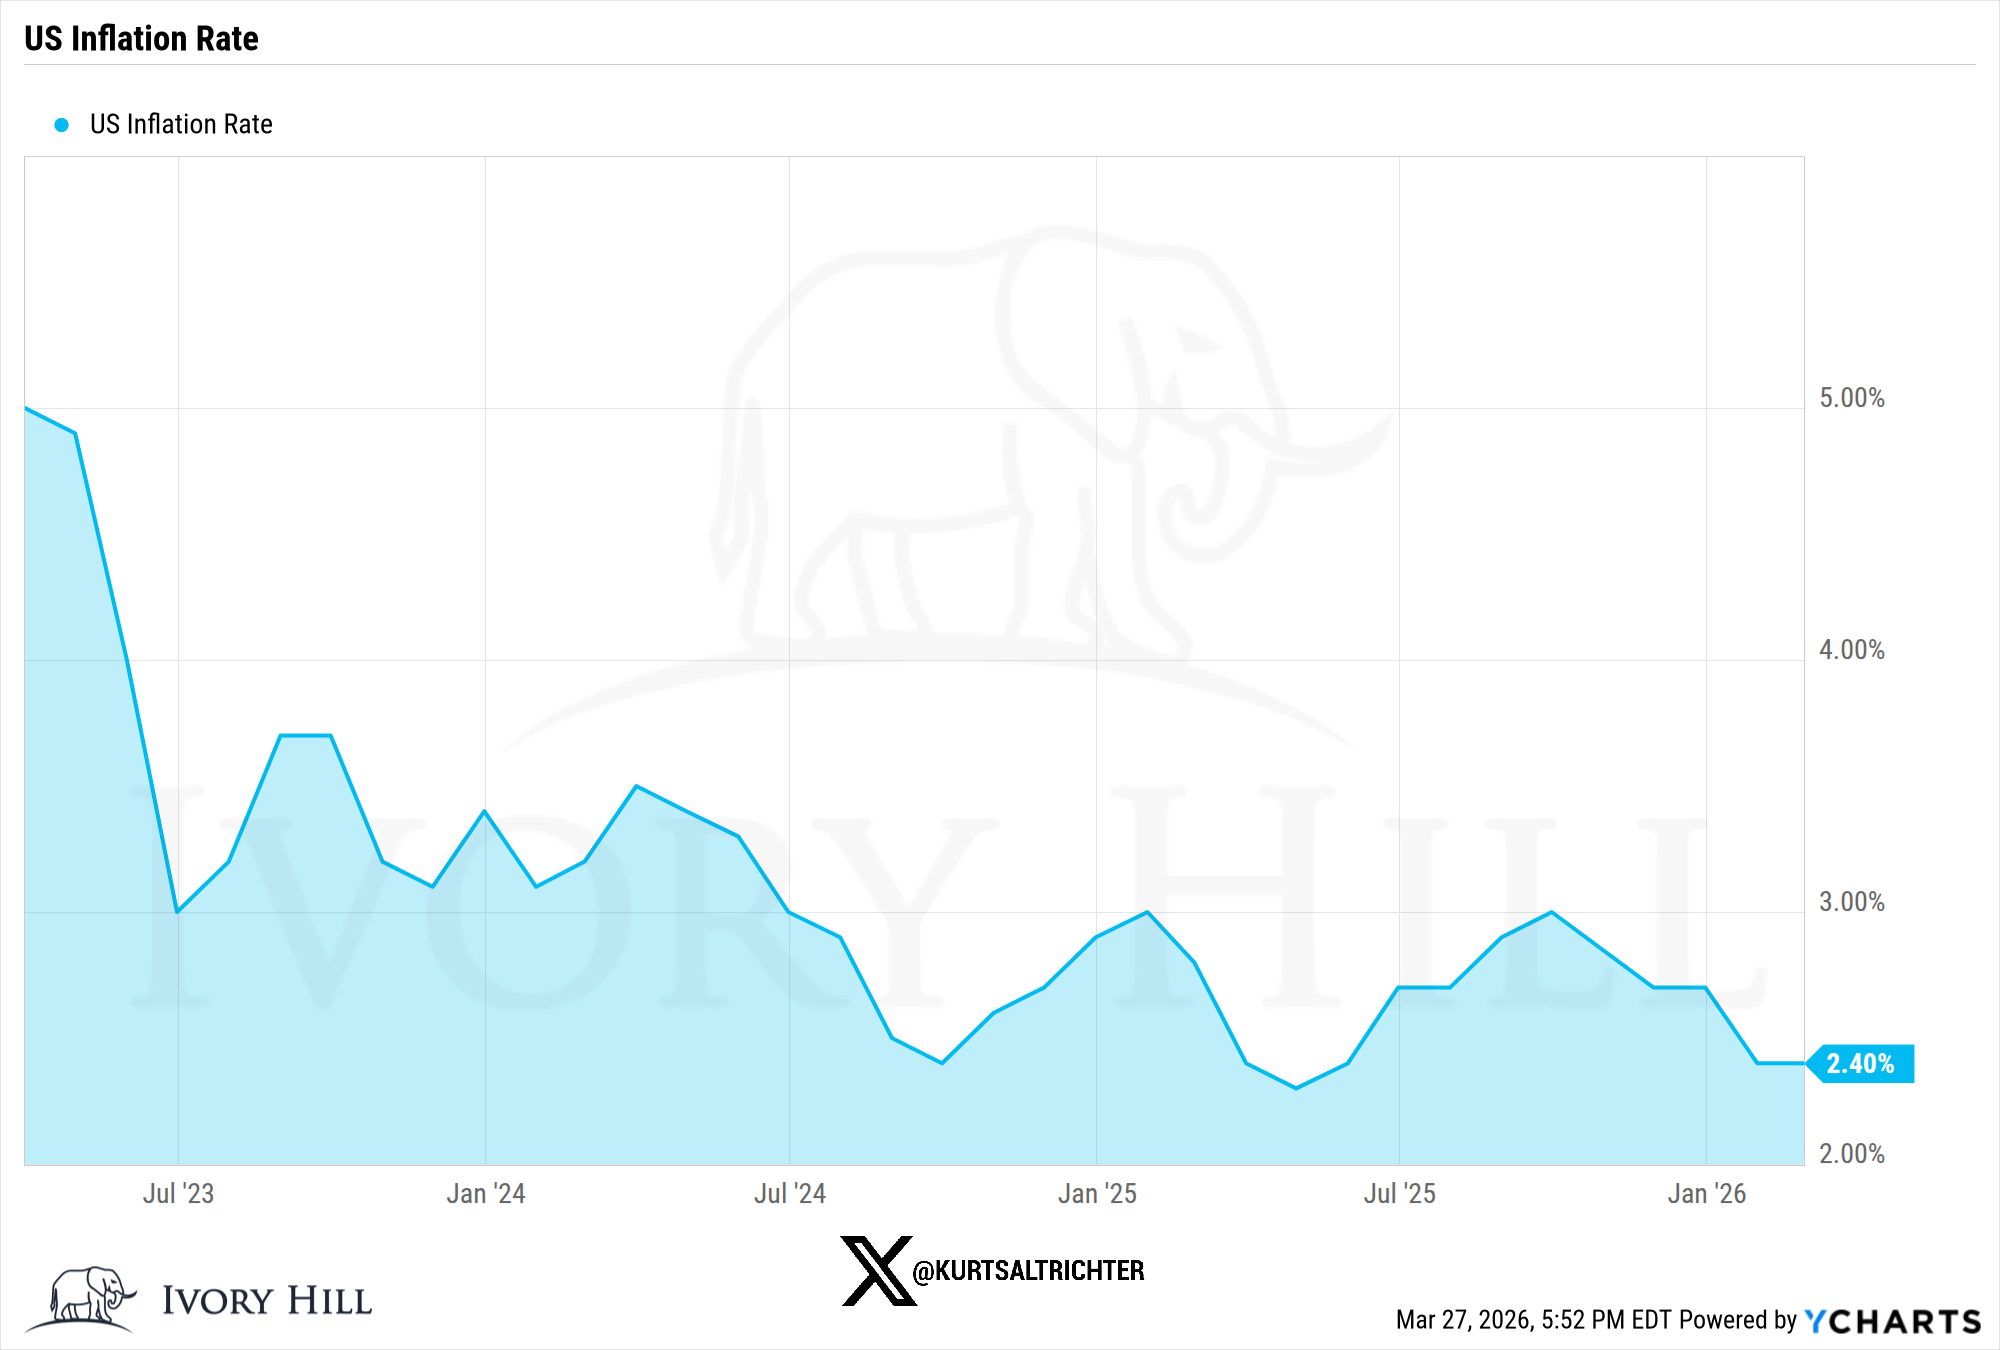
The Fed entered 2026 with a very manageable task. Hold rates just above neutral, let core inflation drift back to 2%, don’t break anything. Most policymakers were describing the current rate as “mildly” or “moderately” restrictive. That framing made sense before Crude started ripping everyone’s face off. It is not defensible with oil approaching $100 and the 5-Year Breakeven Inflation Rate matching a three-year high. The 400+ Ph.D. economists at the Fed will tell you inflation expectations remain well-anchored, and technically, they are not wrong. The Fed doesn’t look forward; it only looks backward.
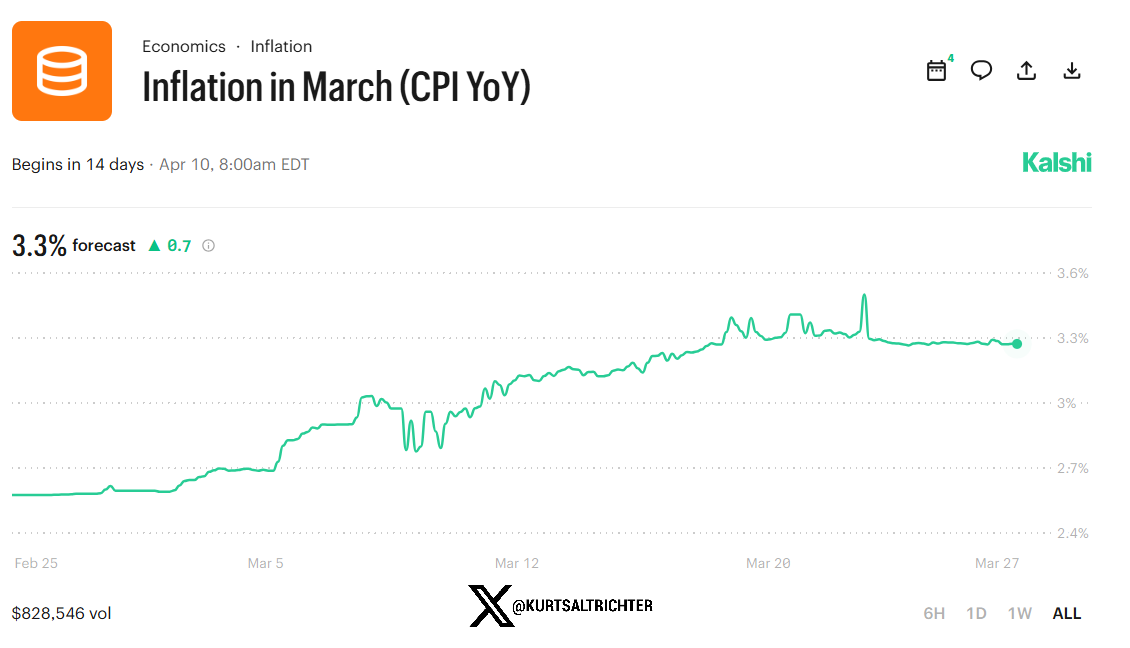
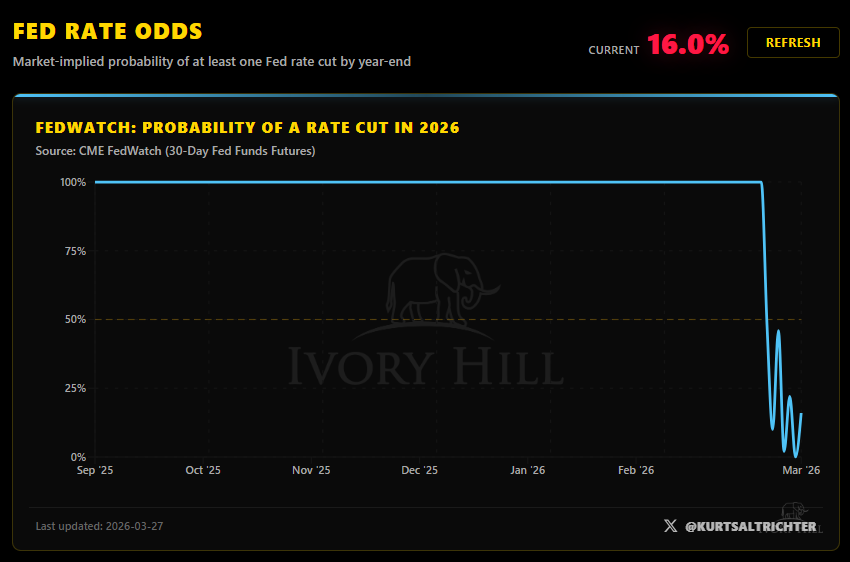
I fully expect the April 10th CPI print to come in north of 3%. The betting markets agree with me.
The best-case scenario for the Fed requires three things simultaneously: oil corrects hard and fast, the labor market holds despite mixed data since December, and there is no second inflation wave reminiscent of the 1970s. Every week crude stays elevated, that scenario gets less likely. If one or more of those conditions break down, the Fed is forced to raise rates, because the ghost of Arthur Burns still haunts that building. Nobody there is cutting prematurely before inflation is contained.
And remember, this is the same Fed that waited until inflation was printing at 7% to raise rates. After the government panic-printed $10-12 trillion dollars. The Fed will always be late. It has always been late. That is not an opinion, it is an institutional track record.
The 2-year Treasury is back to testing 4% this week. The bond market isn’t pricing cuts anymore. It’s pricing higher for longer, with a tail risk of hikes most people are still too reluctant to say out loud.
The equity market is reflecting all of that in real time. The S&P 500 futures hourly chart is not subtle about it. Price has been grinding lower, and every rally attempt has been rejected at the upper boundary, the 21-period EMA sloping straight down and functioning as a reliable ceiling on bounces. The RSI is at 31 and in its own downtrend.
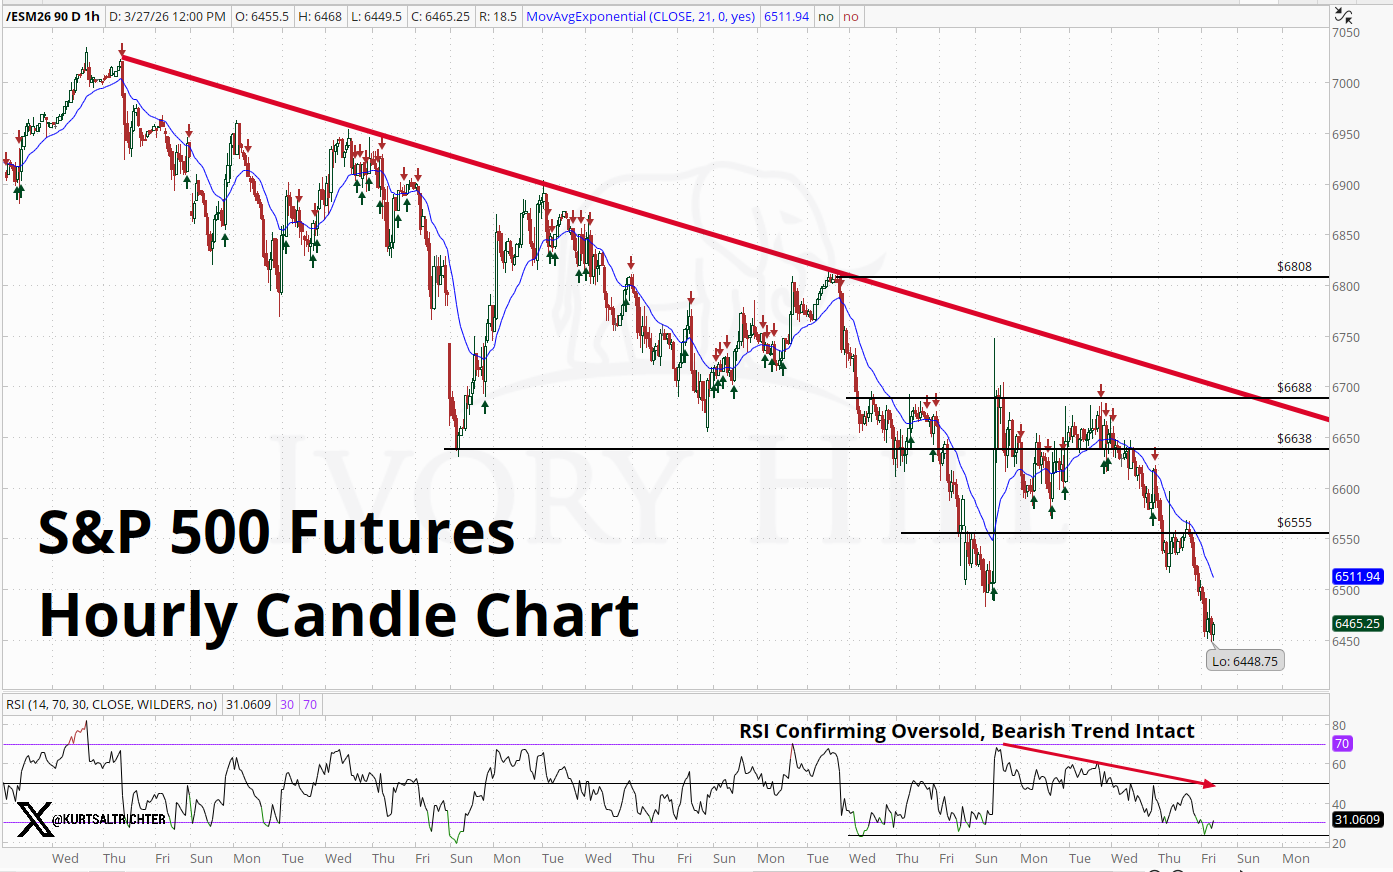
Oversold does not mean bottom. It means the selling has been persistent, and buyers have not shown up. Resistance is stacked above at $6,555, $6,638, $6,688, and $6,808. None of those levels has been reclaimed with any conviction. Until one is reclaimed, this is a downtrend and should be treated as one.
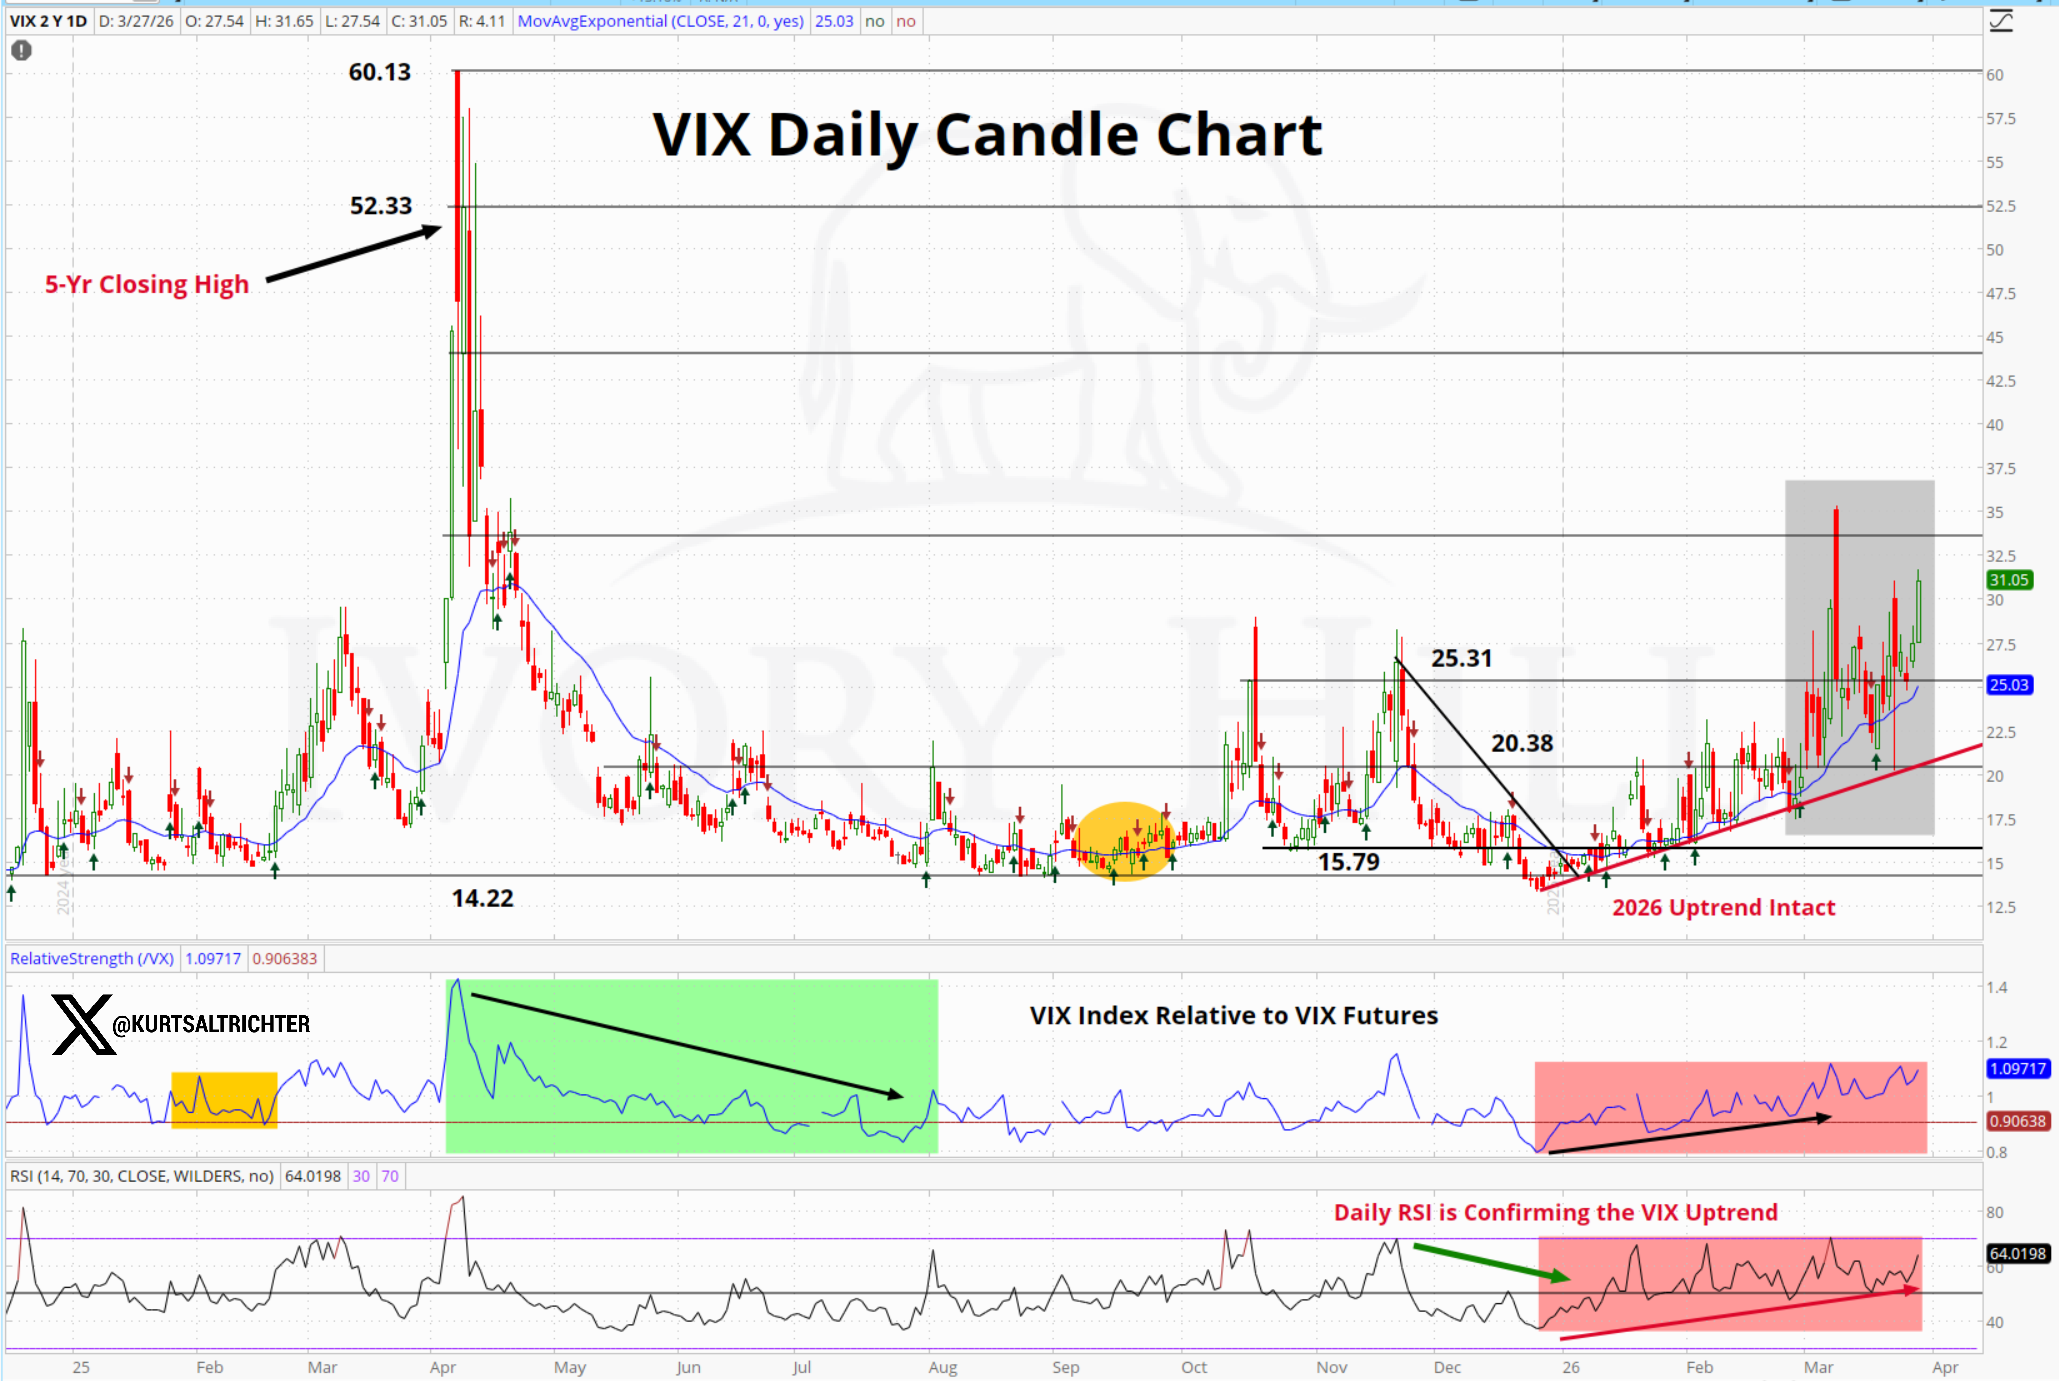
The VIX at 31 is firmly in the chop. The spike to 52 last April was a genuine crisis. This is something different, a sustained volatility regime with an intact 2026 uptrend, higher lows on each pullback, and an RSI at 64 that still has room to run before reaching an exhaustion point.
The VIX is saying this market has not found its footing, and the people pricing volatility are not in a hurry to sell it down.
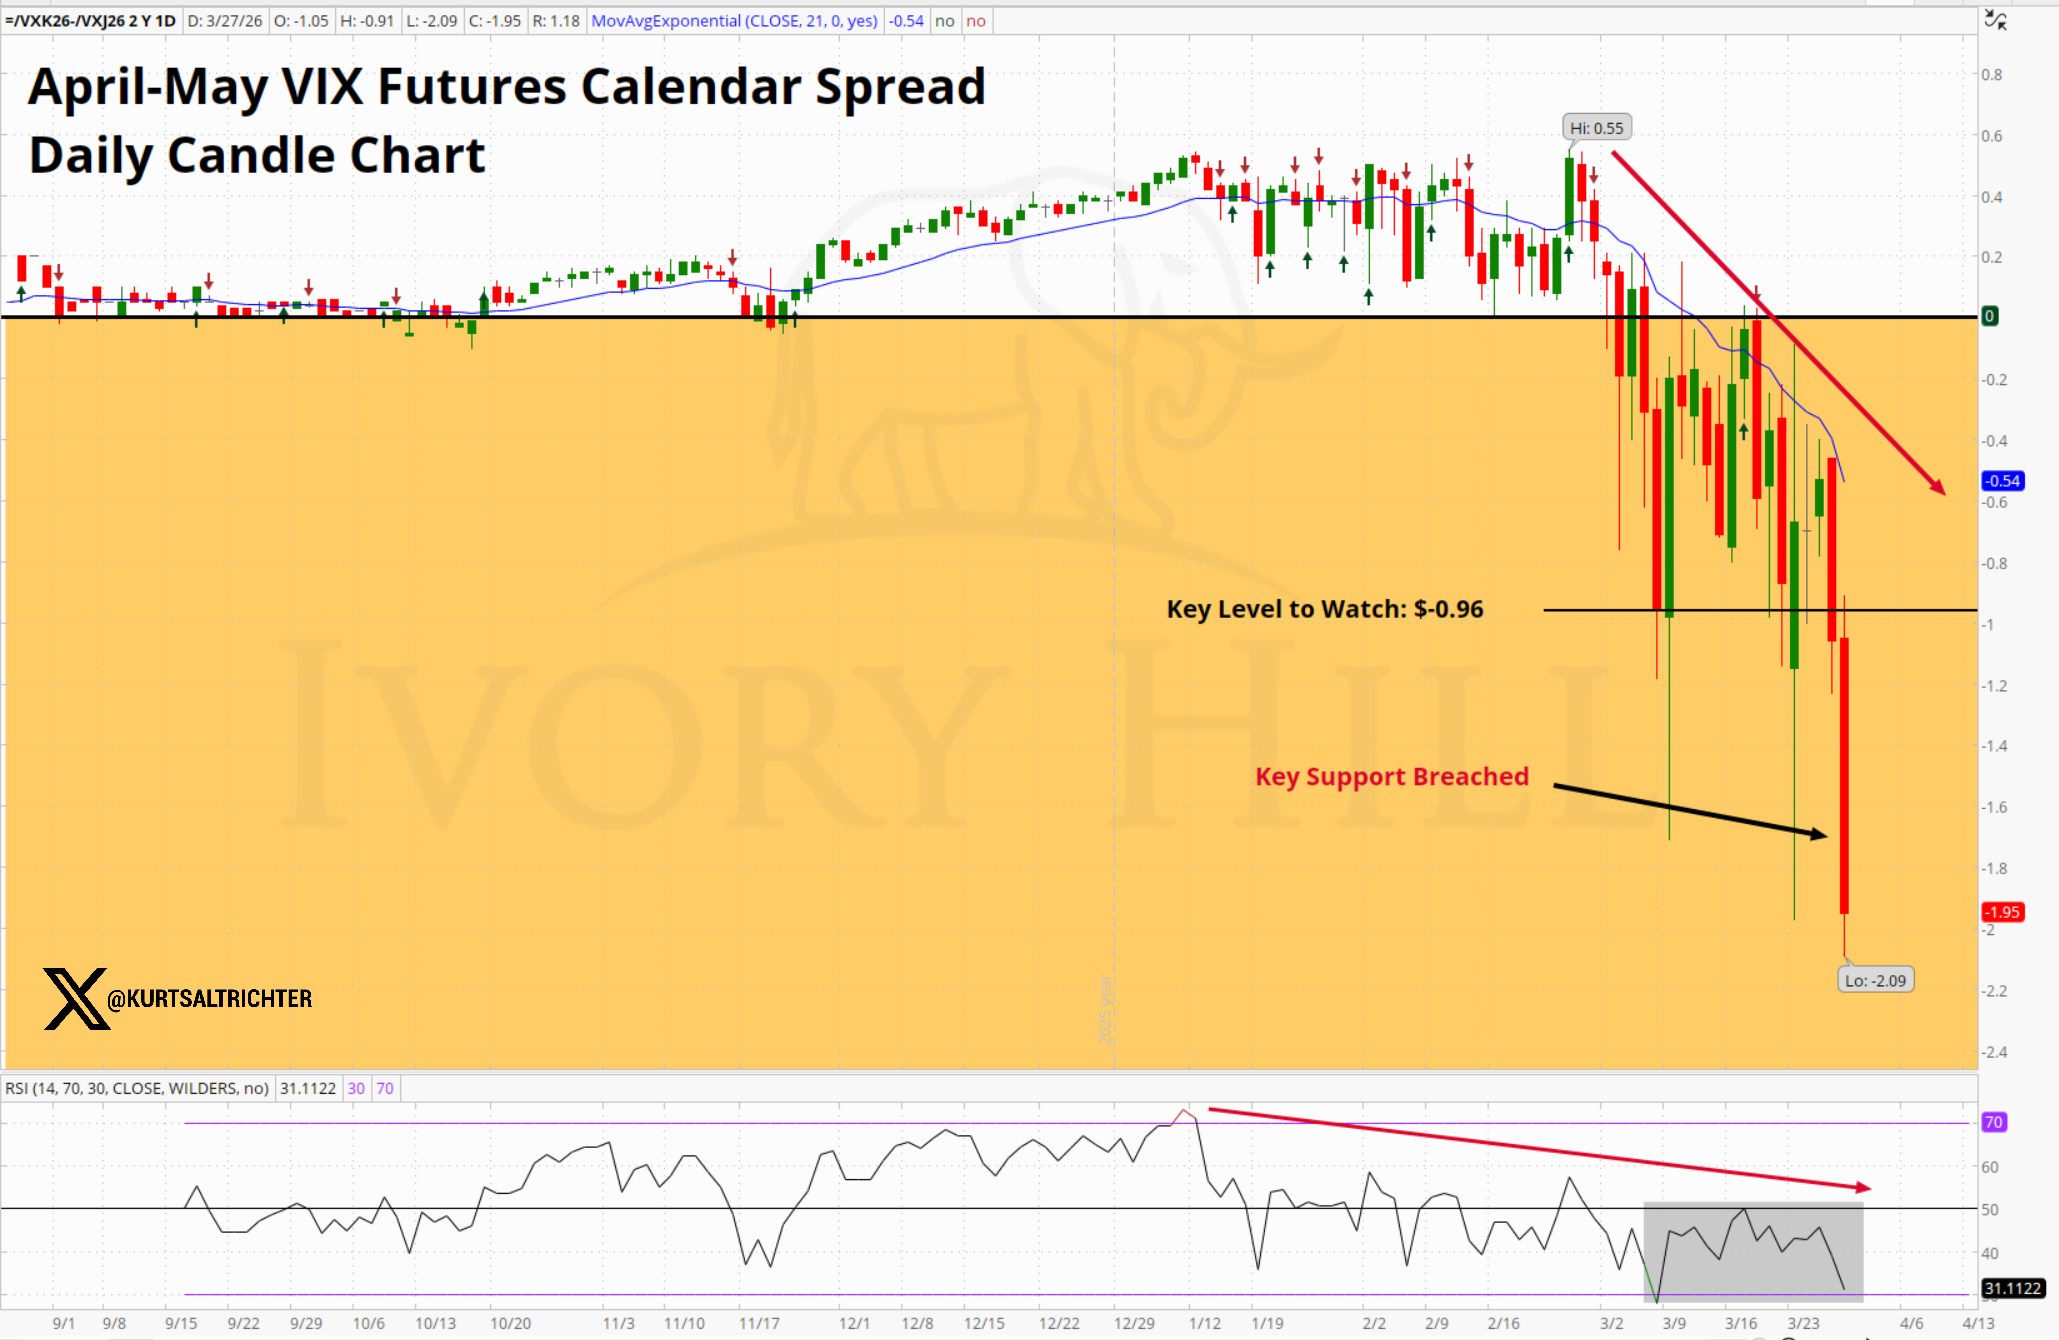
The April-May VIX calendar spread makes that point more forcefully. It has collapsed from +0.55 to -1.95, with a key support level already broken. Options traders are paying significantly more to hedge May risk than April risk. They are not pricing a near-term resolution for Iran. Watch for a reclaim of -0.96 as the first sign that term structure is starting to normalize. Until then, the institutional hedgers are still worried, and that is the group worth listening to right now.
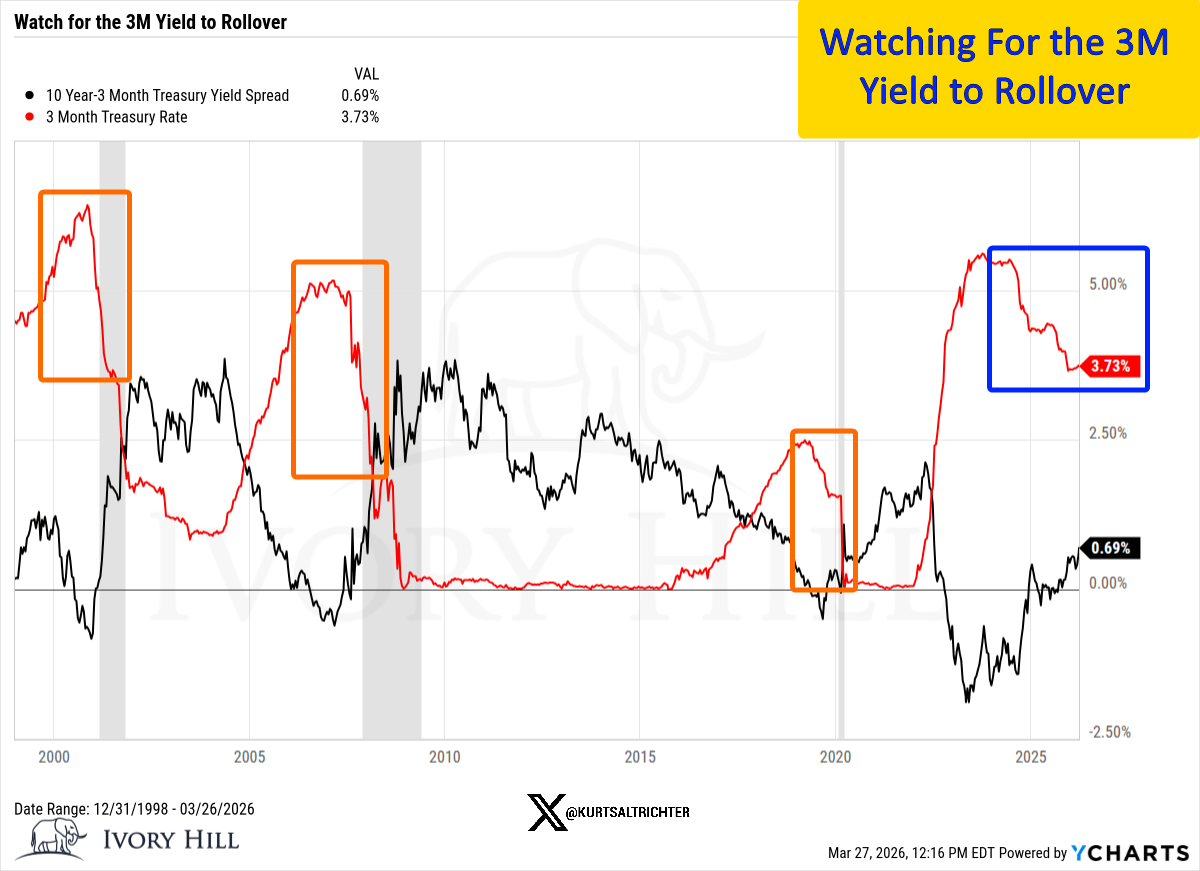
One more chart that is not getting enough attention. The 3-month Treasury yield sits at 3.73%, declining from its 2023-2024 peak above 5%. That is a cyclical peak in the 3-month yield followed by a rollover, which has preceded every major recession on this chart going back to 2001. The signal is not a sell signal in isolation, and the 10-year spread is still positive at 0.69%. But in an environment where consumer spending is already showing cracks and the labor market data has been mixed for months, the direction of travel deserves our respect. This is not a “recession is here” signal. It is a “pay attention” signal.
The Market Had Problems Before Iran. It Still Does.
Now, here is what the Iran war coverage has drowned out. There were two other distinct headwinds building in this market before the conflict began, and neither one has improved while everyone has been watching crude and ceasefire negotiations.
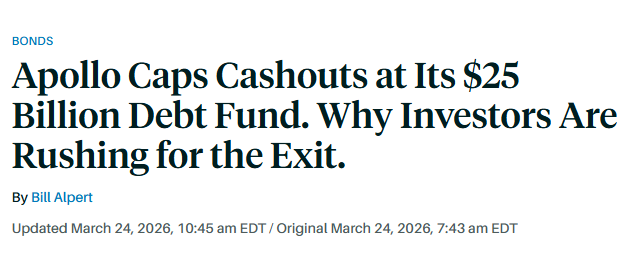
Private credit stress is still getting worse. This week, Apollo capped withdrawals on its $25 billion private credit fund after redemption requests hit 11% of total shares.
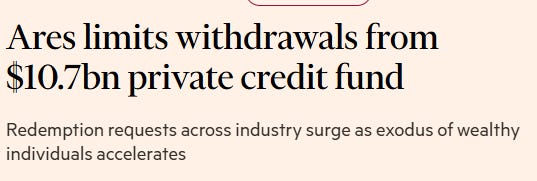
Ares capped withdrawals on its $10.7 billion private credit fund after investors rushed for the exits, pushing redemption requests to nearly 12%.
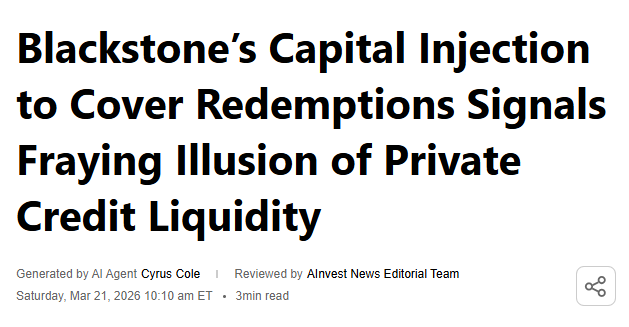
Blackstone injected $400 million of its own capital to stabilize one of its private credit funds.
These are massive firms. This does not threaten their solvency. But the headline cycle is self-fulfilling: fear drives redemptions, redemptions drive more fear, repeat.
If your advisor still has you locked in an illiquid private credit product in this environment, that’s a you problem with an easy fix. Find a new advisor.
The writing has been on the wall in this space for years, so if you are still invested, your guy is not paying attention.
That feedback loop is starting to turn, in the background, exactly the way these things tend to build before anyone decides it is worth worrying about. The Baa credit spread is at 1.79%, and the relative stability of BX, APO, and ARES on a week-over-week basis tells you the market is registering this as elevated stress, not a five-alarm fire, yet. The keyword there is yet. But the direction of the headlines is getting worse, and this is not a story that resolves on its own.
Then there is AI anxiety, which never actually went away; it just got pushed off the front page. The structural fear that AI could impair or eventually replace the SaaS business model was a genuine headwind in Q1, and the IGV chart tells you it still is.
Here’s my honest take on the “AI kills software” narrative: it’s dead wrong.
I’ve built my own software. Cut thousands in monthly subscription costs using AI and low-cost APIs. Was it effortless? Absolutely not. The internet wants you to believe 14-year-olds are running $100 million companies from their parents’ basement with a wall of Mac Minis and a fleet of AI agents. What nobody talks about is the API token costs, the verification time, and the mistakes you have to catch. I still spend an hour or two a day double and triple-checking that things are running properly. Now, I have created systems that are exactly what I want and only for me. Normal people do not decide to take on a project like that.
Here is what the market is missing. People do not do hard things when easy things are available. Said another way, it is easier not to do things than it is to do them. That is human nature. Why would anyone cancel a software subscription when a ready-made solution already exists? The market pricing in a world where everyone and their grandma becomes a software developer overnight is going to look very silly in hindsight.
AI is a tool, not a replacement for everything on the planet. When that finally sinks in, this chart turns around.
One more thought: I think 2026-2027 will be the years we actually start seeing measurable efficiency gains and real profit attribution tied directly to AI. They will still have to figure out the unsustainable capex spending, but that is tomorrow’s problem.
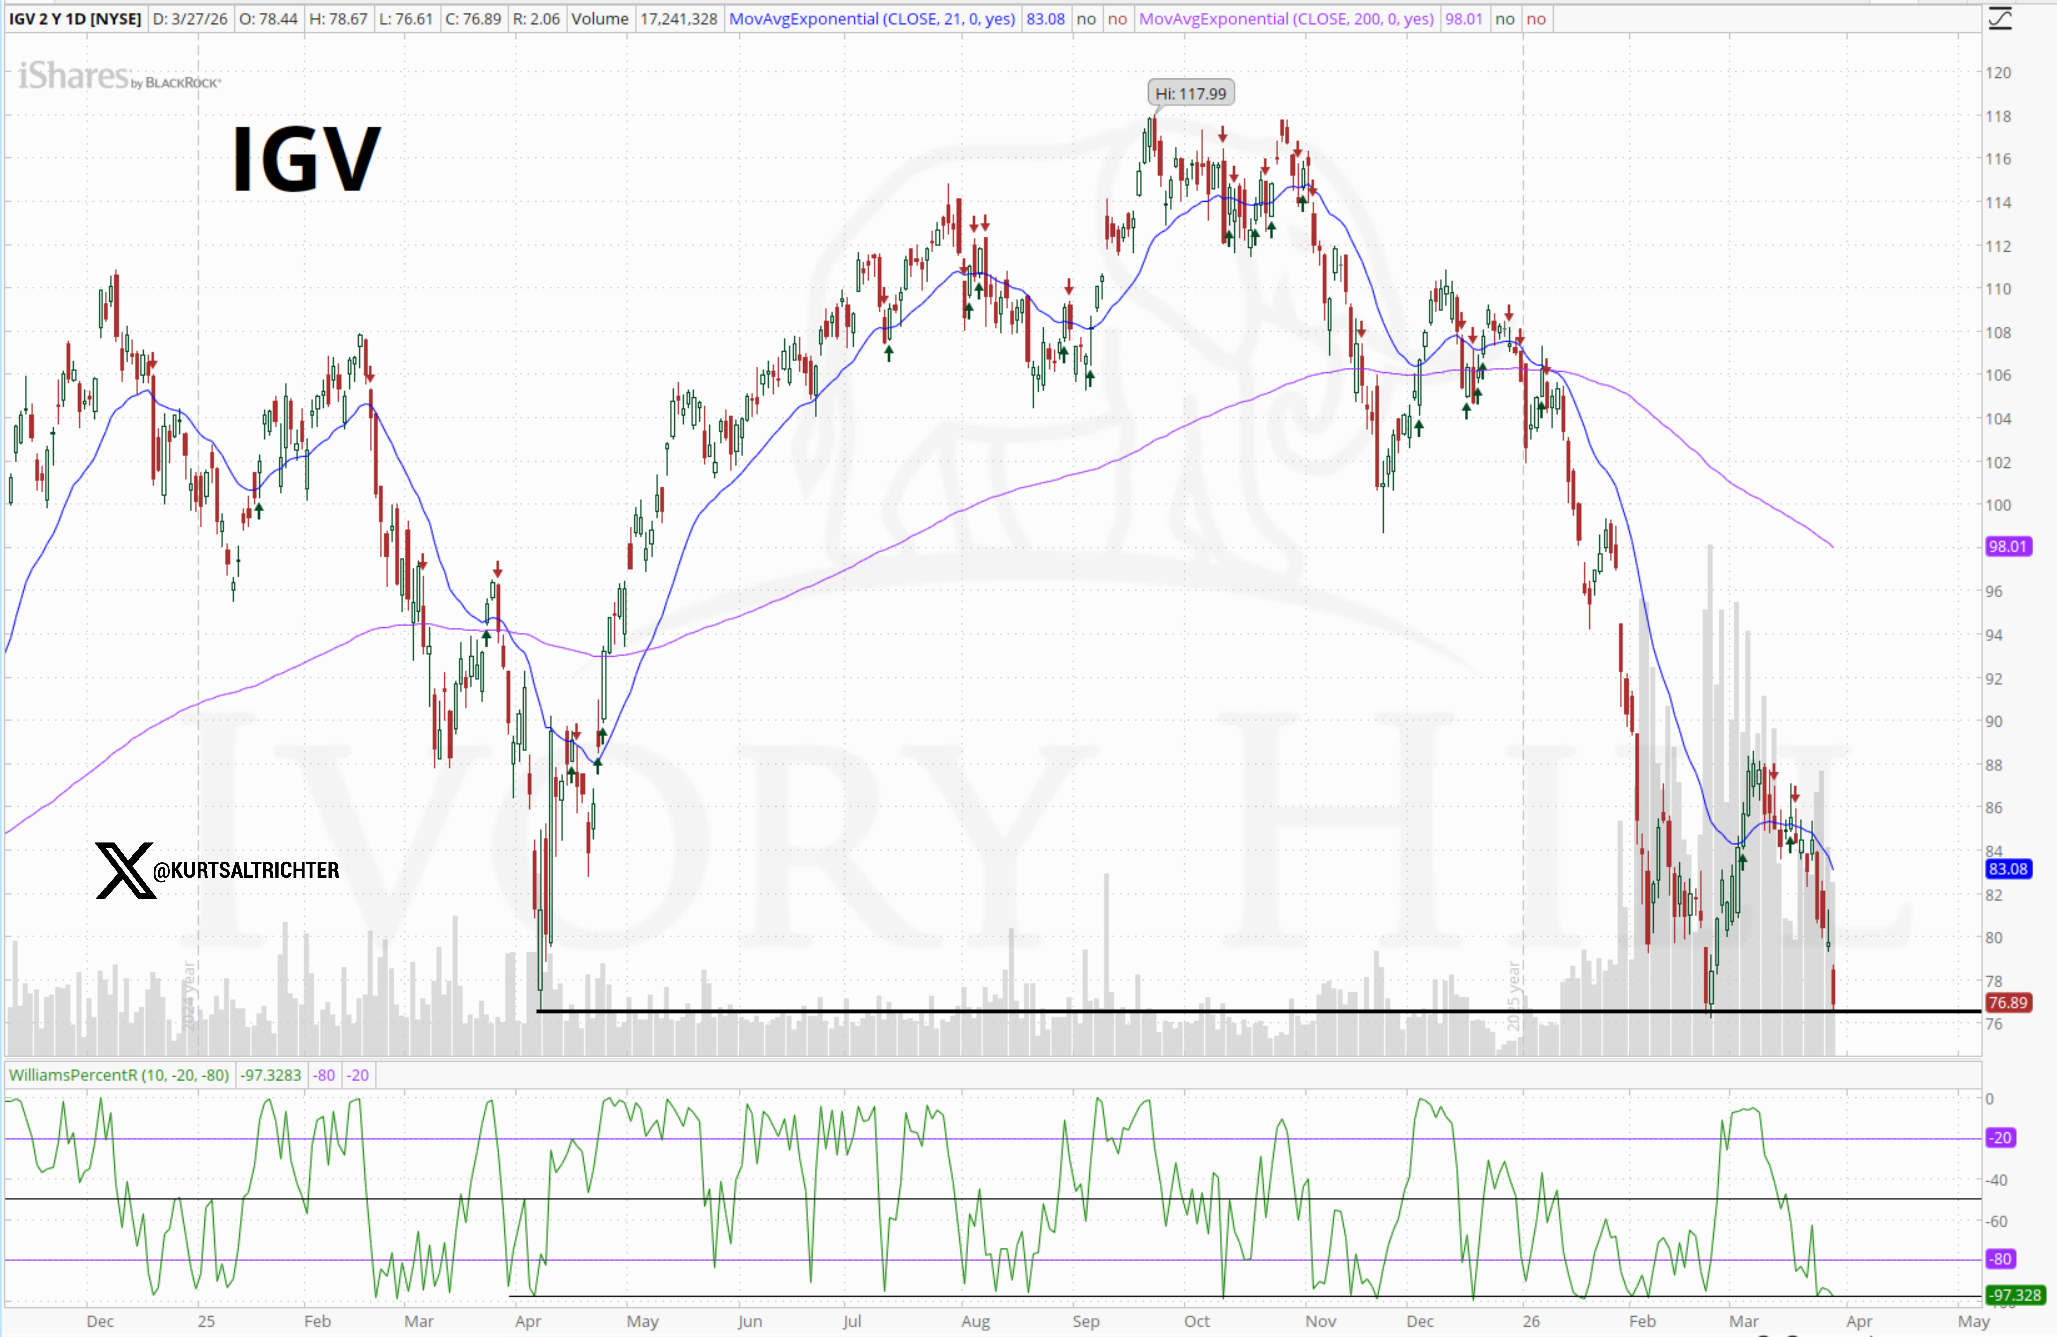
IGV peaked near $118 and has shed more than 32% from those highs, closing Thursday at $79.75, barely above the February low of $76.26.
What makes that concerning is not what happened, but what did not happen. Adobe, Workday, and Salesforce all reported broadly okay earnings. No new AI news justified another leg lower. And yet IGV cannot hold a rally. It bounced to $88 and sellers stepped right back in.
A sector that cannot find its footing on neutral news is under structural selling pressure.
The $76.26 low is the line. If it breaks, that is a negative signal for software and the broader market.
So here is where we actually are. Oil started a chain reaction that has not resolved, and the longer it stays elevated, the harder the Fed’s path gets. The equity market is in a downtrend with no technical evidence of a bottom. Volatility is elevated and trending higher. Private credit stress is building slowly and consistently in the background. And software cannot get off the mat even when there is no fresh bad news to justify the weakness.
None of these are individually catastrophic in a vacuum. But all of them together, at the same time, in the same market? That is how things break. Not from one thing. From everything piling up at once, while nobody was paying attention, with maximum market uncertainty.
The path keeps getting narrower. The only question is whether you are paying attention before it matters, or after.
And remember - The one fact pertaining to all conditions is that they will change.
Follow me on X for more updates.
Best regards,
-Kurt
Schedule a call with me by clicking HERE
Kurt S. Altrichter, CRPS®
Fiduciary Advisor | President
Disclosure
The RiskSignal Report is published by Ivory Hill, LLC. All opinions and views expressed in this report reflect our analysis as of the date of publication and are subject to change without notice. The information contained herein is for informational and educational purposes only and should not be considered specific investment advice or a recommendation to buy or sell any security.
The data, models, and tactical allocations discussed in this report are designed to illustrate market structure and positioning trends and may differ from portfolio decisions made by Ivory Hill, LLC or its affiliates. Investing involves risk, including the possible loss of principal. Past performance is not indicative of future results.
Ivory Hil, LLC, and its members, officers, directors, and employees expressly disclaim any and all liability for actions taken based on the information contained in this report.