

Friday’s CPI print did exactly what oil traders needed it to do. Headline CPI rose 0.4% in August, 3.4% year over year, and everyone panics at that headline number trending up. Look at what’s actually in the inflation basket. Fuel oil is up 50% year over year. Gasoline is up 27% year over year, with the monthly gain alone at 3.9%, accounting for more than 1/3 of the entire headline increase. That’s a war sitting on top of the oil market. Meanwhile, the bottom of the basket is outright deflating: smartphones down 10% year over year, used cars, appliances, and auto insurance all falling. Strip the energy spike out, and there’s no broad, money-driven inflation in this chart, just a supply shock sitting on top of falling goods prices.
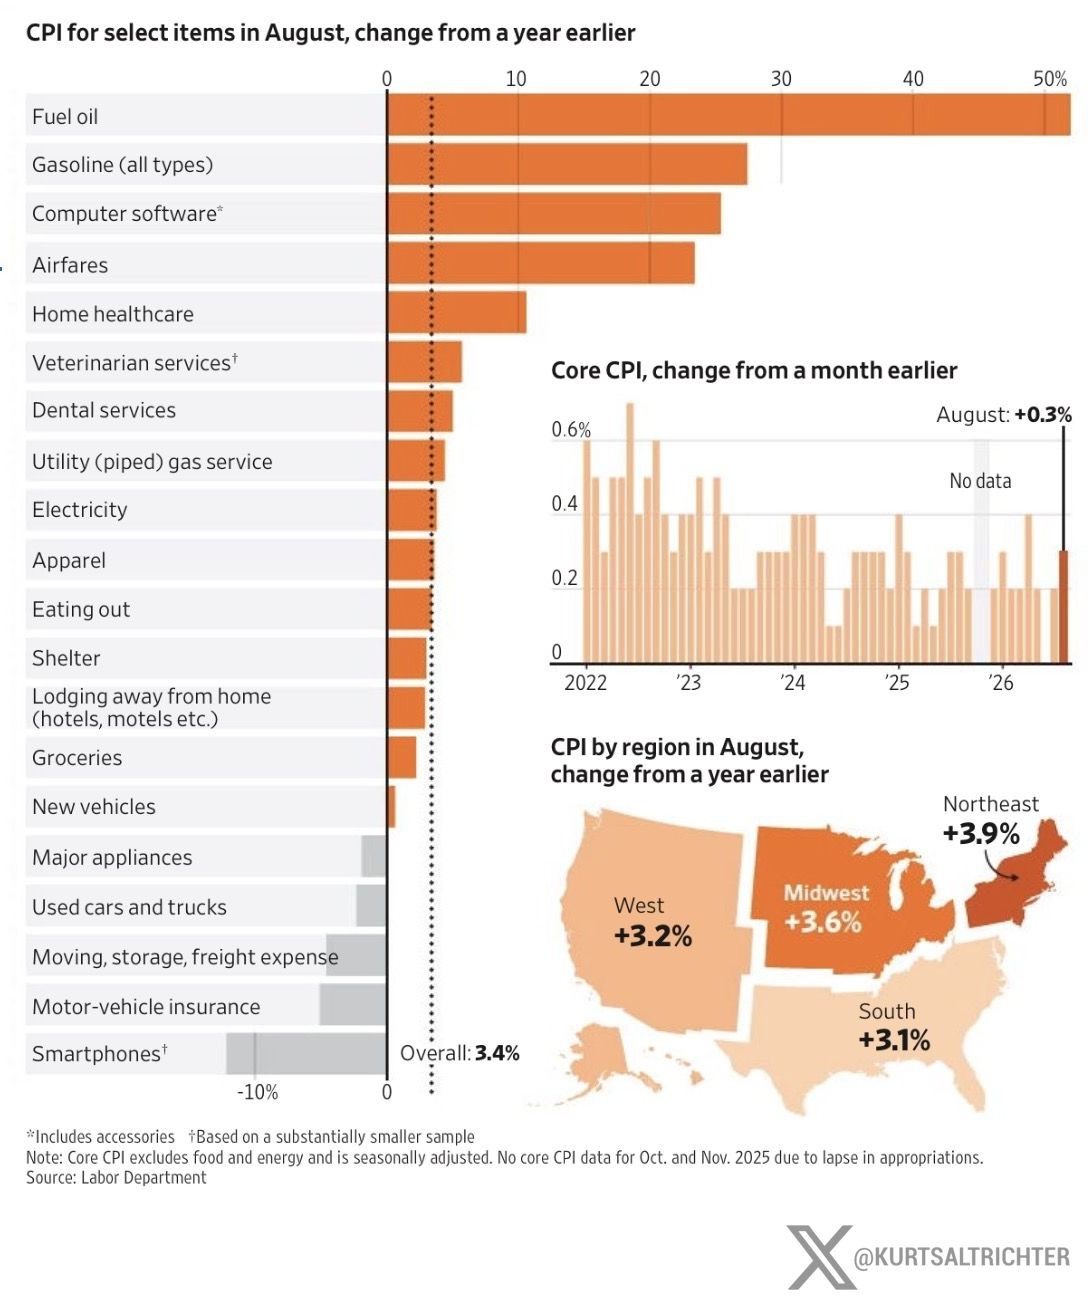
Core CPI, the number that strips out energy and food, ran hot too, up 0.3% against forecasts for 0.2%. Odds of a hike at Wednesday’s FOMC meeting jumped to 78% on the print.
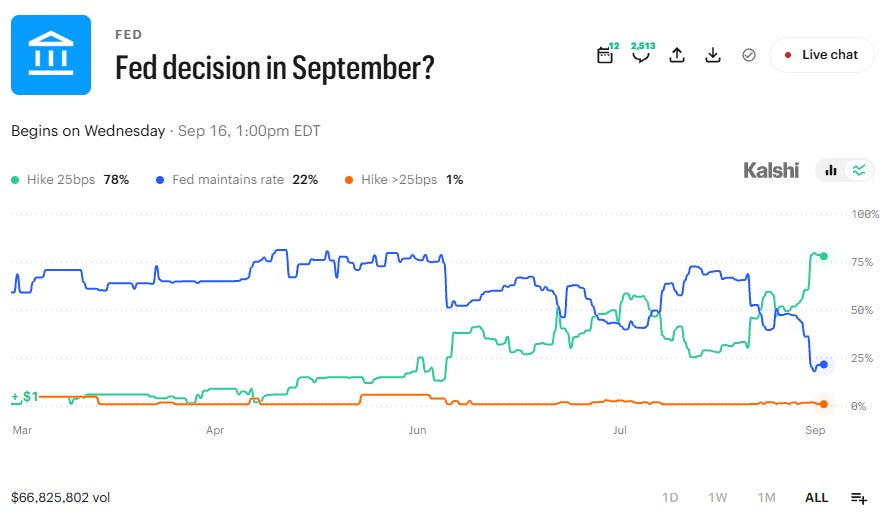
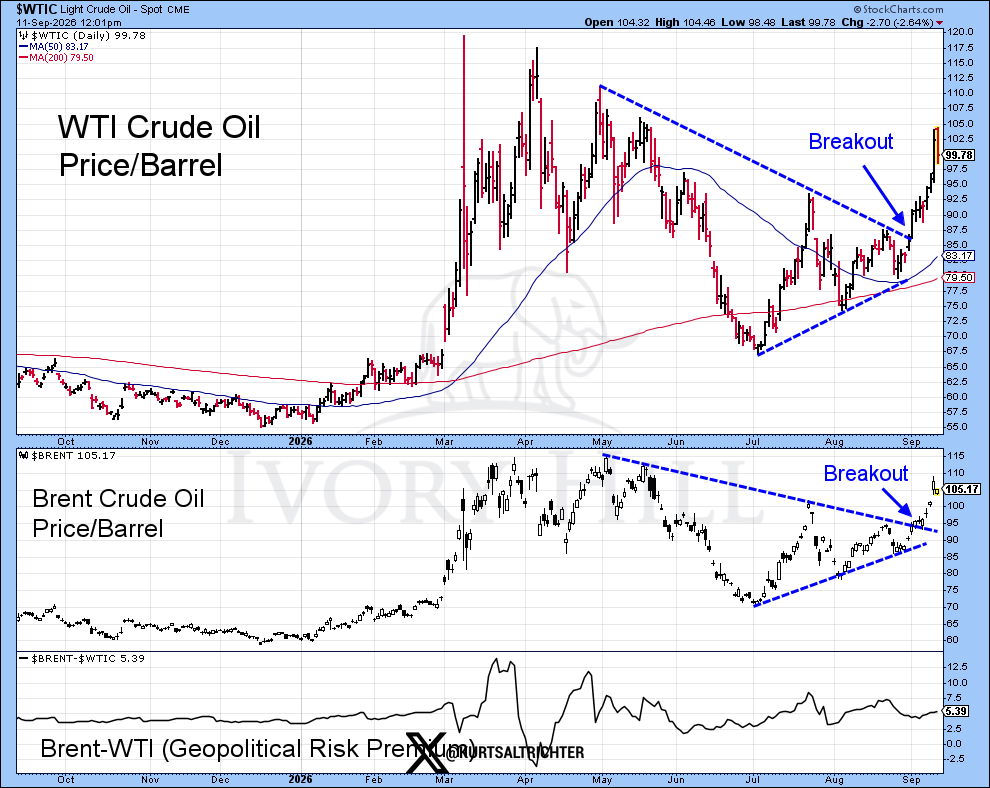
Here’s the problem with thinking a rate hike fixes any of this as inflation: it doesn’t. Brent crude cleared $100 a barrel for the first time since May after Iran and the U.S. traded strikes on tankers and naval vessels, topping a breakout that’s been building since a four-month base broke in late August. WTI sits at $99.78, Brent at $105.17, both punching through trendlines that had stopped every rally attempt since spring. That’s a supply shock landing at every gas pump and every diesel-powered delivery truck in the country. Everything we buy from a store or have delivered is ultimately delivered to the end point by truck. A quarter-point hike doesn’t produce a barrel of oil or reroute a tanker through the Strait of Hormuz. It makes your mortgage more expensive while the gas station bill stays exactly where geopolitics put it.
The Fed doesn’t get paid to make that distinction, and Wednesday’s decision now walks straight into a supply-driven number with cover to hike anyway.
Bessent’s Bet Comes Due
One day after the Fed decides, the Bank of Japan meets on Sept. 17-18, and here’s why that meeting matters to your money. Bessent wants Japan to hike. He’s not doing this because he cares about Japanese inflation. He’s doing it because a stronger yen makes the “yen carry trade” more expensive to run, and that trade is one of the biggest sources of cheap money propping up U.S. stocks and bonds. Here’s how it works: borrow yen at Japan’s near-zero interest rate, convert it to dollars, and buy anything that yields more, Treasuries, stocks, credit. It’s free leverage, and Japan has been the one funding it. Tokyo and Washington already tried the direct approach: when a currency is falling, a government can sell US dollars and buy its own currency to push the price back up, the same way buying any asset pushes its price higher. Japan and the U.S. did exactly that, spending roughly $98 billion buying yen between late July and late August to prop up its value. The yen barely budged. So Bessent is leaning on the bigger lever now, publicly pressuring BOJ Governor Ueda to raise interest rates instead, at one point invoking Spike Lee’s “Do the Right Thing” to make the point. It’s worked. The market now prices a BOJ hike as close to certain, which leaves Ueda with 2 bad options. Skip the hike and the yen keeps falling, pushing Japanese inflation toward 3% and making the $98 billion look wasted. Hike, and the carry trade above gets more expensive to hold. That forces funds to unwind the trade: sell Treasuries and stocks they bought with borrowed yen, convert the dollars back to yen, and pay back the loan. Multiply that by 2 years of accumulated positions and you get forced selling in U.S. assets right as Japan has less reason to keep buying our debt in the first place. As I have pointed out over the last year or so, this could be really bad for US stocks.
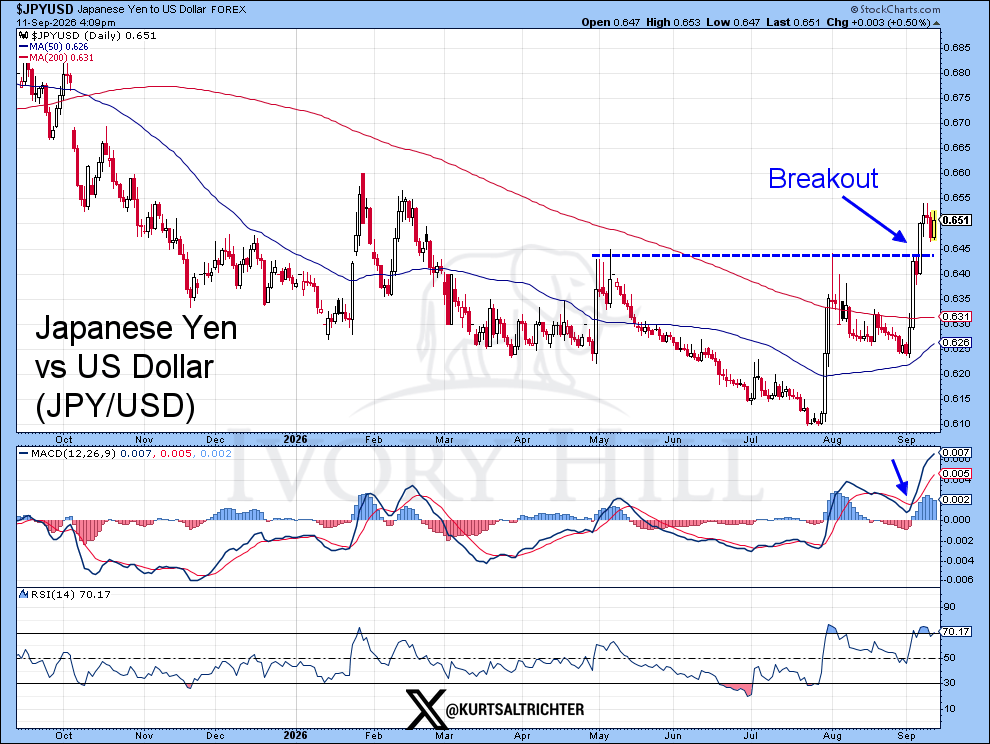
That unwind is already on the chart. The JPY/USD chart shows the yen breaking out above 0.644, a level that had stopped every rally since spring, with RSI near 70 and MACD turning up. That’s what leveraged money looks like when it starts unwinding a carry trade before the headlines catch up. It’s the same setup behind August 2024, when a single BOJ hike surprise sent the S&P 500 down more than 3% in one session as funds scrambled to unwind their yen borrowing all at once.
There's a second way this bites us, and it's bigger than the carry trade. Japan isn't just a source of cheap borrowed money, it's our largest foreign creditor, holding $1.12 trillion of U.S. government debt, more than the U.K. and China combined. If the yen keeps falling and Japan needs to defend it again, one of the fastest ways to raise dollars is to sell its Treasury position outright. And even without a forced sale, a BOJ hike raises yields on Japan's own government bonds at home, which gives Japanese banks, insurers, and pension funds a reason to keep their money in yen instead of hedging it into dollars to buy our debt. Either way, the largest buyer of U.S. Treasuries has less incentive to keep buying, or an actual reason to start selling, right as our own Treasury needs the world to keep absorbing new debt. That's upward pressure on the 10-year yield from a completely separate direction than the oil and inflation story above, landing at the same time.
The Charts Already Know
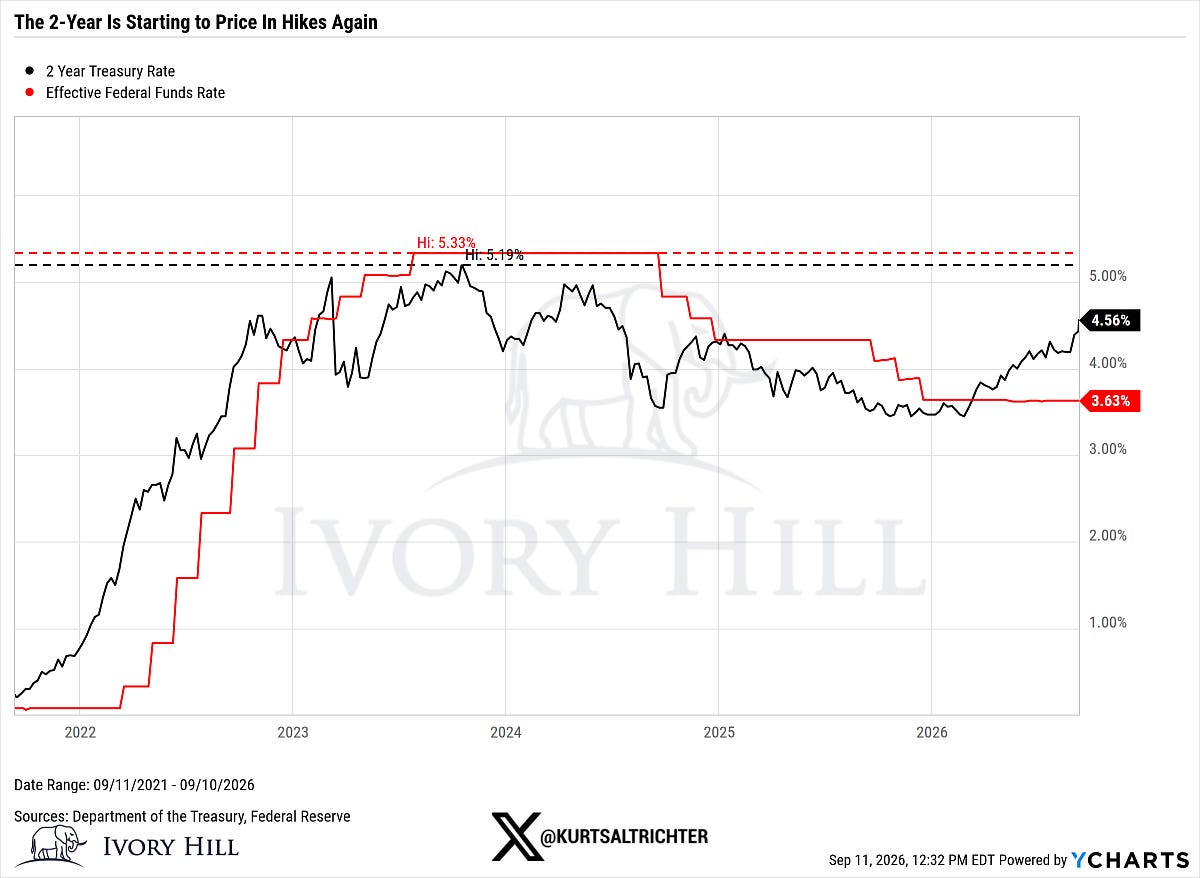
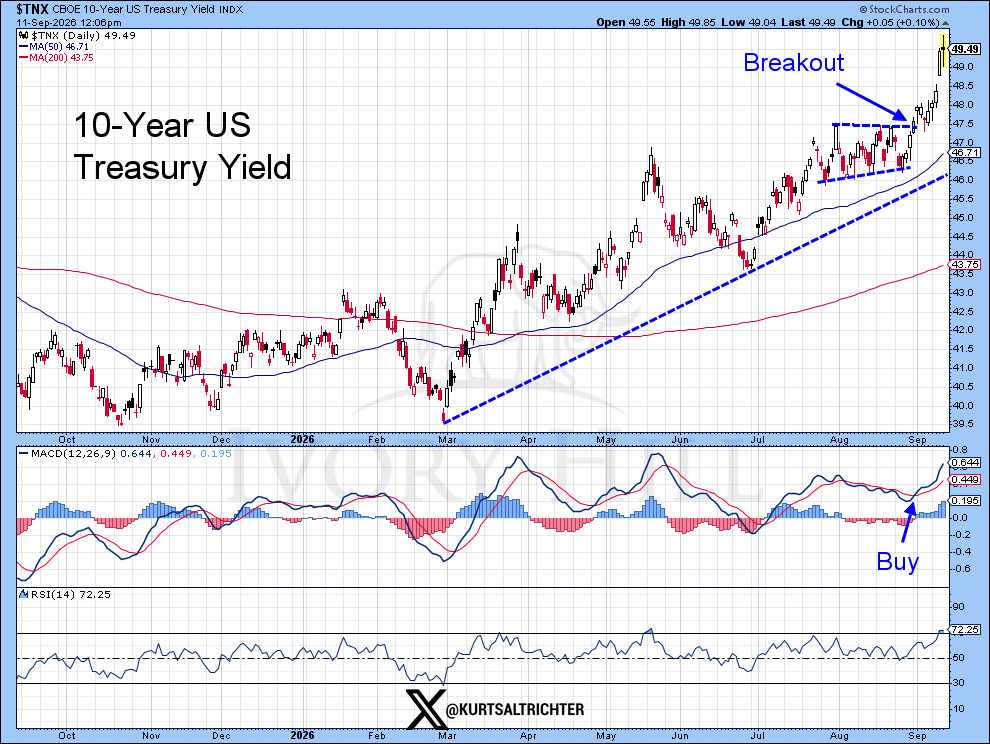
None of this is theoretical. The 10-year Treasury yield broke out above its summer range this week: RSI at 72, MACD flashing a fresh buy signal, and the yield sitting near 4.95%, one push from 5%. The 2-year is even more telling. It’s back up to 4.56%, above the effective fed funds rate of 3.63%, meaning the bond market is pricing in more hikes ahead. That’s a full reversal from where the curve sat just months ago when cuts were the consensus trade.
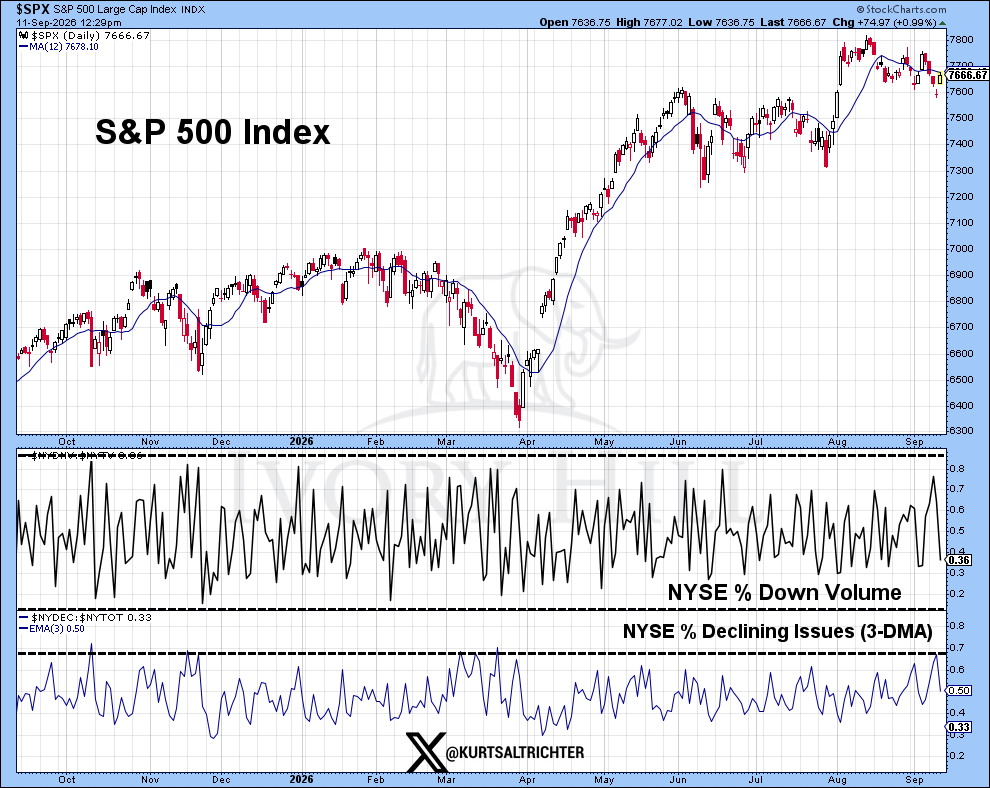
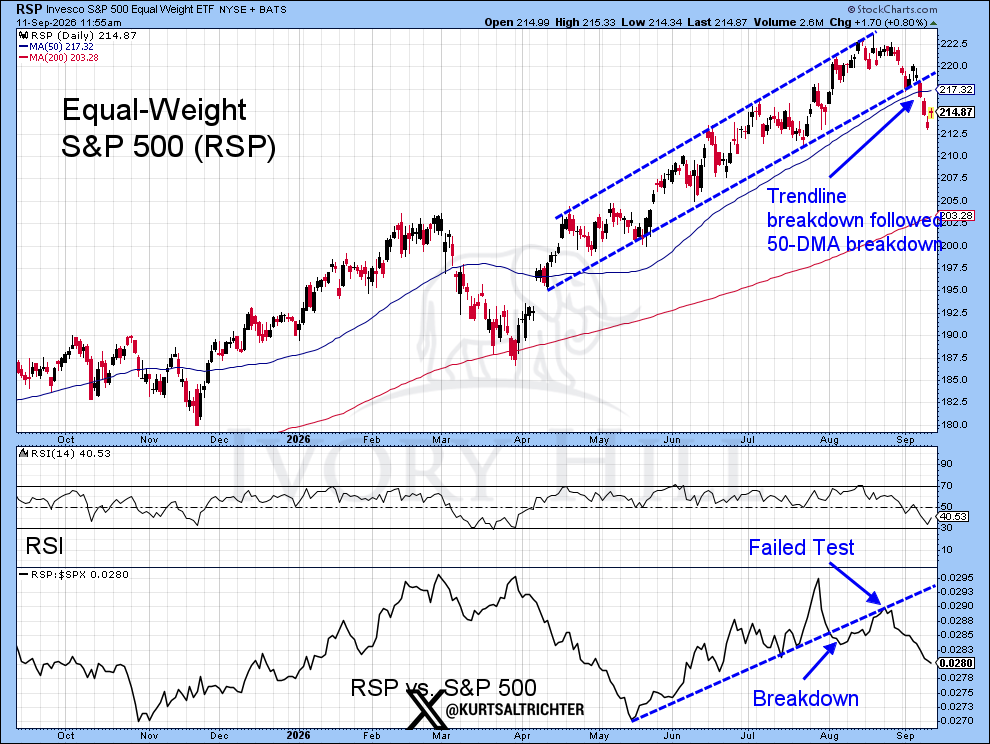
Equity breadth is cracking under the surface while the S&P 500 (7,667) holds near its highs. The equal-weight S&P 500 (RSP) broke its uptrend channel and its 50-day average, and its relative strength line against the cap-weighted index just made a new low after a failed retest of its old highs. That’s the market telling you the rally is concentrated in fewer names, exactly the condition that leaves an index exposed if the carry trade unwinds into it.
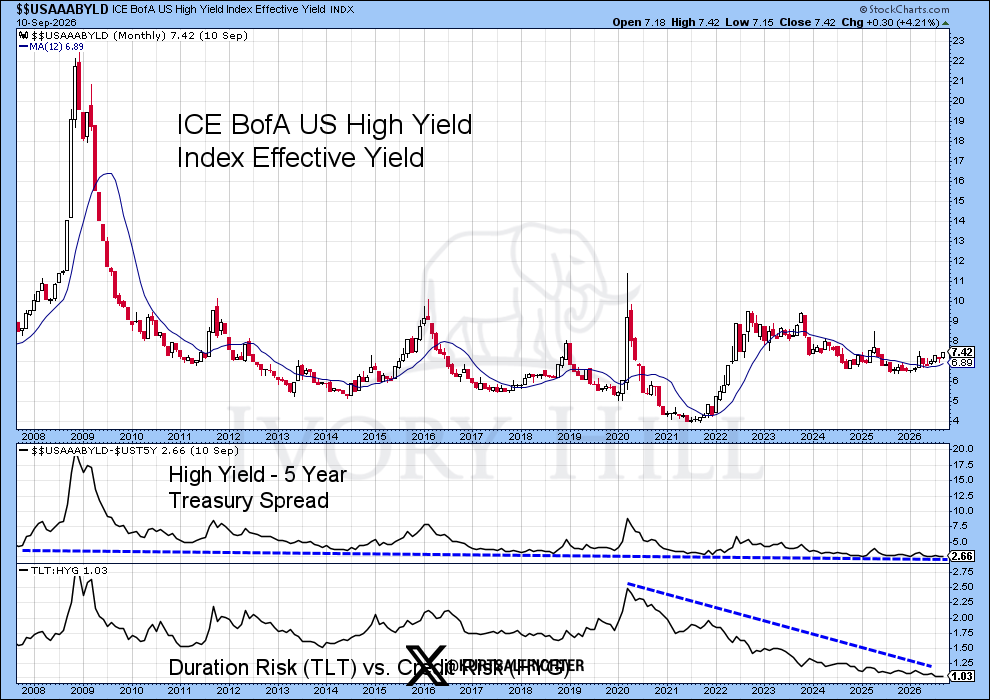
Credit isn’t flashing the same warning yet. High yield spreads over the 5-year Treasury sit near multi-year lows at 2.66, and the ratio of duration risk to credit risk (TLT versus HYG) is at 1.03, near the low end of its range. This isn’t a solvency scare. It’s a liquidity and positioning problem stacking on top of an oil shock, which is more dangerous in some ways because it can move fast with no credit event to warn you first.
The Three-Part Scorecard for a Real Rally
I’ve said that this market needs 3 specific things to go right before it can push back to new highs, and it’s worth grading each one against what actually happened this week.
1. Oil needs to stop climbing. Nobody needs a ceasefire for this headwind to fade. All the market needs is for oil flowing through the Strait of Hormuz to hold up and for the reciprocal strikes to stop escalating. That was true a month ago. It’s not what happened. Strikes resumed, an explosion hit Kharg Island, Iran’s main export terminal, and Brent broke above $100 for the first time since May. This leg of the case got worse.
2. The Fed needs to draw a clean line. A hike by itself isn’t fatal to a rally if the Fed signals it’s one-and-done and steps back. What would be fatal is a hike that the market reads as the start of a cycle, especially with the 2-year yield already pricing in more tightening than the current Fed funds rate implies. Wednesday is a coin flip on tone, and the setup next to a BOJ hike a day later makes a confident, market-friendly signal harder to deliver.
3. CPI start trending lower. This one already happened, and it already failed. Core CPI ran hot against forecasts. That removes a leg of the rally case before the Fed has even opened its mouth this week.
Two of 3 have already moved against the bull case heading into Wednesday. The third is a coin flip that gets harder to call dovish with the BOJ moving the next day.
Zooming Out: What the Multiples Say
Strip out the week-to-week noise and the market is really pricing 3 things: how the Iran conflict resolves, where the 10-year settles, and whether AI capex turns into real cash flow instead of just spending mountains of cash. Here is a scenario of those 3 inputs, and it’s worth walking through where each column sits right now.
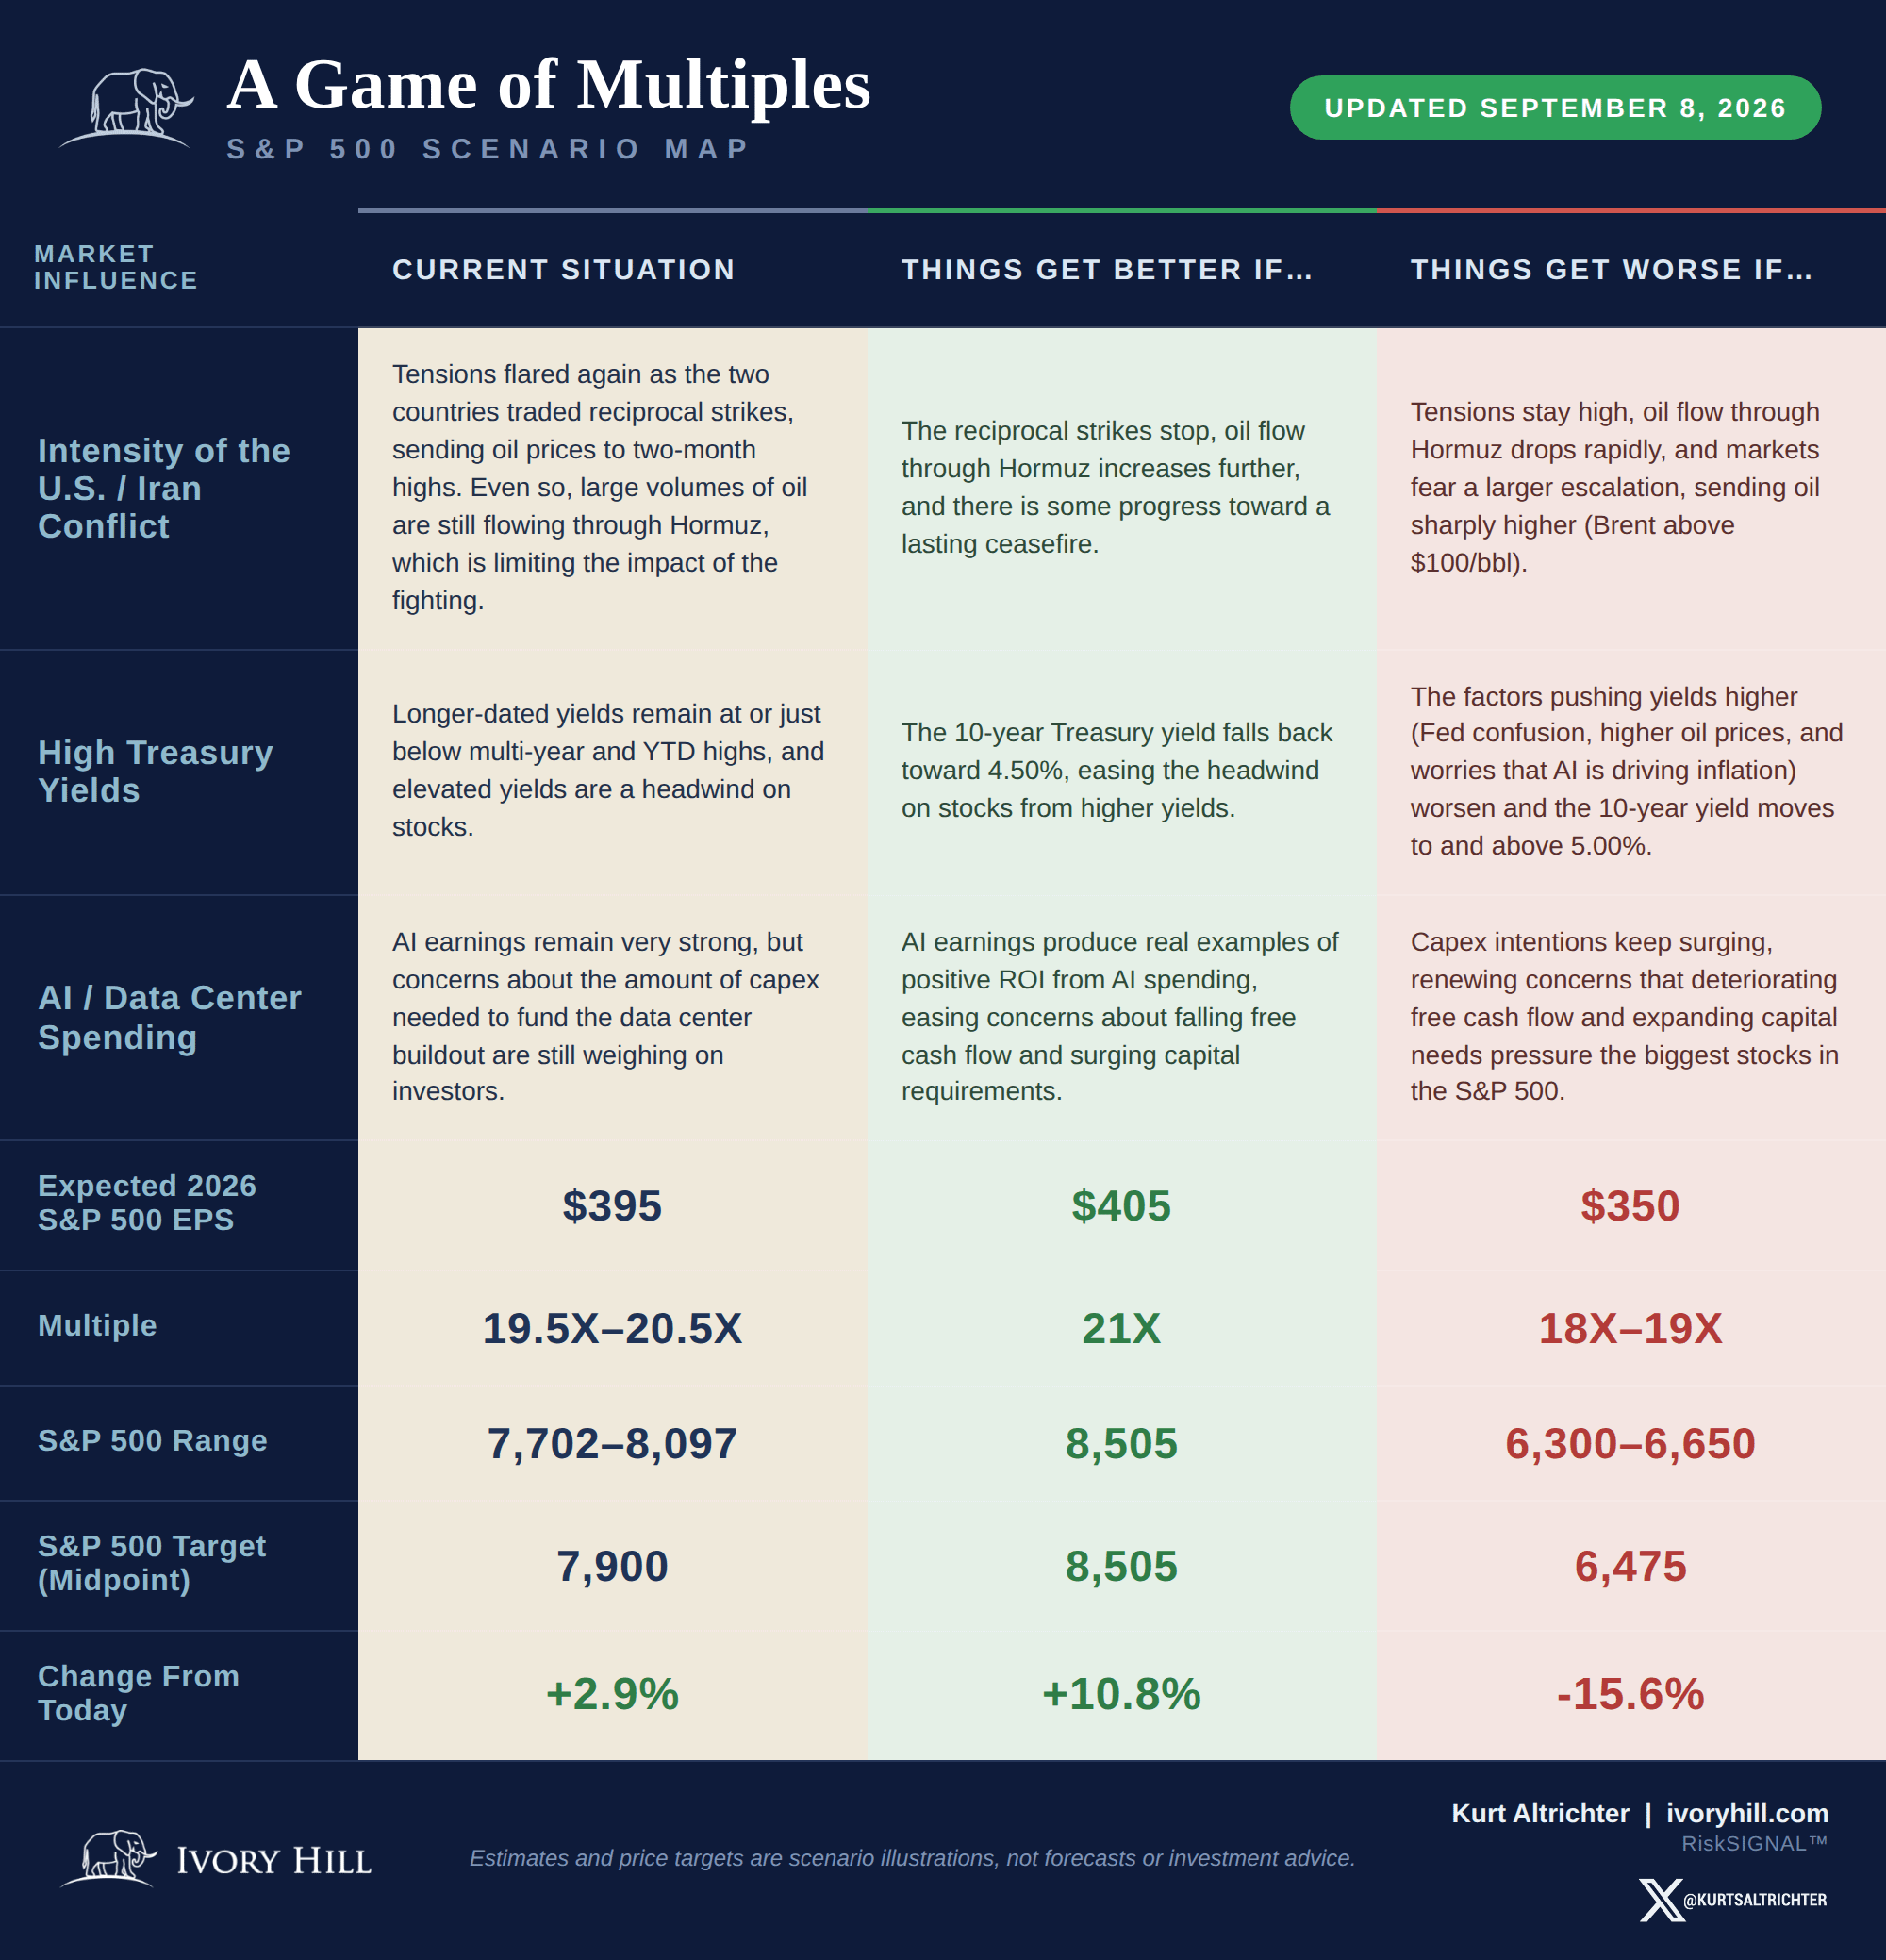
The current-situation uses 2026 expected S&P 500 EPS of $395, a fair-value multiple of 19.5x to 20.5x, and lands at a midpoint target of 7,900, about 2.9% above where the index sits today. That’s the base case, and it assumes none of this week’s headwinds get materially worse or better.
The better-case column needs all 3 things breaking the right way at once: oil flow through Hormuz stabilizing further, the 10-year falling back toward 4.50%, and AI earnings producing real, provable ROI instead of just bigger capex budgets. If that happens, EPS expectations rise to $405, the multiple expands to 21x, and the target jumps to 8,505, a gain of 10.8% from here. Every part of that column moved the wrong direction this week.
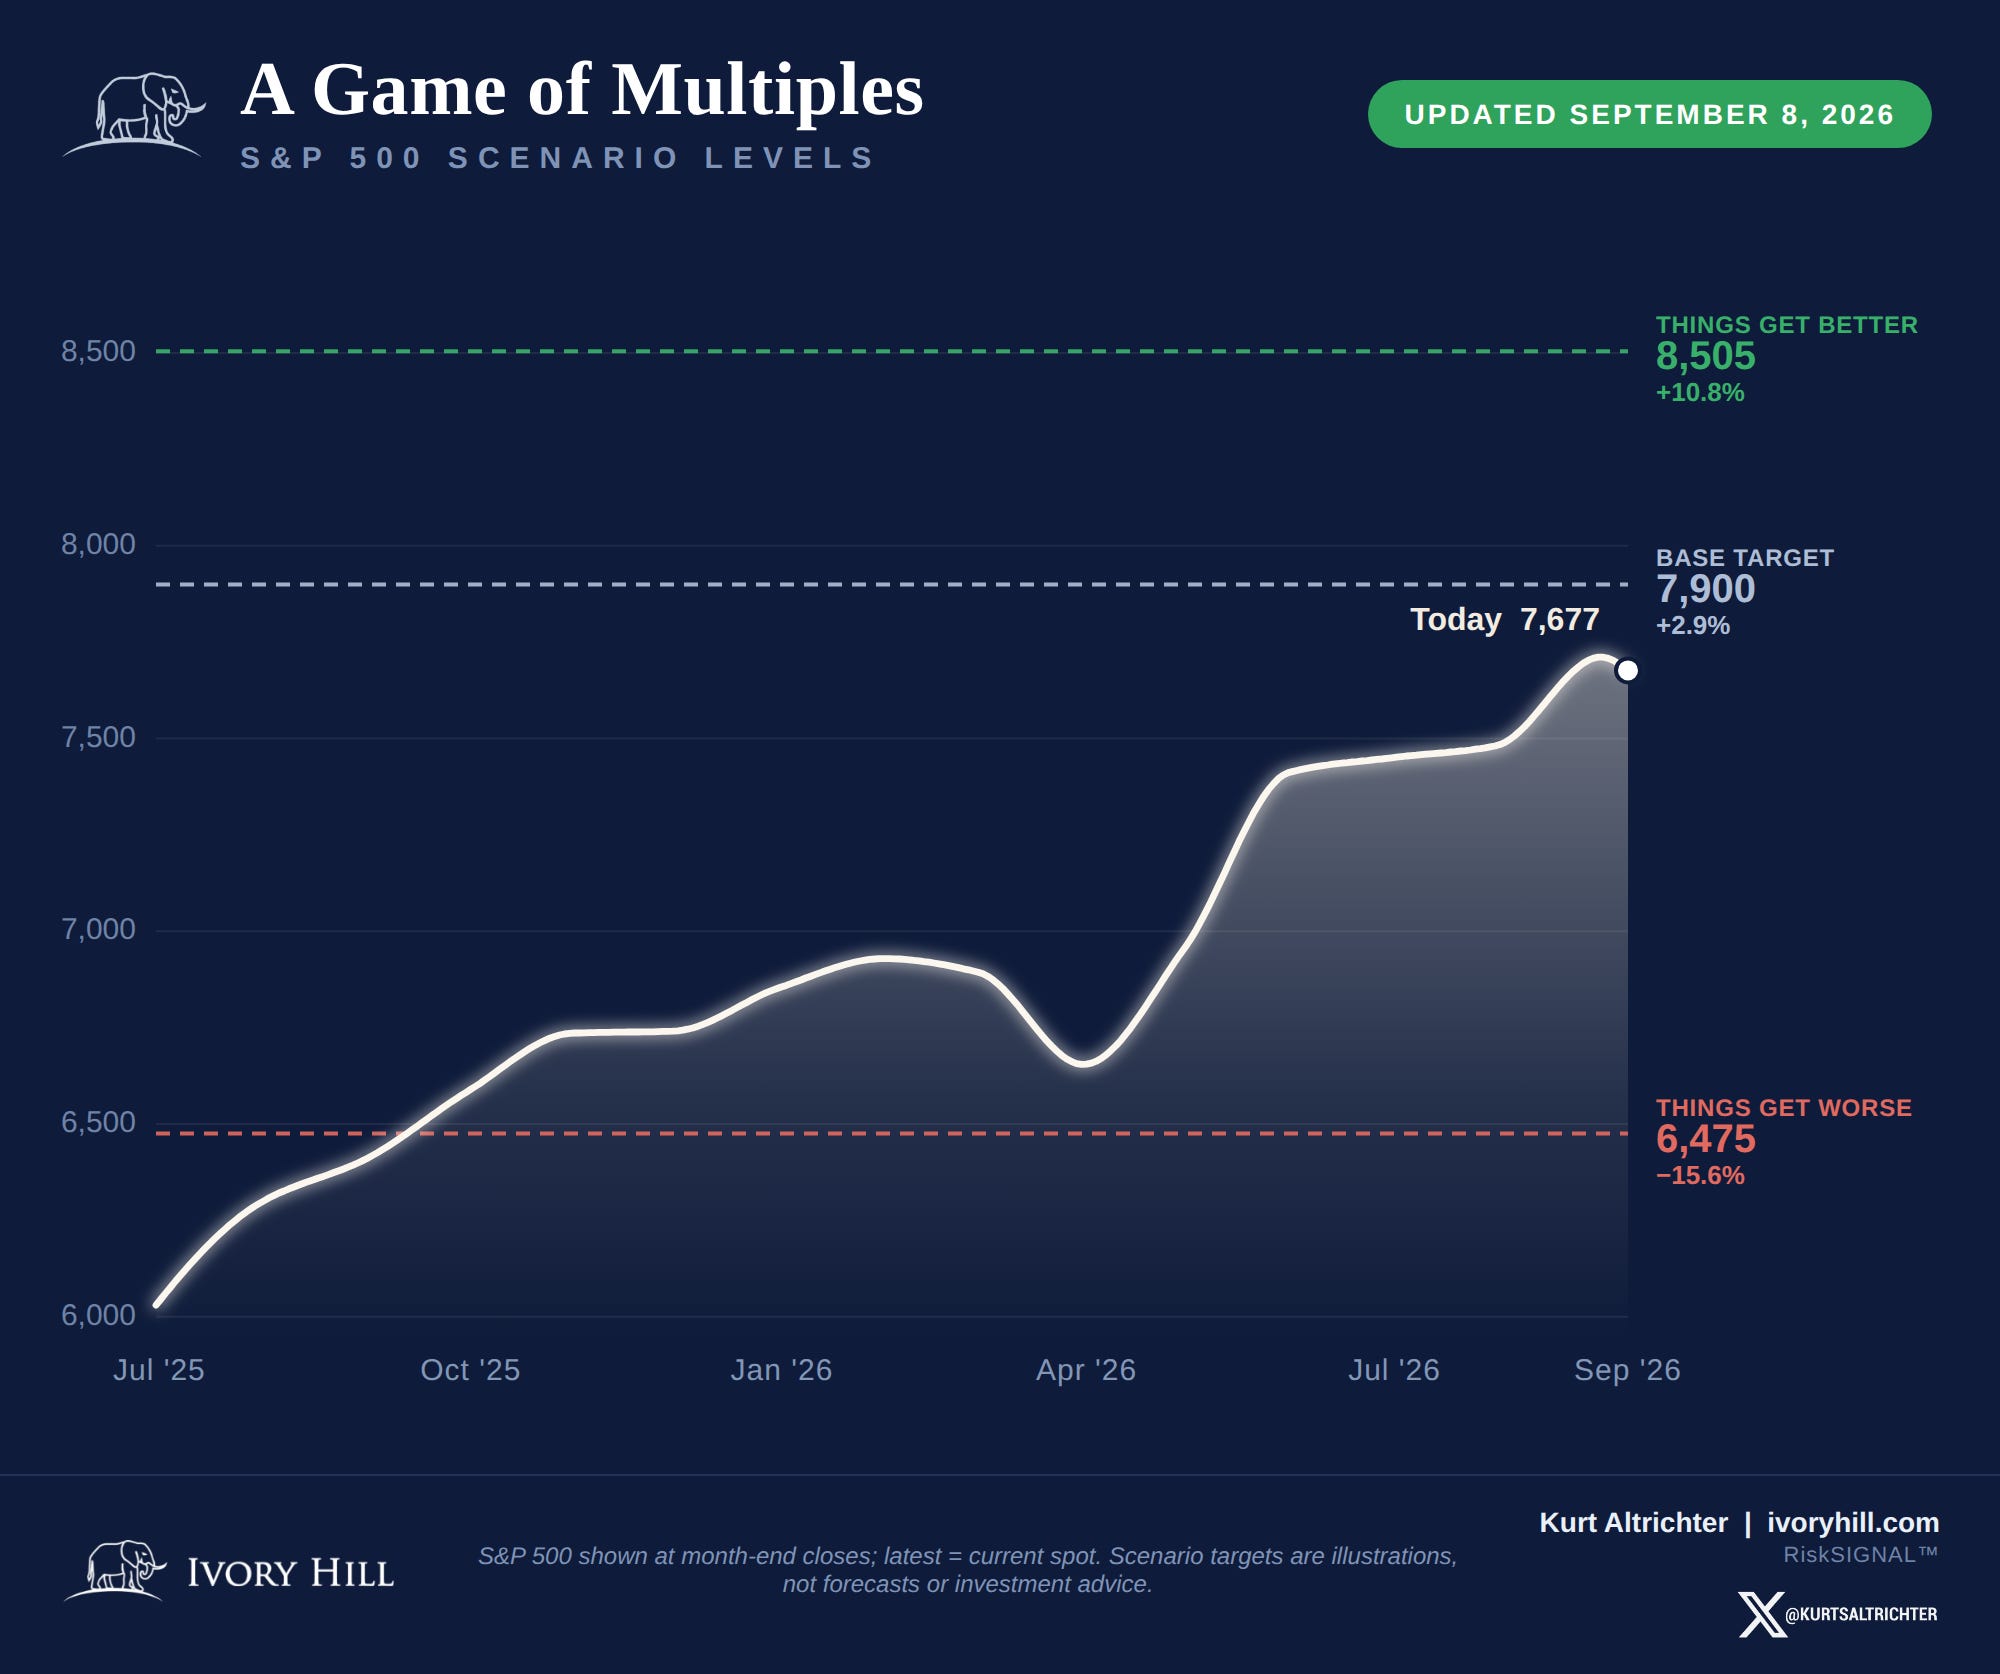
The worse-case column is the one that should get your attention. It needs oil flow through Hormuz to drop and Brent to push meaningfully above $100, the 10-year to trade to and through 5%, and capex fears to deepen on falling free cash flow. EPS expectations fall to $350, the multiple compresses to 18x to 19x, and the target lands at 6,475, a drop of 15.6% from current levels. Brent is already above $100. The 10-year is already one push from 5%. Two of the 3 worse-case triggers are already partially in motion.
None of this means the bear case is our only destiny. It means the market has almost no margin for error heading into a week when the Fed and the BOJ both decide on rates within 24 hours of each other.
The counterpoint worth taking seriously: none of this shows up in credit yet, and earnings are still the best argument the bulls have. The Street’s 2027 EPS estimate for the S&P 500 sits near $400, up sharply from this year’s $350, and on a forward basis that keeps the index from looking stretched even at current prices. If oil rolls over toward $87.50 support the way it has after prior breakouts, and the Fed delivers a hike with clear forward guidance that it’s done, the whole setup above unwinds fast in the other direction. This is a market that can rally hard once the headwinds clear. The problem this week is that none of them have.
What This Means for You
Higher oil is a direct tax on anything trucked, shipped, or flown: groceries, retail goods, anything delivered to your door. That’s a margin problem for companies and a budget problem for households, and it’s happening whether or not the Fed hikes. If the Fed hikes Wednesday and the BOJ follows a day later, 2 of the world’s largest central banks are tightening inside the same 48 hours while the yen carry trade, one of the biggest sources of liquidity behind the risk-on rally since 2022, gets more expensive to hold overnight.
Stay short duration on bonds. Long-dated Treasuries have already underperformed credit for years in this environment, and a 10-year yield pushing toward 5% is not the entry point for TLT. When I started my firm, I used to trade currencies in my personal account to make some extra cash. I was scalping 30 bps a day, then I would stop. I also never traded if there was anything weird in the FX news. This week I wouldn’t make a trade because there is way too much uncertainty. You want to stay overweight energy: XLE and CRAK are both in confirmed uptrends and benefit directly from the oil breakout regardless of what the Fed does. Underweight small caps and industrials, both are already breaking down technically and are first in line when funding costs rise and breadth thins. Watch the multiples map above like a scoreboard: if oil rolls over and the 10-year turns back down, the 8,505 case comes into play fast. If it doesn’t, 6,300 to 6,650 is the base case for the next leg down. And don’t mistake a hot CPI print driven by a gas station line for the kind of inflation that actually erodes your purchasing power over time. That kind only comes from one place, and Wednesday’s decision isn’t it.
And remember - The one fact pertaining to all conditions is that they will change.
Follow me on X for more updates.
Best regards,
-Kurt
Schedule a call with me by clicking HERE
Kurt S. Altrichter, CRPS®
Fiduciary Advisor | President
Disclosure
The RiskSignal Report is published by Ivory Hill, LLC. All opinions and views expressed in this report reflect our analysis as of the date of publication and are subject to change without notice. The information contained herein is for informational and educational purposes only and should not be considered specific investment advice or a recommendation to buy or sell any security.
The data, models, and tactical allocations discussed in this report are designed to illustrate market structure and positioning trends and may differ from portfolio decisions made by Ivory Hill, LLC or its affiliates. Investing involves risk, including the possible loss of principal. Past performance is not indicative of future results.
Ivory Hil, LLC, and its members, officers, directors, and employees expressly disclaim any and all liability for actions taken based on the information contained in this report.