
Risk-Off Rotation or Whipsaw?
Evaluating the Market’s Next Move as Uncertainty Grows

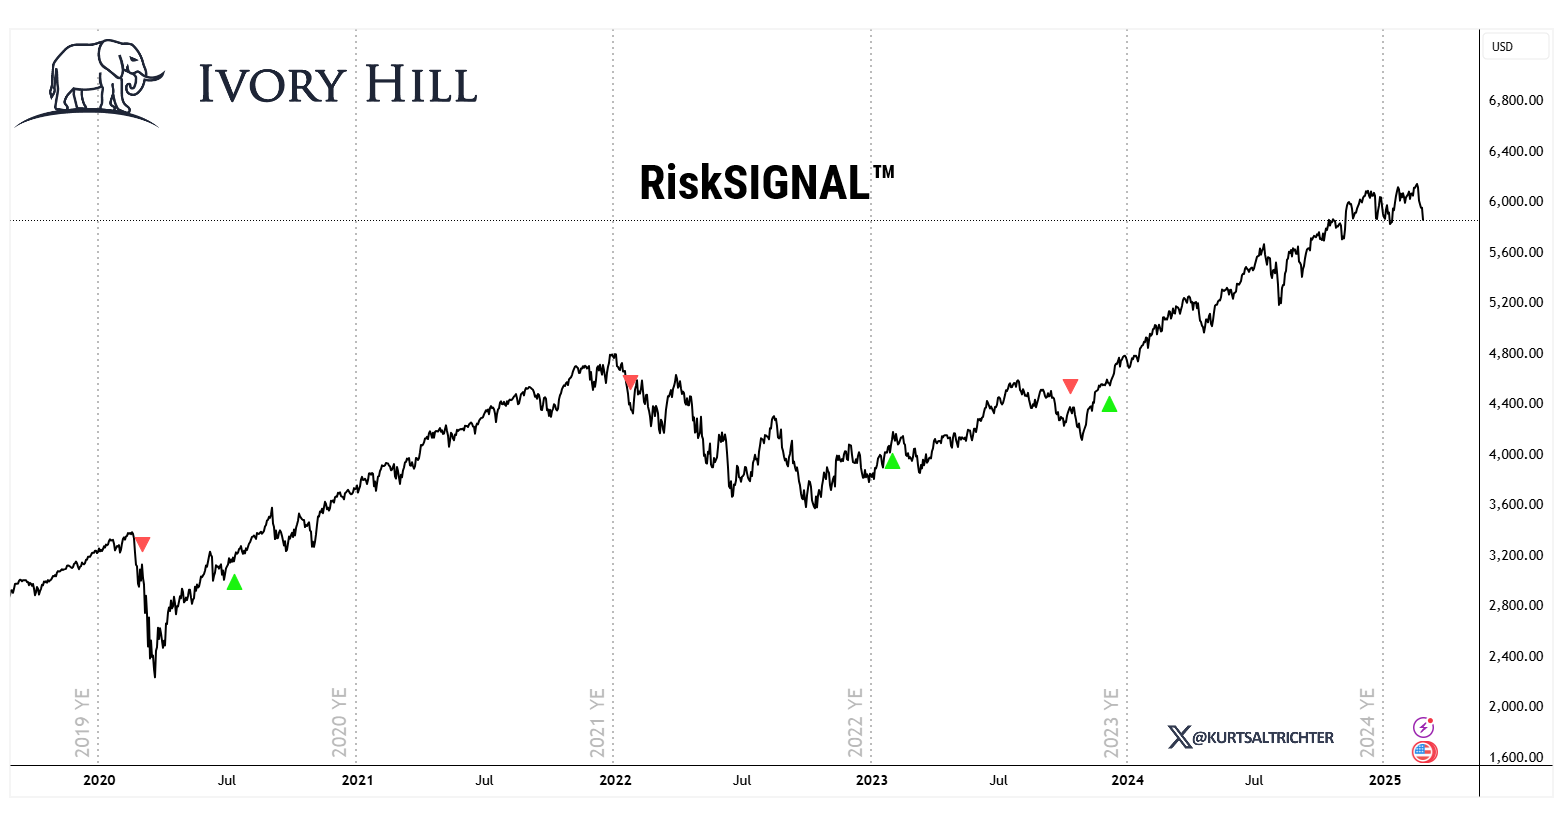
The Ivory Hill RiskSIGNAL™ remains green, confirming that pullbacks are buying opportunities. Our short-term and mid-term volatility signals are red so higher volatility over the next few weeks should be expected.
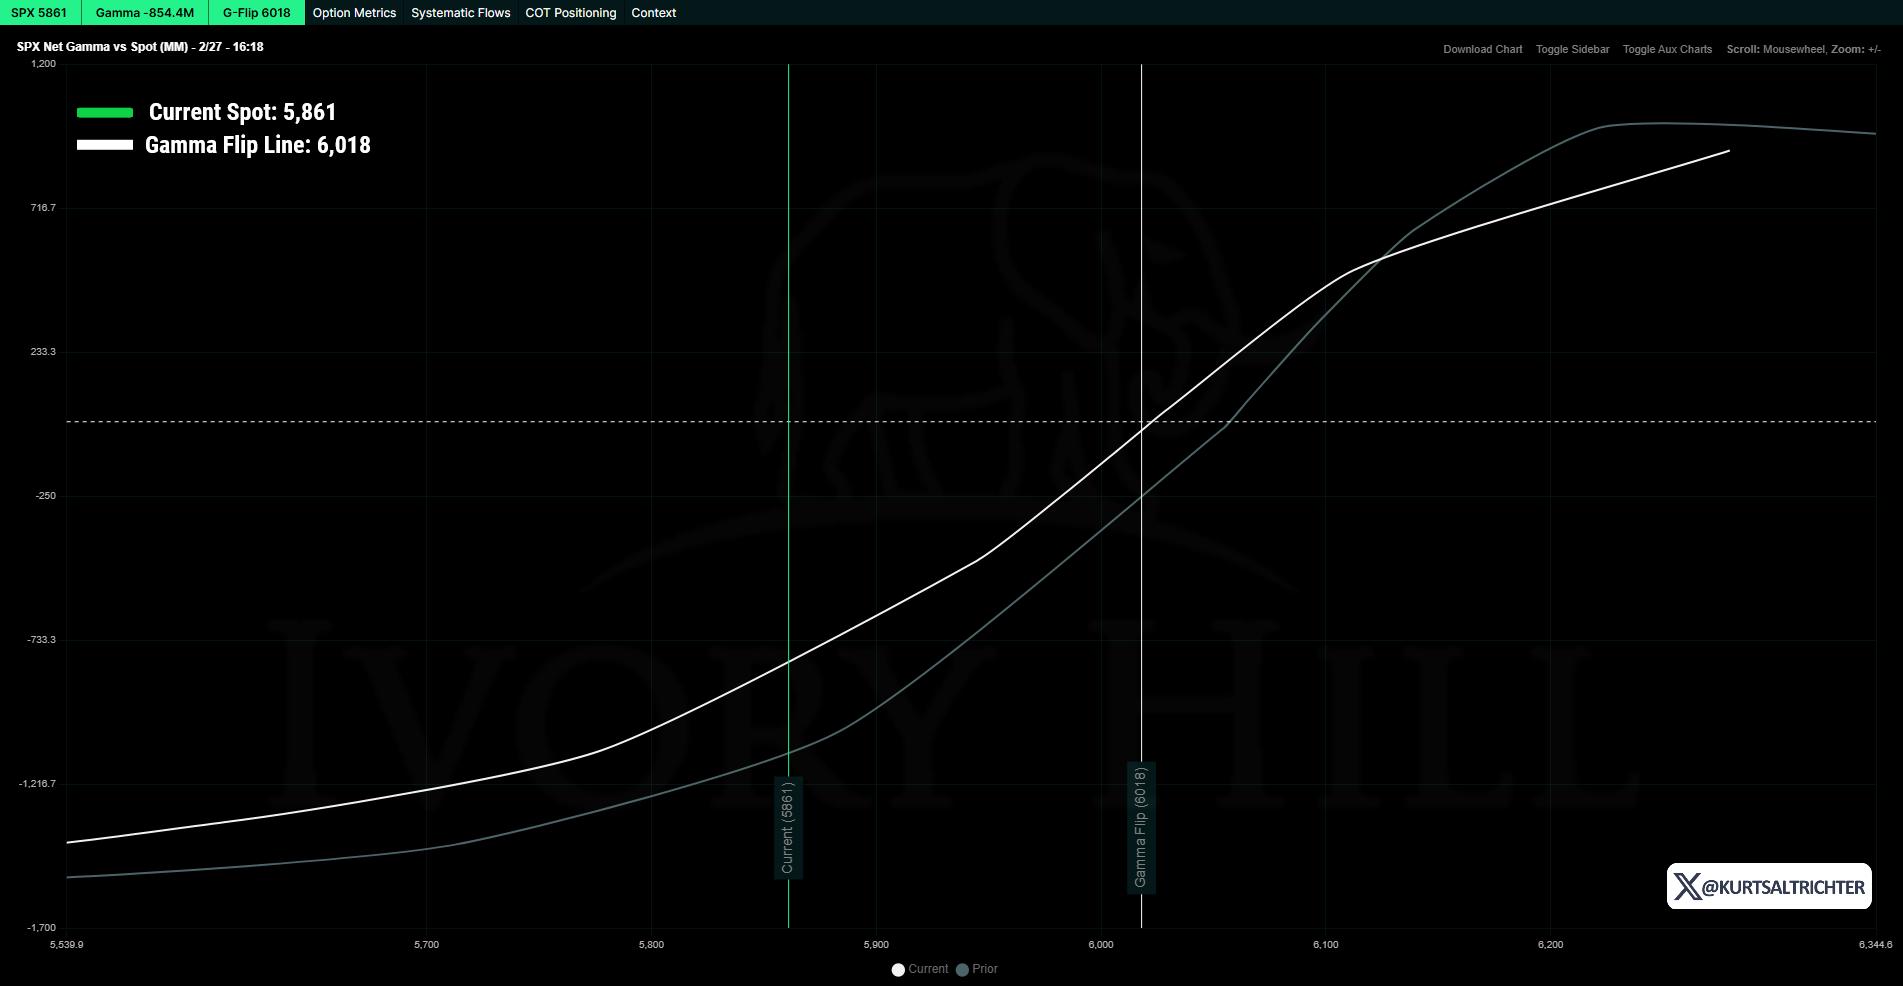
Market makers are in a short gamma position, which suggests elevated volatility ahead. In a negative gamma environment, option dealers adjust their hedges by selling futures as prices decline and buying futures as prices rise. These adjustments will amplify market movements, reinforcing volatility. We need the market to rally above 6,018 in order to get into a more favorable environment.
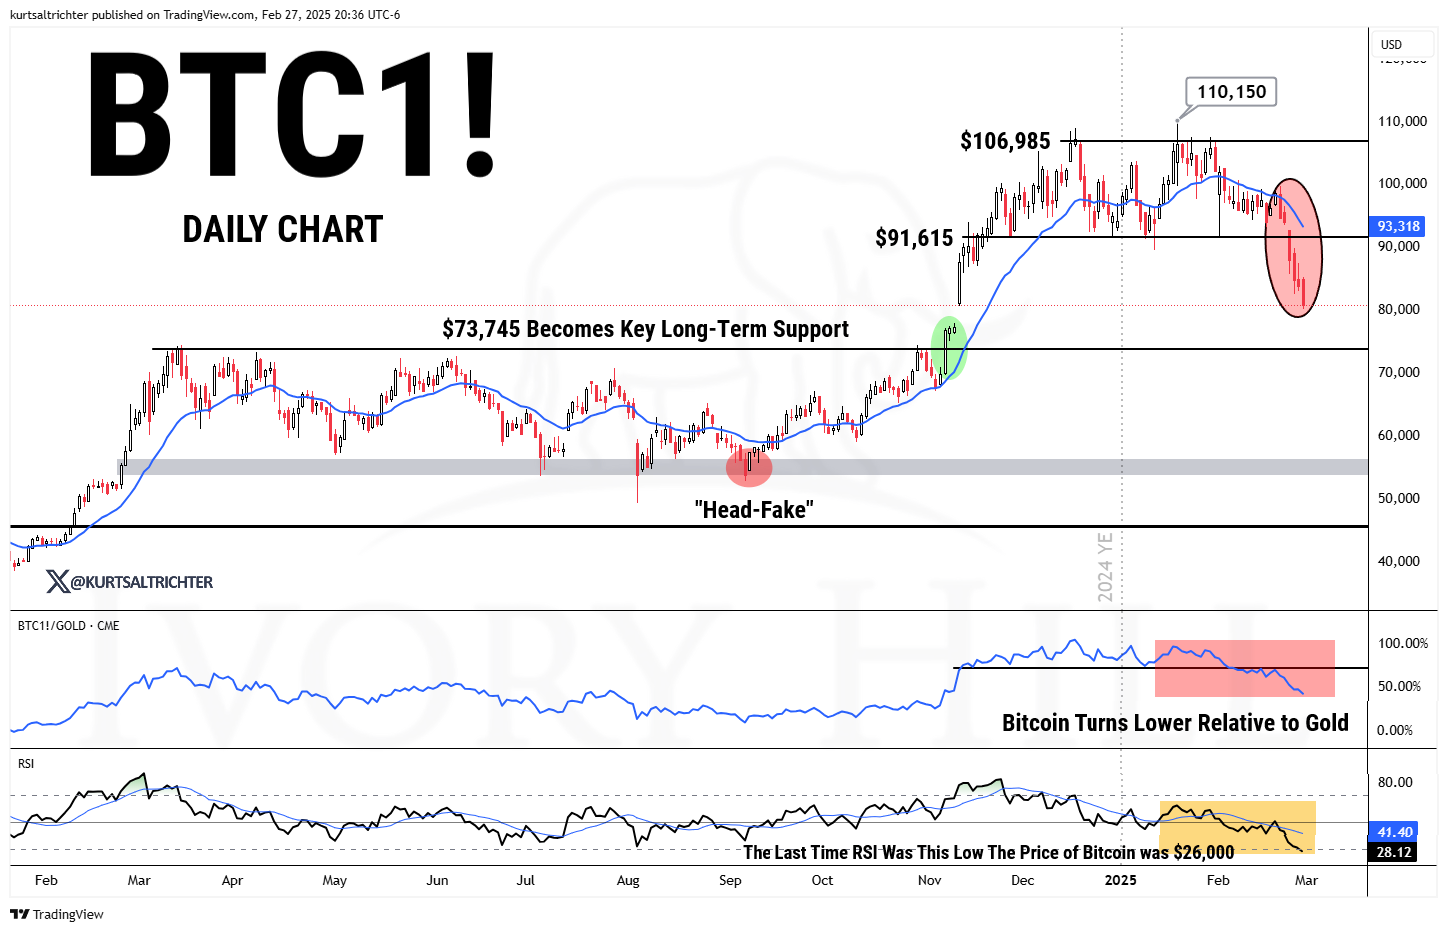
We closed our Bitcoin position after it broke below the key $91,615 support level. It's now down nearly 30% from all-time highs. That said, Bitcoin remains at the top of our watchlist—I still see strong potential for it to be a top performer, but strict risk management is essential in this asset class. Our focus is now on key support at $73,746.
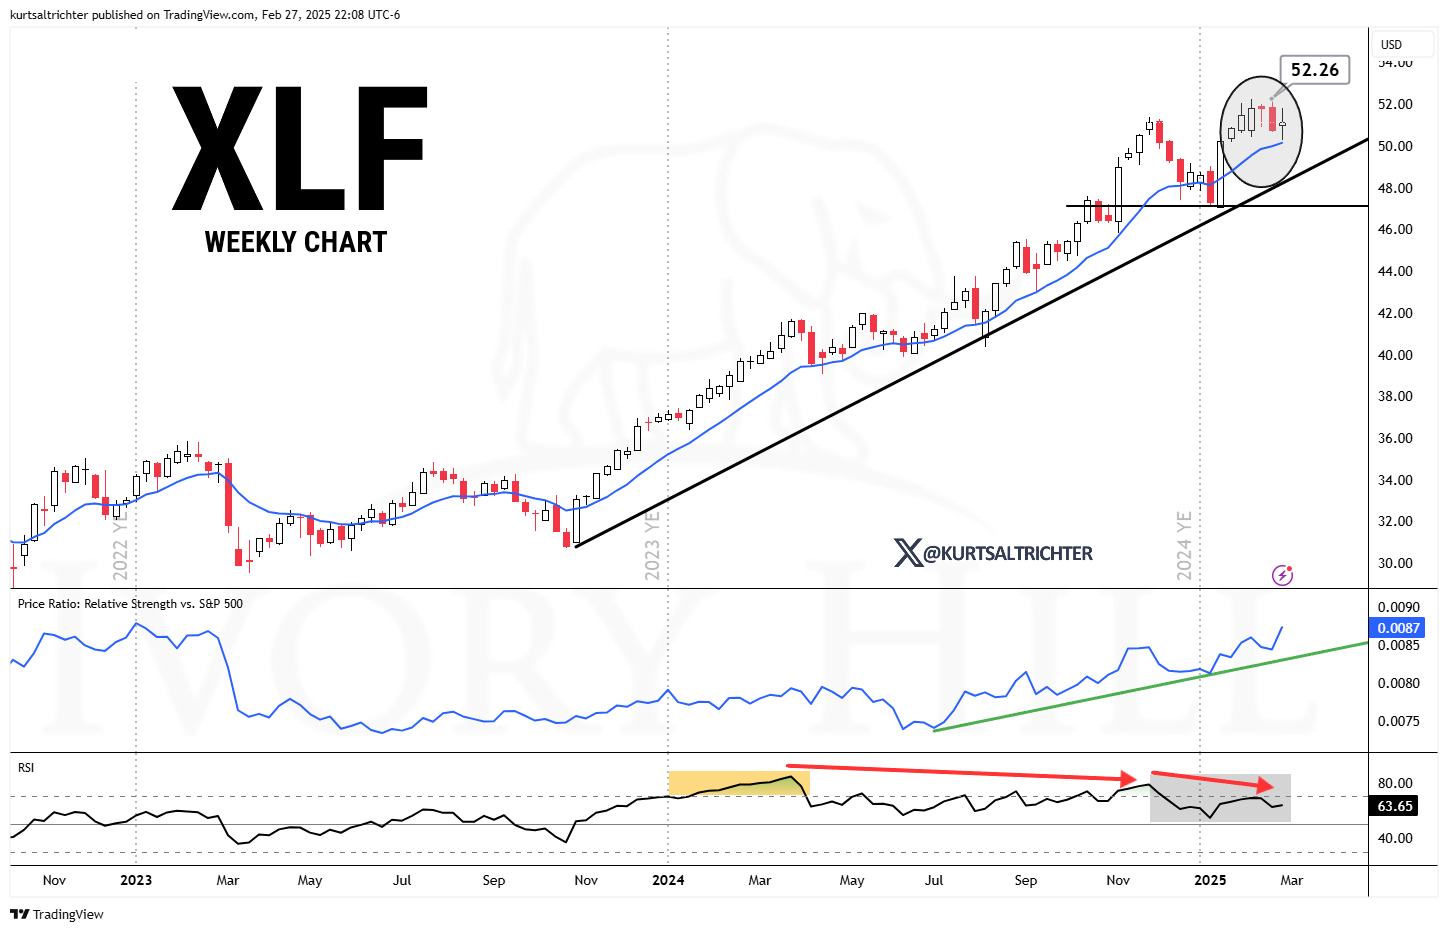
Financials (XLF) dropped 2.03% last week, forming a bearish outside-reversal on the weekly chart after an early-week breakout attempt failed. However, the ETF managed to hold above both its 2024 uptrend line and the 13-week moving average. The weekly RSI remains in bearish divergence but stays positive above 50, while its relative strength against the S&P 500 continues to trend upward.
The financial sector's performance is influenced by both interest rates and broader economic conditions. Recent data suggests challenges in housing, retail sales, and overall economic activity, which will likely weigh on future loan growth and profitability. While I still expect deregulation to provide a tailwind for the sector, underlying bearish pressures are beginning to build. We remain long XLF.
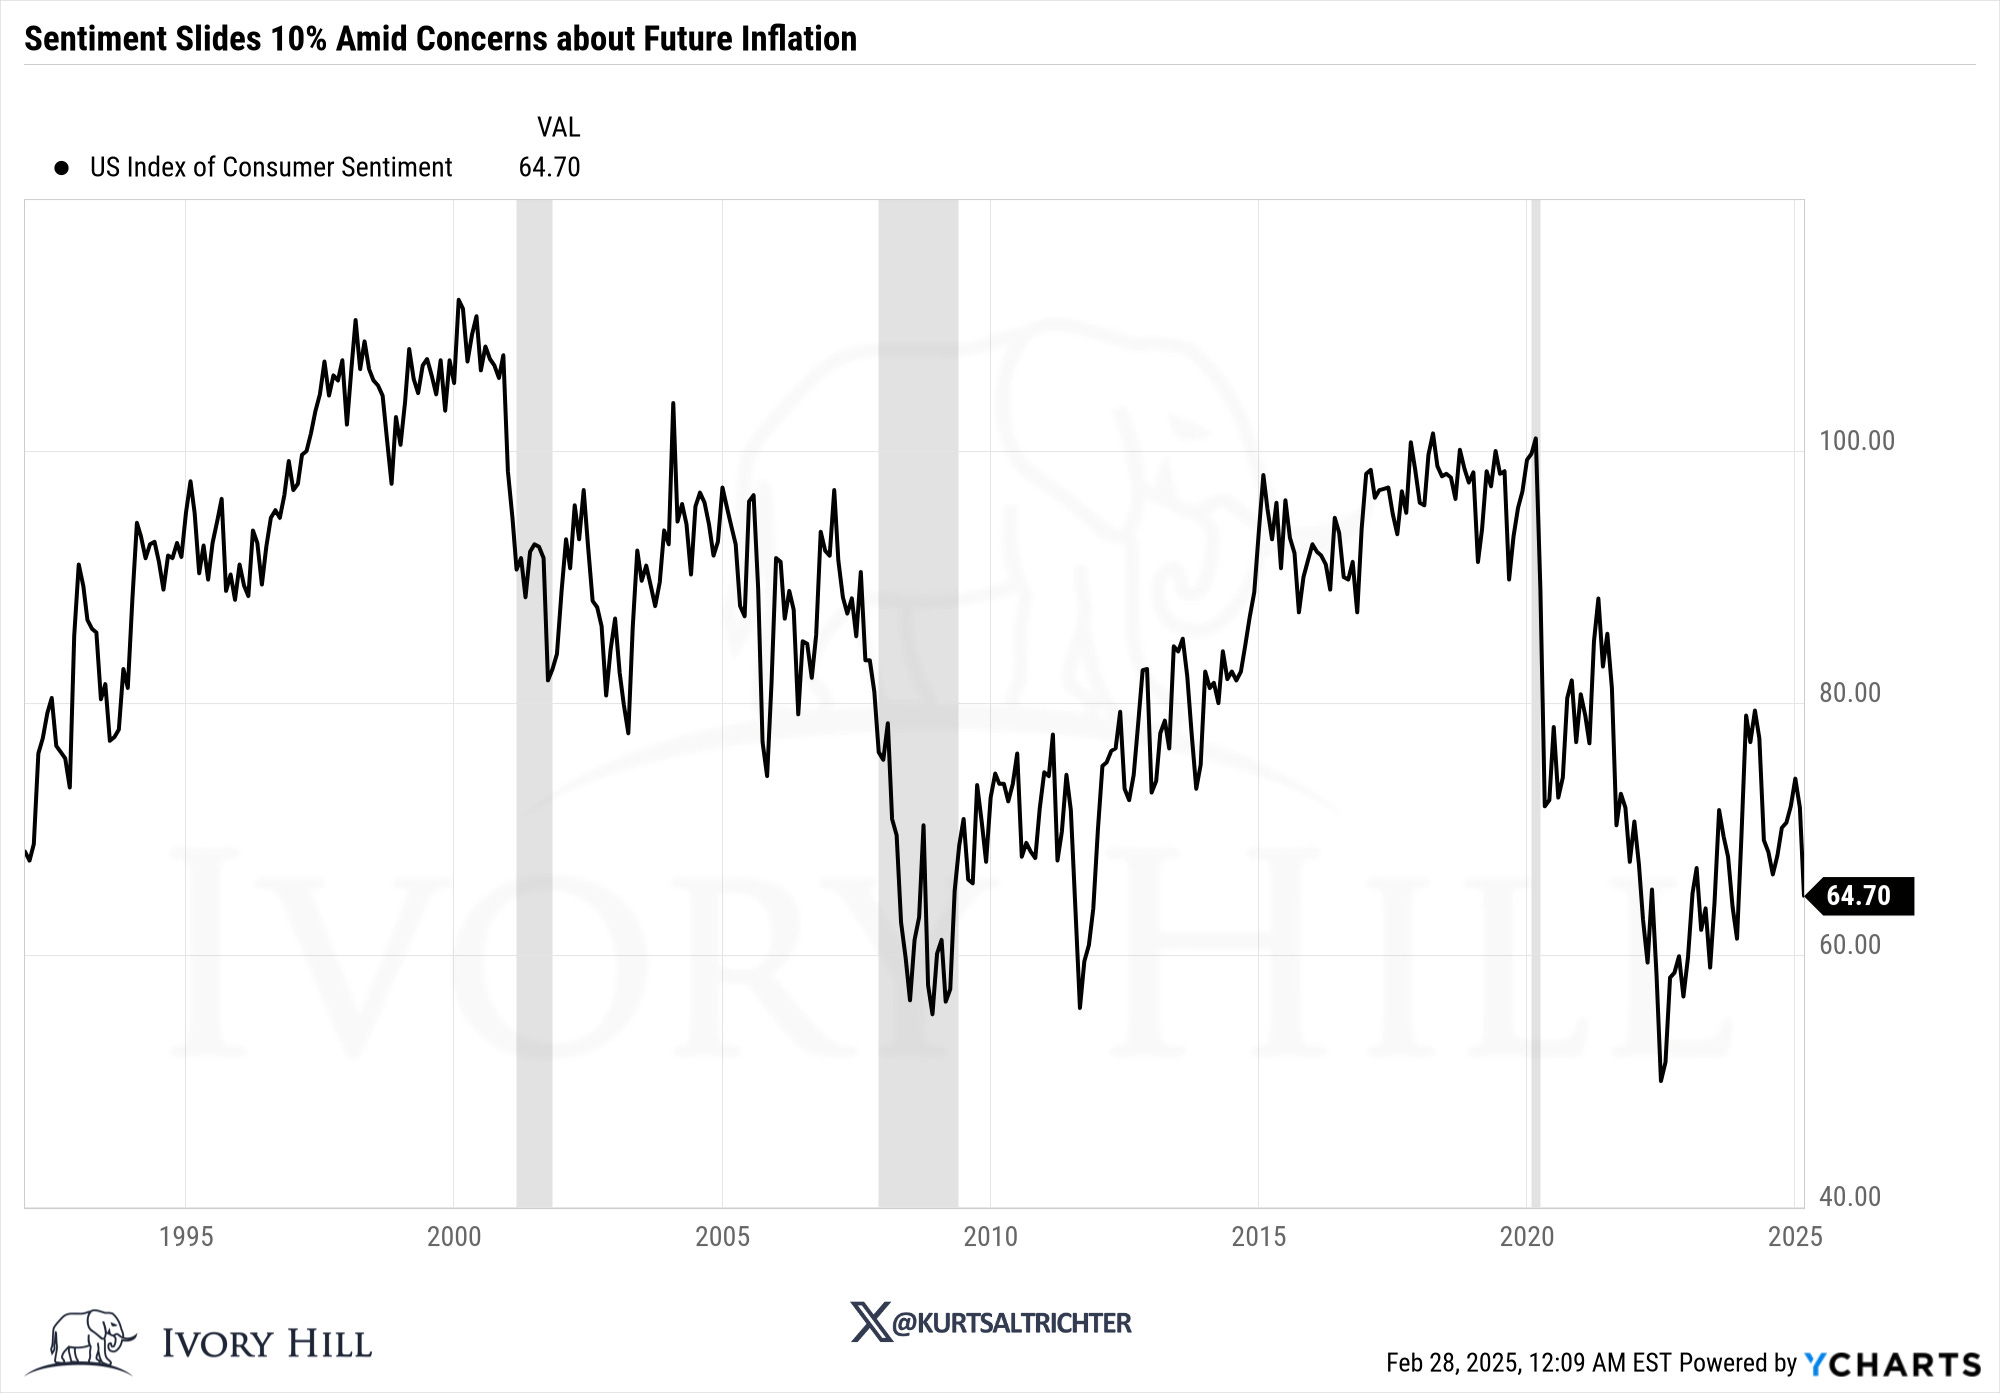
A Caveat to Recent Weak Consumer Sentiment Surveys
The sharp declines in consumer sentiment—University of Michigan's index dropping to 64.7 from 71.7 and the Conference Board’s confidence reading falling to 98.3 from 105.3—have fueled concerns that a pullback in consumer spending is imminent. Given that consumer spending drives U.S. economic growth, these sentiment surveys typically warrant attention. However, the current data should be taken with caution, as political polarization is distorting results.

Sentiment swings are now increasingly tied to political affiliation rather than economic fundamentals. The February Michigan survey revealed a deep divide: Democrats' economic outlook fell from 92.1 to 64.1 (-28 points), while Republicans' surged from 52.1 to 84.9 (+32.8 points). If responses were evenly weighted, sentiment would have risen, not declined. Inflation expectations followed a similar pattern—Republicans saw almost no increase, while Democrats projected a sharp jump. These dynamics suggest consumer sentiment surveys are less predictive than in the past.
For market positioning, this means focusing on “hard” economic data—retail sales, durable goods orders, jobless claims, ISM PMIs, and employment reports. As long as those indicators remain stable, the soft landing narrative holds (for now).
Inflation
I expect the March 12th CPI report to print colder than expected, likely in the 2.80-2.97% YoY range, followed by another cold print in April. However, inflation is set to reaccelerate into May and June, catching both the market and the Federal Reserve off guard. Right now, no one is paying attention to this setup, but the whipsaw effect from CPI swings will force a shift in the prevailing narrative, creating volatility and potential Fed policy missteps.
If the March CPI report comes in cold as I expect, the net effect on the macroeconomic setup should shift into a Goldilocks regime—low inflation with stable growth—which is historically favorable for high-beta stocks. Given the current market sentiment, this take will be met with skepticism, but the data is what it is. Market narratives are often slow to adjust, but if inflation cools as projected, the conditions will be in place for a risk-on environment until May.
Lessons From Past Recessions - Four Technical Indicators to Watch
As I've been pointing out for some time now, this market has an 85% correlation with the summer of 2007. After analyzing the strongest correlations, I've narrowed it down to four key technical indicators that are critical to watch closely.
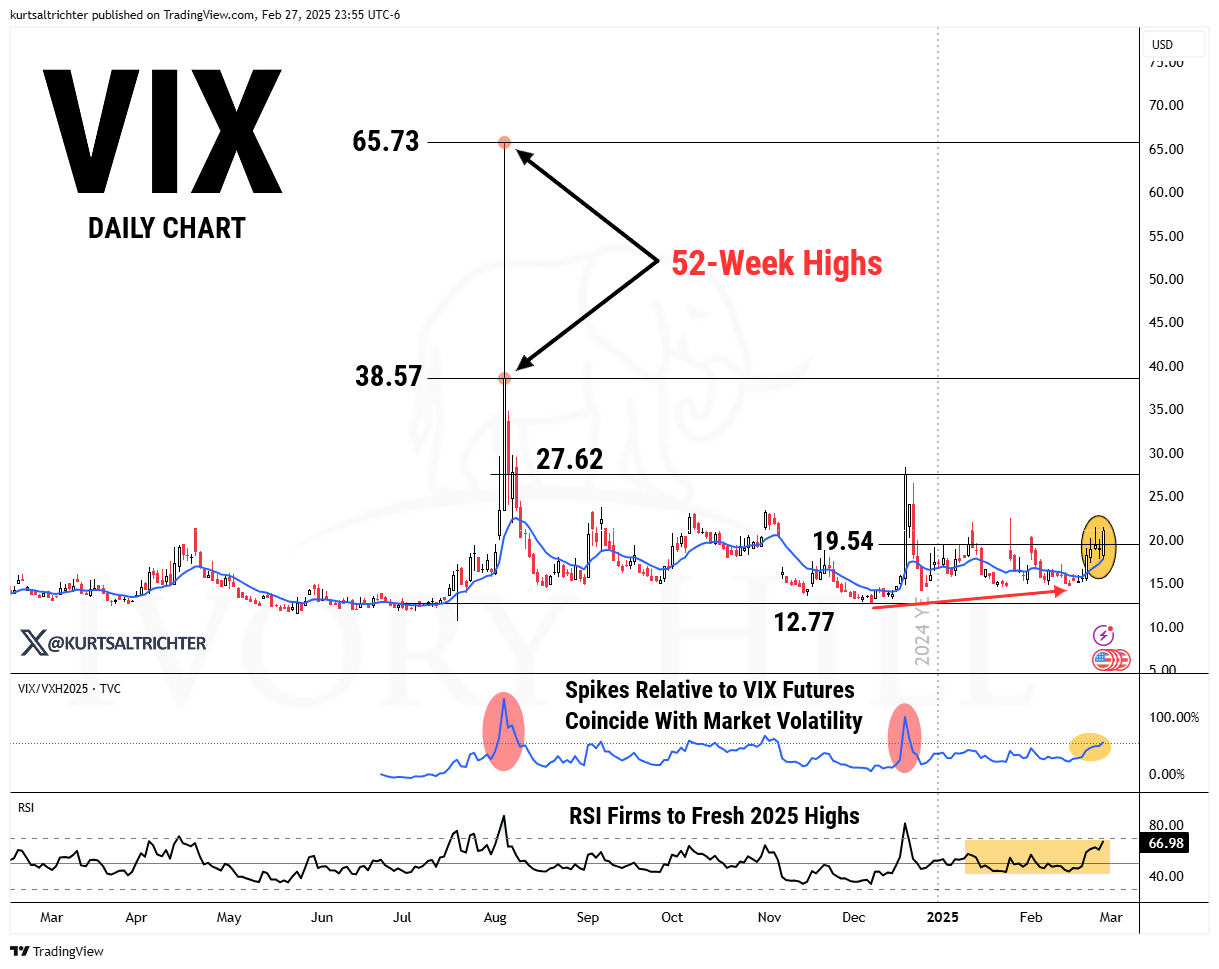
The VIX
During late-cycle phases, the VIX typically stays low, forming a pattern of lower highs as investor complacency sets in, with a growing number of short-volatility trades in response to resilient equity markets. Notably, each recent recessionary bear market has been preceded by the VIX reaching a 52-week high.
Recession Signal Triggered August 2nd, 2024
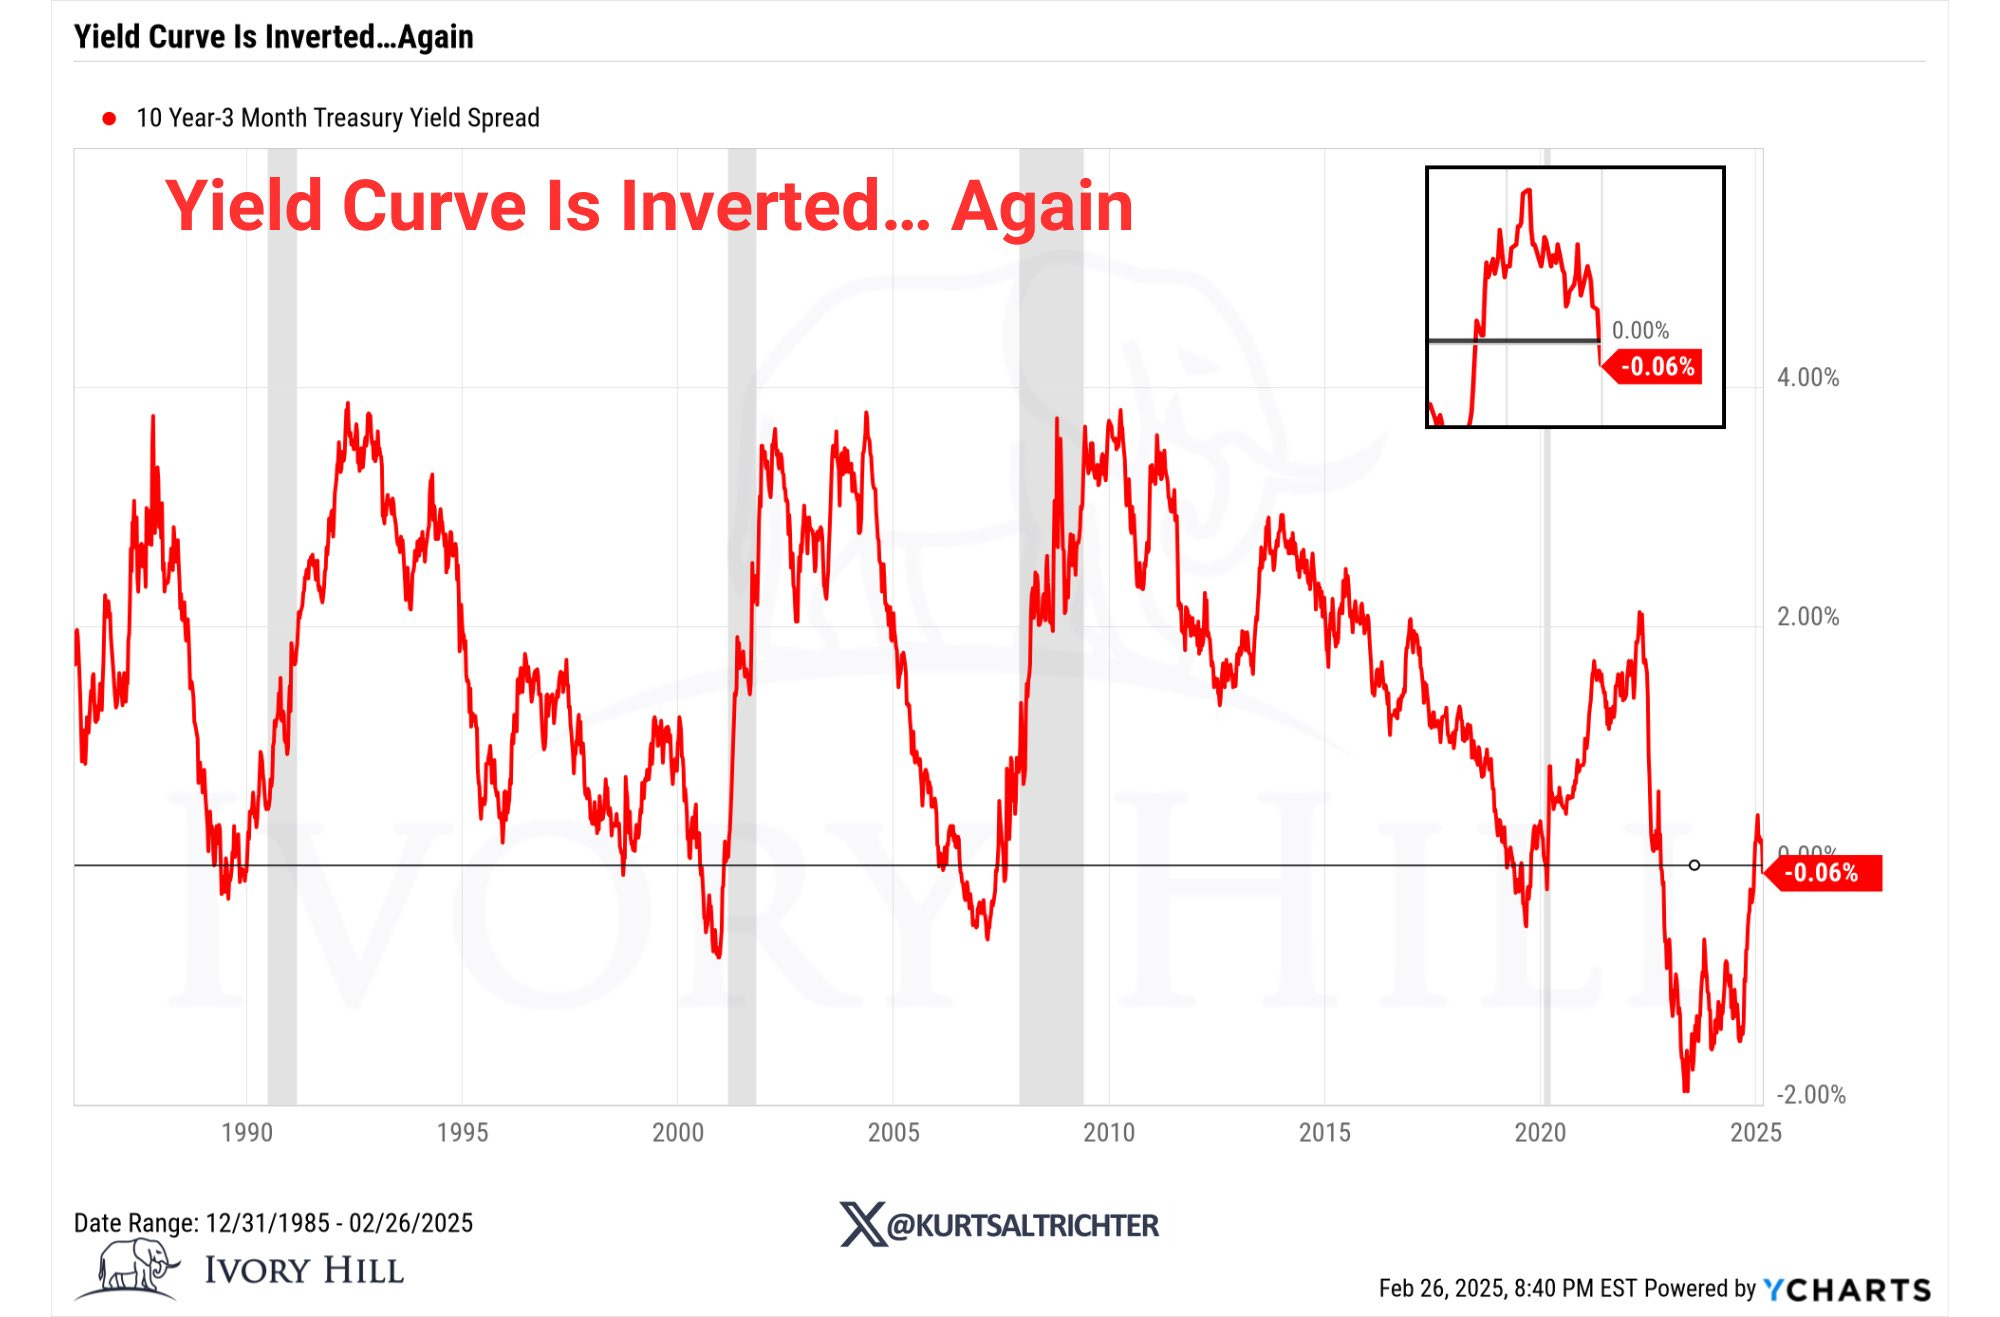
The Yield Curve
An inverted yield curve during an equity bull market should not be overlooked, but it’s also not an immediate reason to sell, as significant cyclical bull market gains often happen during these inversions. The key recession signal to focus on is rapid bull steepening in the 10Y-3M spread.
No recession signal triggered.
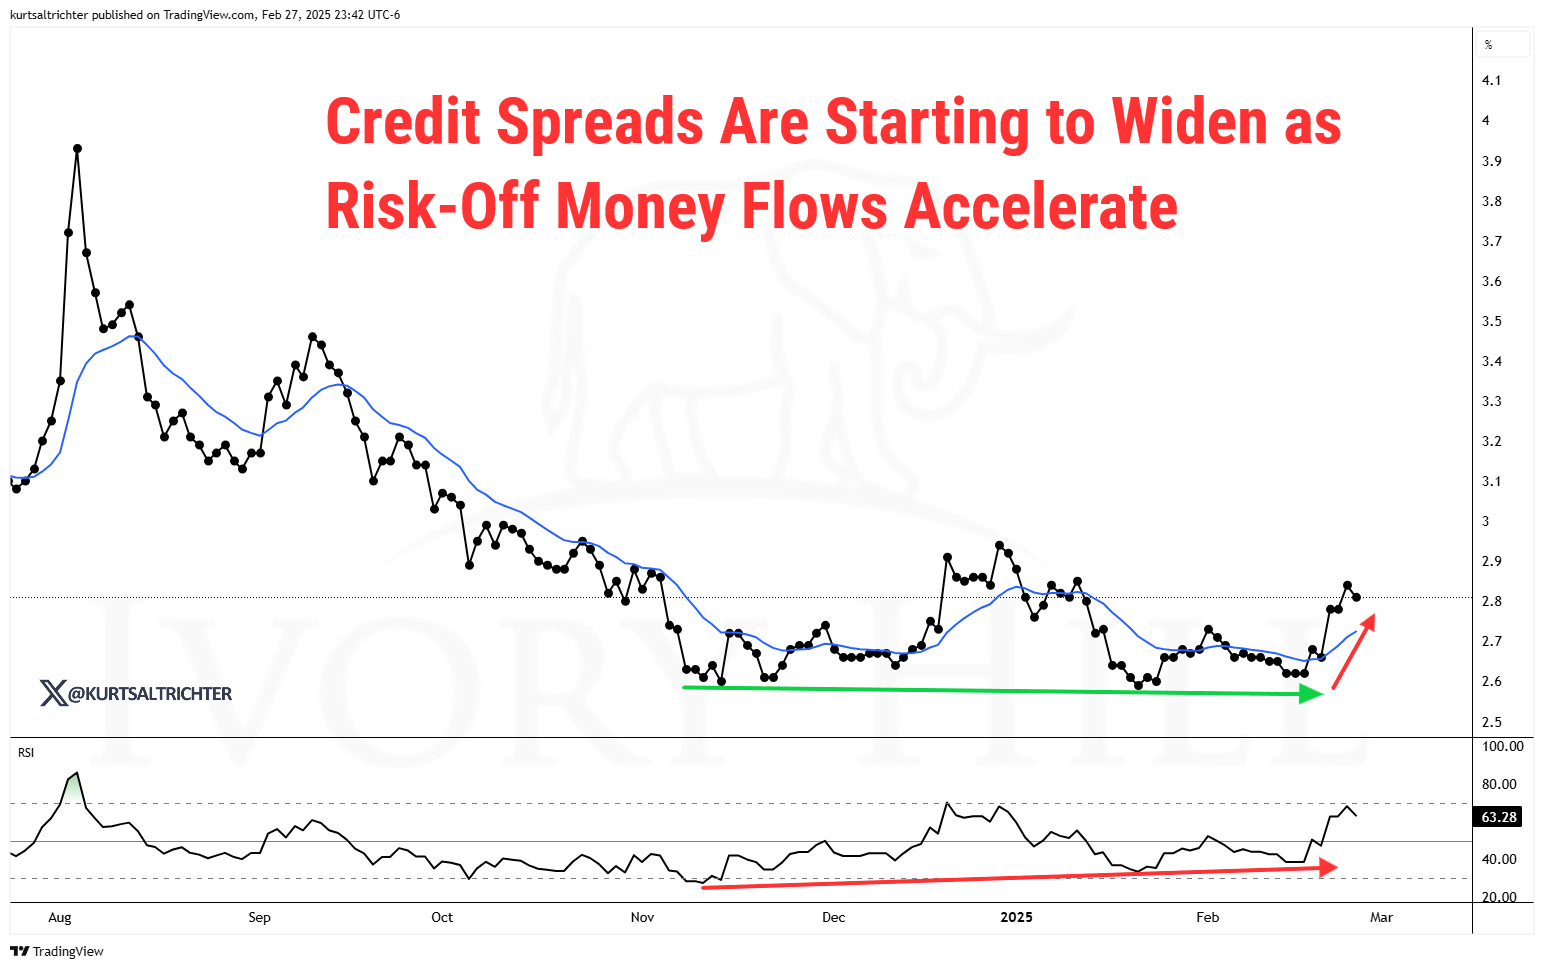
Credit Spreads
Historically, credit spreads have been a valuable indicator for equity investors, as tightening often reflects strong risk-on flows into stocks and high-yield corporate bonds. However, a sharp widening to 52-week highs in credit spreads serves as a key warning sign of a potential recession.
Recession Signal Potentially in Progress
S&P 500 Price Pattern
The S&P 500’s price movements can provide valuable insights into whether the market is approaching a cycle peak. As the last "domino to fall," a pullback in the index, followed by an unsuccessful attempt to reclaim recently set record highs, often signals a recessionary pattern seen at market tops.
Recession Signal Potentially in Progress

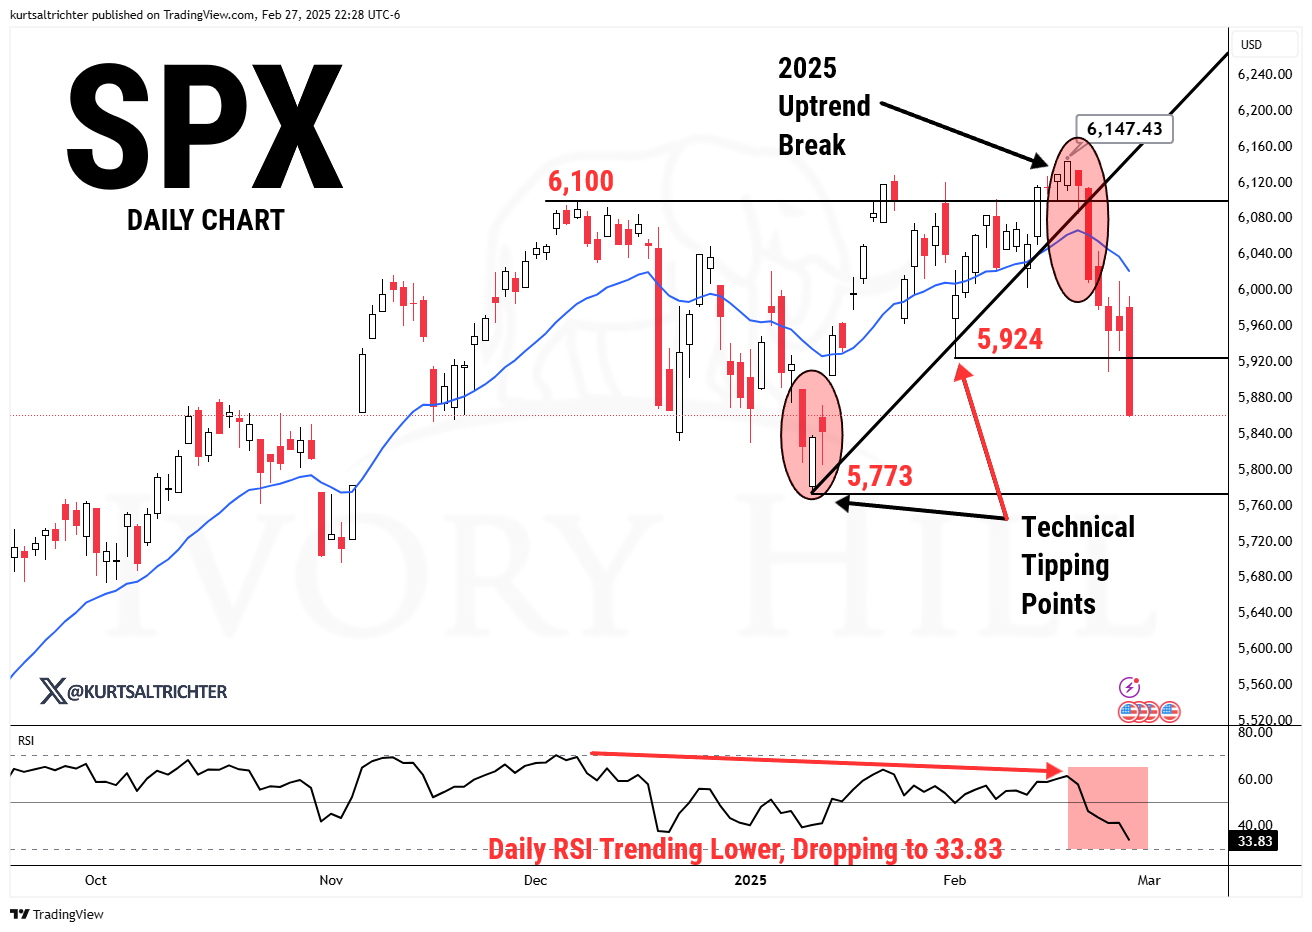
This week, SPX broke through the key 5,924 support level, shifting attention to the next major support at 5,773 in the days ahead.
And remember - The one fact pertaining to all conditions is that they will change.
Feel free to use me as a sounding board.
Best regards,
-Kurt
Schedule a call with me by clicking HERE
Kurt S. Altrichter, CRPS®
Fiduciary Advisor | President
Email: kurt@ivoryhill.com | ivoryhill.com