Santa Rally on the Horizon—But Watch for Tape Bombs
The year-end market cheer could face sudden shocks.
CLIENT REMINDER:
If you haven’t already, please schedule your Q4 meeting (click here)
2025 - Important Numbers PDF Download.
This quick reference guide covers the most critical annual limits and figures commonly referred to during the year.
The Ivory Hill RiskSIGNAL™ has remained green since December 5, 2023. Our long-term signal is strong, and the trend is firmly up. Our short-term and intermediate-term volatility signals are green, so we favor higher beta equities over lower beta.
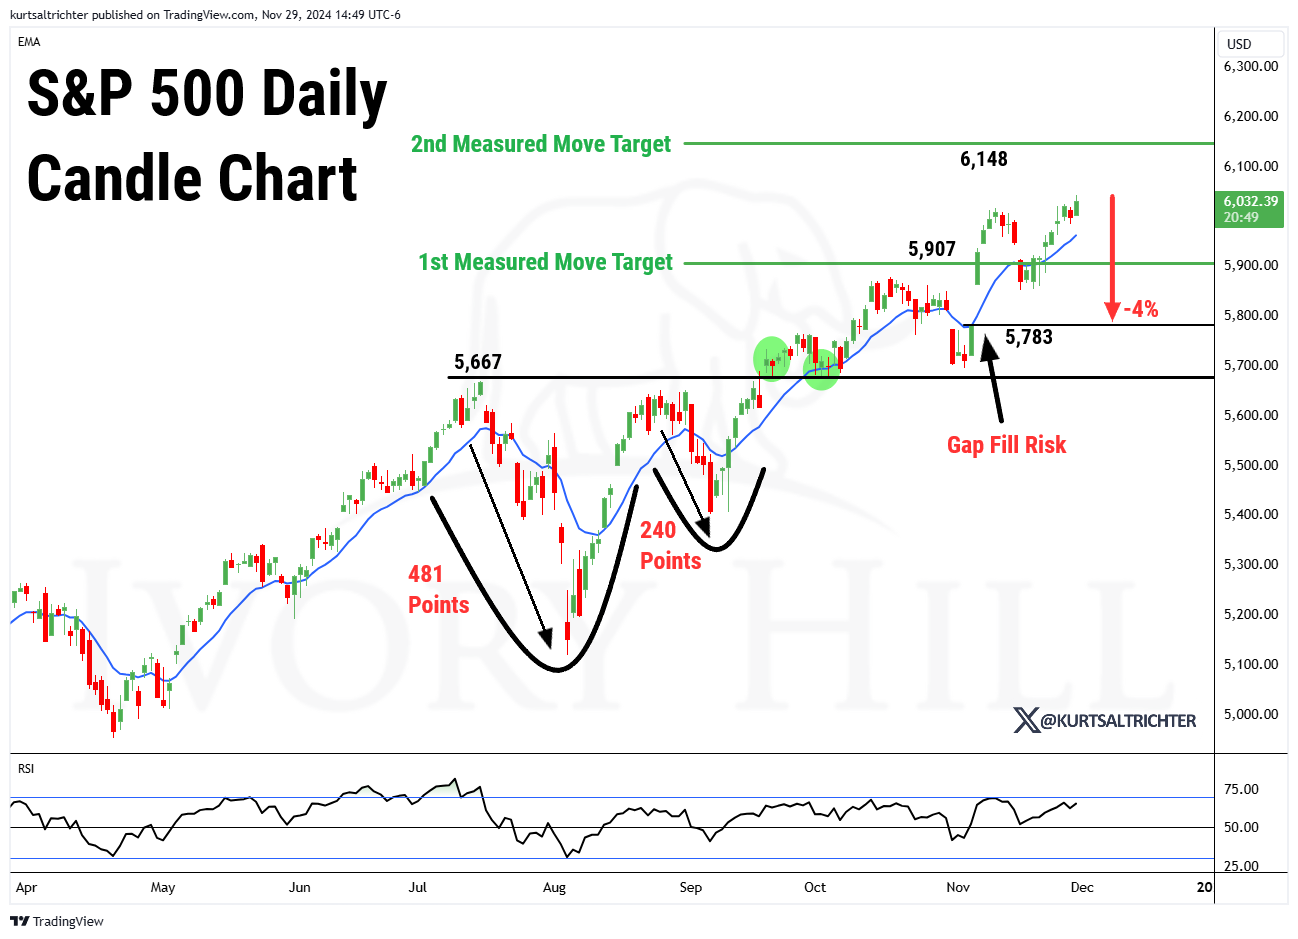
On September 23rd, I posted our new S&P 500 measured move targets of 5,907 and 6,148, and on Friday, the S&P 500 closed at 6,032.39, locking in a new all-time high, putting our second measured move target of 6,148 within reach. As noted on the chart below, we have a downside gap risk at 5,783, which is roughly a 4% downside move from Friday’s close.
Investors will need to adjust to President-elect Trump's frequent policy announcements or political “tape bombs.”—most recently, the proposed 25% tariffs on Mexico and Canada. However, unless the market begins to believe these unconventional or disruptive policies will actually take effect, they are more likely to cause short-term volatility rather than disrupt the ongoing rally.
Looking ahead, the outlook for a continued year-end "Santa rally" remains optimistic. Economic growth appears stable, a soft landing (based on data) seems achievable, and inflation is not putting significant pressure on the Federal Reserve (yet). A potential rate cut in December could further support the markets. When combined with favorable seasonal trends—particularly in a year where markets have performed strongly—there's a solid chance that equities could grind higher through year-end, despite these lofty valuations.
As 2025 approaches, market dynamics will shift as some of Trump's headline-grabbing policies start to materialize. Attention is likely to pivot toward key issues such as bond yields, tax reform, remaining rate cuts, trade negotiations, and economic growth. For now, though, these concerns are seen as challenges for the future, and the path for near-term market gains through the end of the year appears relatively unobstructed.
The Macro
Before the election, the market anticipated stagflation, characterized by slowing growth and rising inflation. Post-election, the narrative has oscillated between stagflation and reflation, where both economic growth and inflation accelerate. In response to this evolving macro environment, in October, we reallocated our portfolios by divesting from gold and utilities, increasing exposure to Bitcoin, and broadening our exposure in the Nasdaq and S&P 500.
If economic data confirms accelerating growth, we could experience a "Santa Claus rally" into year-end, potentially benefiting small-cap stocks, profitless tech companies, Bitcoin, and other cryptocurrencies. Historically, the S&P 500 has posted an average gain of 1.3% during the last five trading days of December and the first two trading days of January.
Inflation
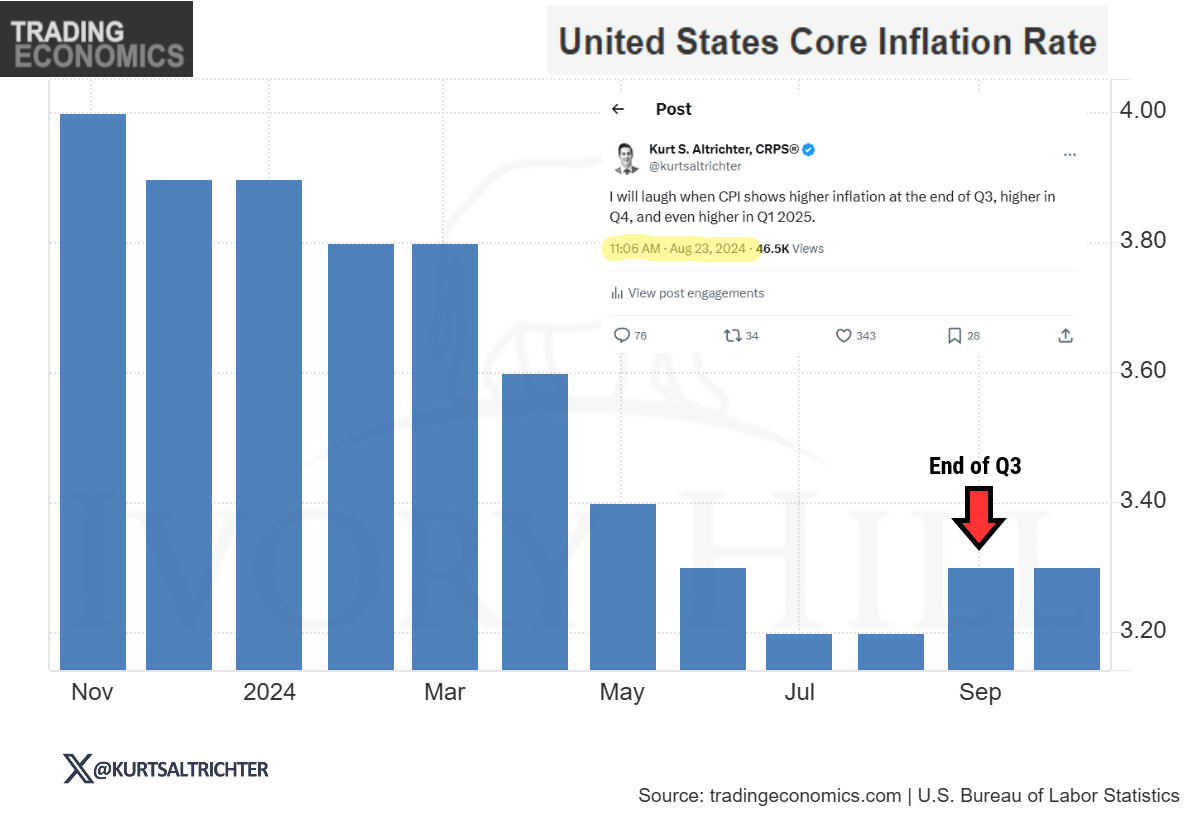
As I’ve emphasized throughout the year, I anticipated inflation would pick up again heading into the year's end, beginning around the close of Q3—and that’s exactly what we’re seeing unfold now.
Looking ahead, I anticipate inflation will rise slightly to approximately 2.80% year-over-year in November, with a continued acceleration toward 3% during Q1 2025, assuming current conditions remain intact.
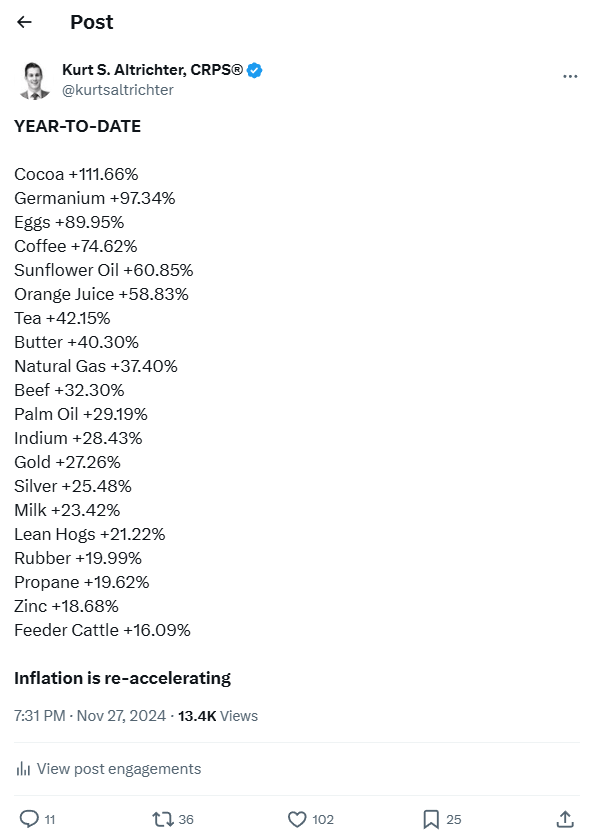
Why did I anticipate inflation would accelerate? Because the factors driving prices have been rising throughout the year.
Monetary Policy
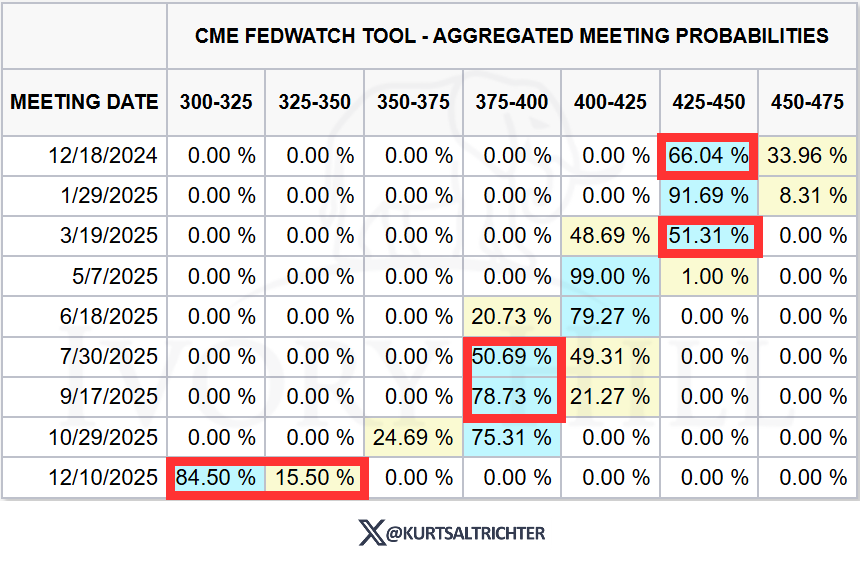
I believe the Federal Reserve is not overly concerned about the recent uptick in inflation and is likely to implement another 0.25% rate cut next month.
If inflation continues to accelerate, the Federal Reserve should consider pausing further rate cuts to evaluate economic conditions. Otherwise, they will be playing a very dangerous game. This pause is unlikely to disrupt the current market rally, provided the Fed maintains a stance supportive of future rate cuts. However, if the Fed signals a halt in rate cuts until inflation subsides, it could lead to a significant downward movement in equities.
It's important to note that while the current consensus anticipates a gradual reduction in rates, persistent inflationary pressures could prompt the Fed to adopt a more restrictive policy stance, including rate hikes in 2025. This scenario, though seemingly unlikely at present, remains a likely risk if inflation does not align with the Fed's 2% target.
Monitoring inflation trends and Fed speak will be crucial in assessing the trajectory of monetary policy.
Recent shifts in market expectations indicate a growing belief that the Federal Reserve may maintain elevated interest rates for an extended period. At the beginning of last week, markets had priced in a 99% probability of three rate cuts by the end of 2025; however, by week's end, that probability had decreased to 62%.
A prolonged "higher-for-longer" stance on interest rates can have significant economic implications. Sustained high rates tend to weaken economic growth by increasing borrowing costs for consumers and businesses, which can lead to reduced spending and investment. Over time, this restrictive monetary policy heightens the risk of an economic downturn or potential disruptions within the financial system.
The Bank of Japan is the Most Important Central Bank to Watch Right Now. Not the Fed.
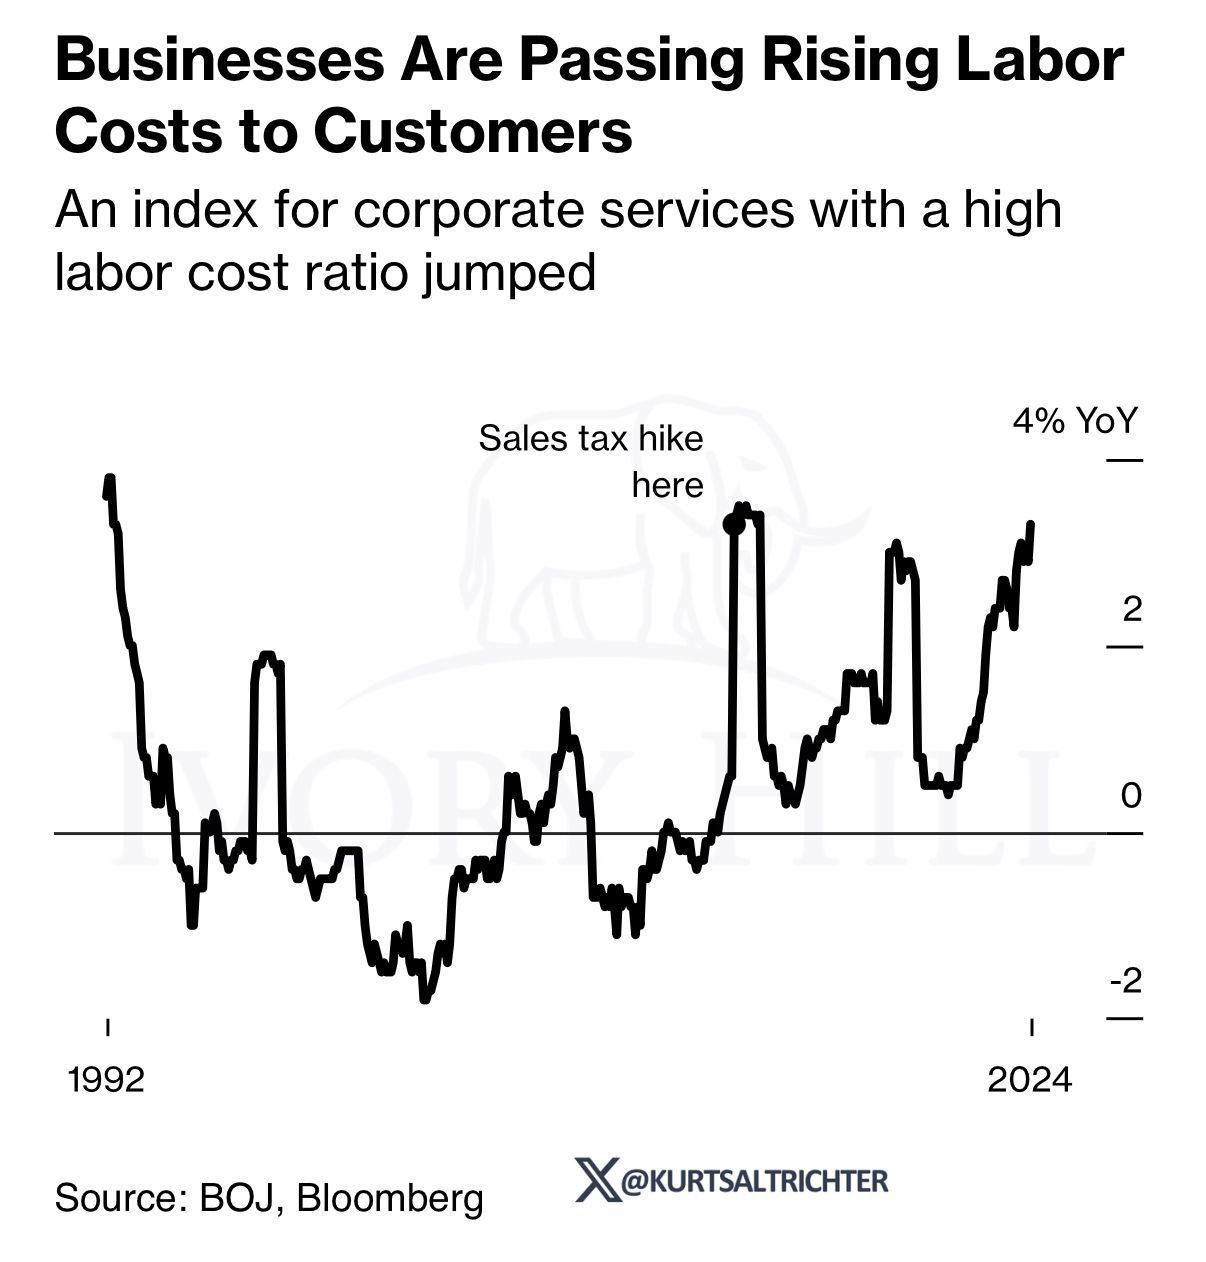
Recent economic data suggests the Bank of Japan (BOJ) is preparing to raise interest rates in December 2024. Tokyo's core consumer price index rose by 2.2% in November, exceeding the BOJ's 2% target and fueling market speculation of a rate hike.
For over a decade, Japan's low-interest-rate environment has been a significant source of leverage in global markets, mainly through the yen carry trade, where investors borrow yen at low rates to invest in higher-yielding assets abroad. An increase in Japanese interest rates could disrupt this game, leading to a repatriation of funds and increased volatility across global financial markets. This could potentially be the canary in the coal mine.
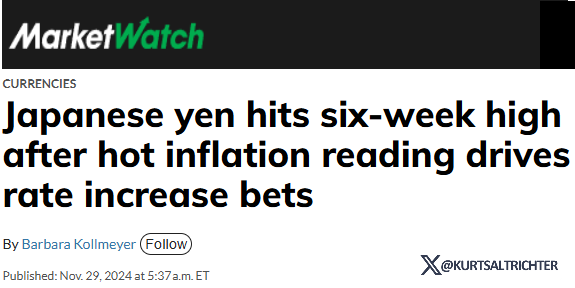
The yen has recently strengthened against the U.S. dollar, reaching a six-week high amid growing expectations of a BOJ rate hike.
This rise reflects shifting market sentiments and underscores the BOJ's influential role in the current global financial landscape.
While the Federal Reserve remains a crucial player, the BOJ's upcoming policy decisions are poised to have substantial implications for global markets. Investors should closely monitor Japan's monetary policy developments, as a rate hike could introduce significant volatility and influence investment strategies worldwide.
Credit Spreads
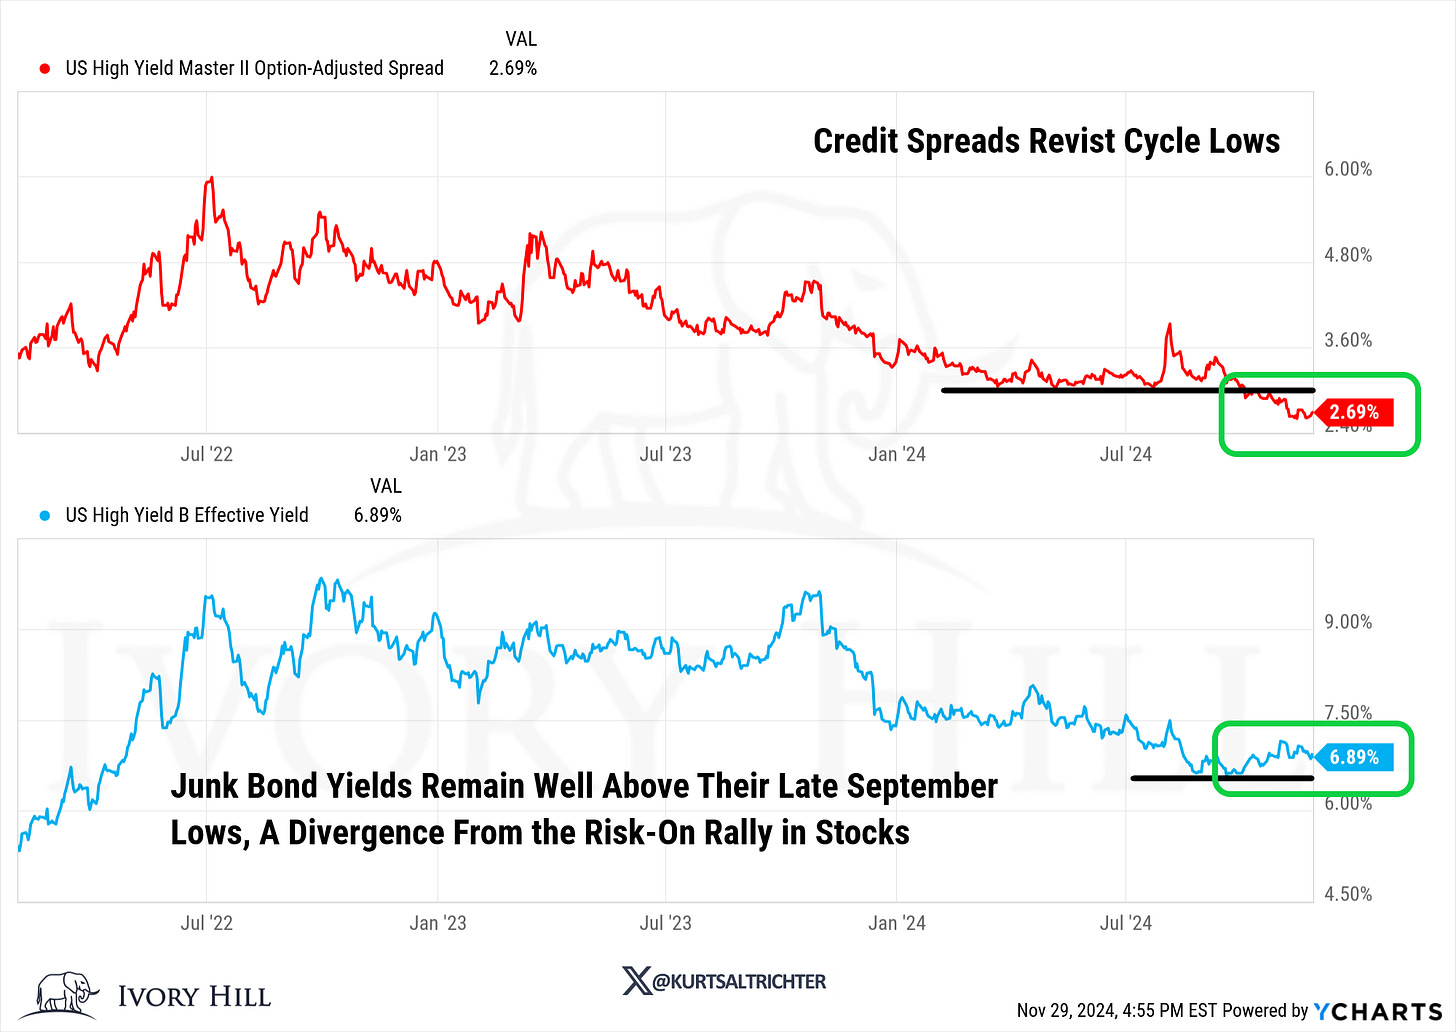
Credit spreads, which measure the yield difference between U.S. Treasury securities and below-investment-grade corporate bonds, recently narrowed to approximately 2.69% as of November 29, 2024. This compression suggests that bond investors are currently embracing higher risk levels.
However, yields on junk bonds have been gradually increasing since their lows in late September, diverging from the stock market's post-election surge to record highs. This trend indicates that seasoned corporate bond investors are not aggressively pursuing gains in the riskier segments of the bond market, unlike the enthusiasm observed in equities and alternative assets like cryptocurrencies.
A continued rise in junk bond yields could serve as an early indicator of potential selloff in stocks and other risk-sensitive assets, signaling a shift in market sentiment toward risk aversion.
Yield Curve
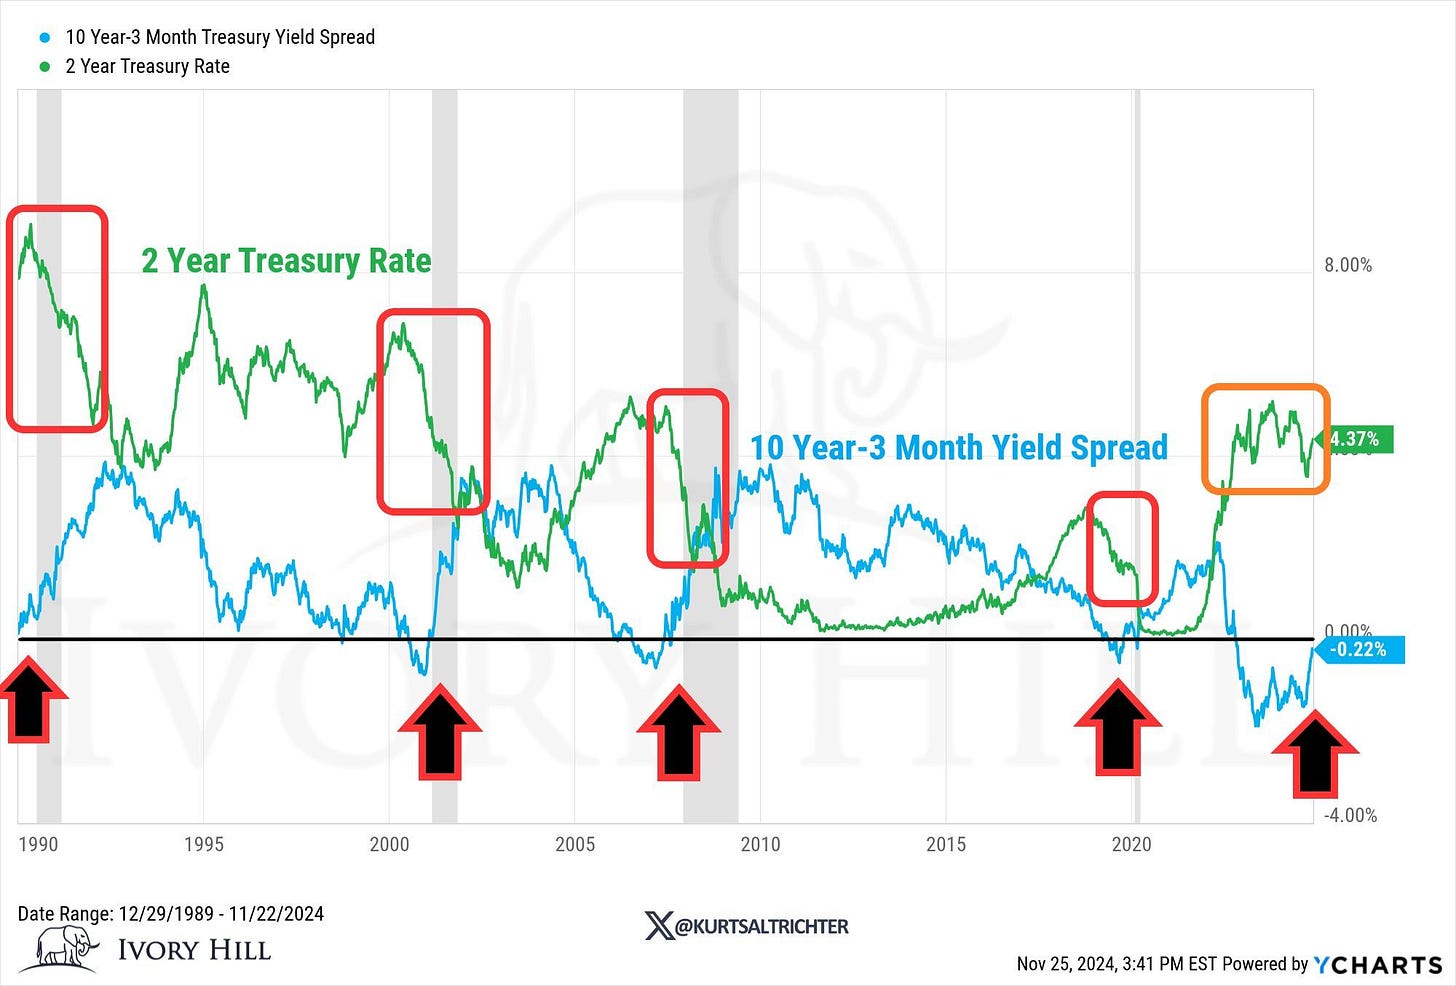
Monitoring the behavior of the 2-year Treasury yield in conjunction with the 10Y-3M spread provides us with important context. A significant decline in the 2-year yield correlates with a recession probability of 100%, as it indicates expectations of future rate cuts by the Federal Reserve in response to anticipated economic weakness.
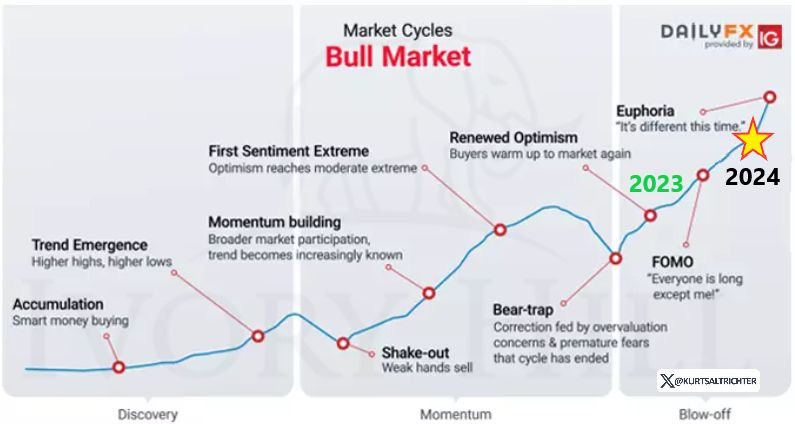
Where are we at in the market cycle?
The recent surge to record highs can be viewed as a case of irrational exuberance—a defining feature of the late stages of a bull market—rather than the rational optimism that underpins sustainable bull markets driven by a robust and expanding economic cycle.
#9. When all the experts and forecasts agree – something else is going to happen.
While the election results might suggest that this exuberance could persist for a few more years, especially given the current macro environment that shows no immediate signs of an impending recession.
That said, this is not a call for you to take out a second mortgage at 7% to buy crypto, even if fund flows seem to indicate such speculative behavior is rampant. In fact, with the stock market exhibiting record levels of enthusiasm and relentless chasing, if something were to break, now would be an opportune moment for it to happen.
Bull vs. Bear Case: Technical Analysis
The Bull Case: Drivers Supporting Continued Equity Market Gains
Upward Trend in the S&P 500
The daily and weekly charts reveal consistent higher-lows and higher-highs since the late 2023 market bottom, underscoring the enduring strength of the uptrend.Yield Curve Dynamics
Despite a lack of a clear bull-steepening trend, the bear-steepening and twisting patterns in the 10Y-2Y and 10Y-3M yield spreads suggest continued support for equity markets. Historically, bull markets do not end until shorter-duration yields outperform amid growth concerns.Tight Credit Spreads
Credit spreads remain near cyclical lows, indicating strong risk appetite among institutional investors. A notable widening in spreads is typically a precursor to lasting equity market tops.Volatility Normalization
The VIX, after a significant spike to multi-year highs in August, has returned to a normal contango slope. This shift reflects reduced caution and growing confidence among equity investors.
The Bear Case: Emerging Risks and Warning Signals
Inverted Yield Curve
The persistently inverted 10Y-3M yield curve could signal an impending cyclical downturn in equity markets if a cautious bull-steepening dynamic takes hold.Labor Market Deterioration
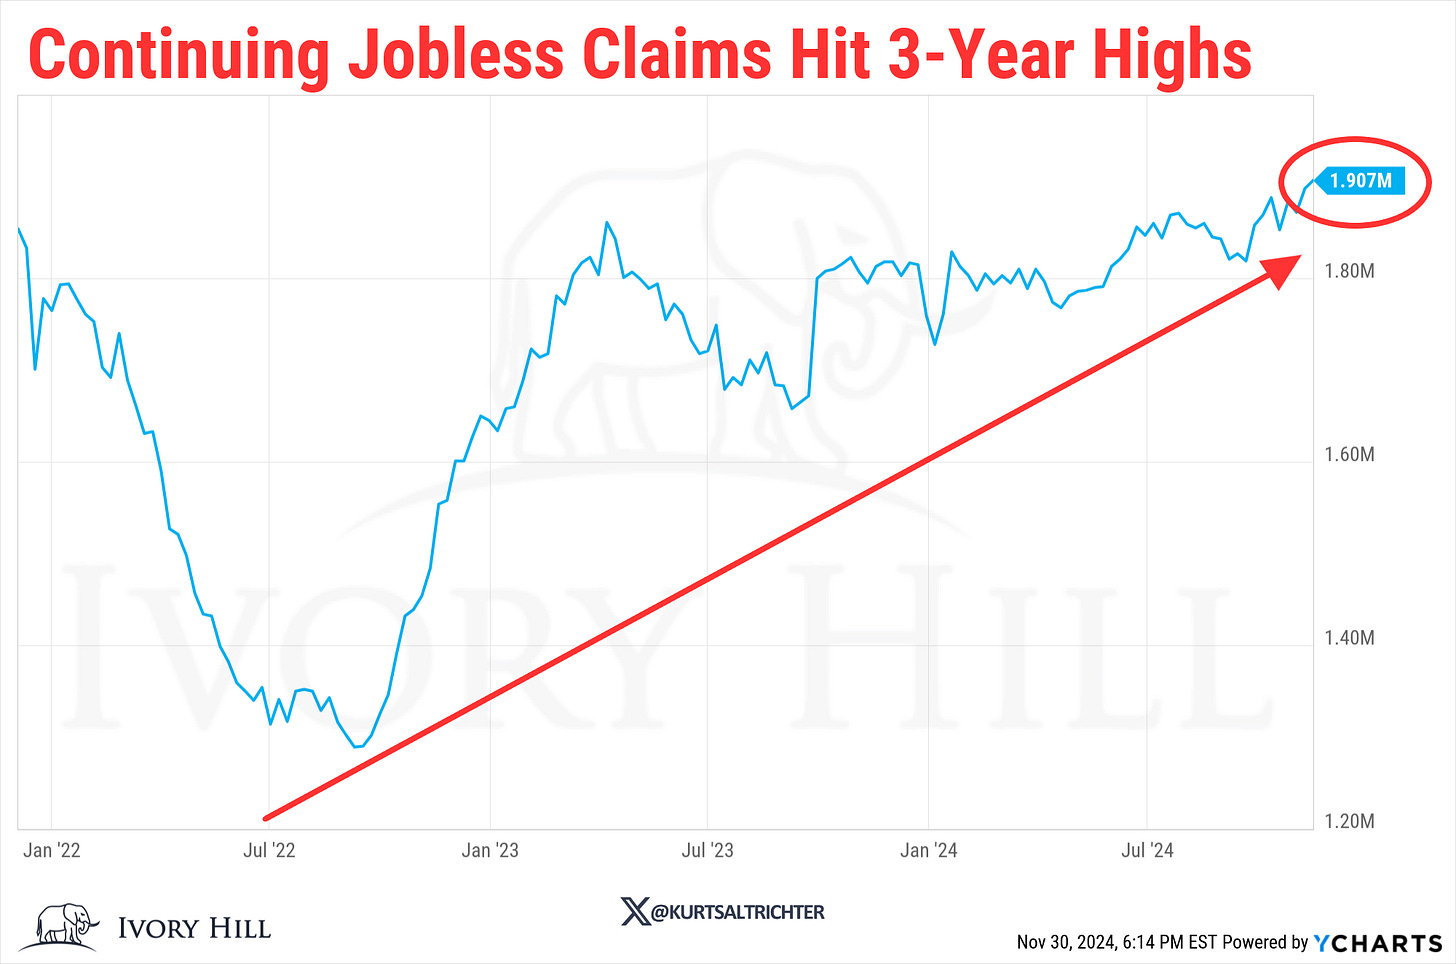
The implementation of the SAHM Recession Rule in September—a historically reliable predictor of recessions—indicates cracks in labor market strength consistent with economic downturns.Institutional Positioning
Movements in the VIX, SKEW, and Put/Call ratios suggest that institutional investors are reducing long equity exposure and potentially initiating short positions.Short-Volatility Risks
The re-emergence of weak-handed volatility sellers following the November VIX futures expiration raises the risk of another volatility squeeze similar to the events of August.Diverging Junk Bond Yields
Junk bond yields have begun to trend higher, diverging from the risk-on flows seen in equities, signaling potential caution among fixed-income investors.Fed Policy Shift
Hawkish Federal Reserve expectations coincide with signs of labor market softening, adding to downside risks.Real Interest Rates
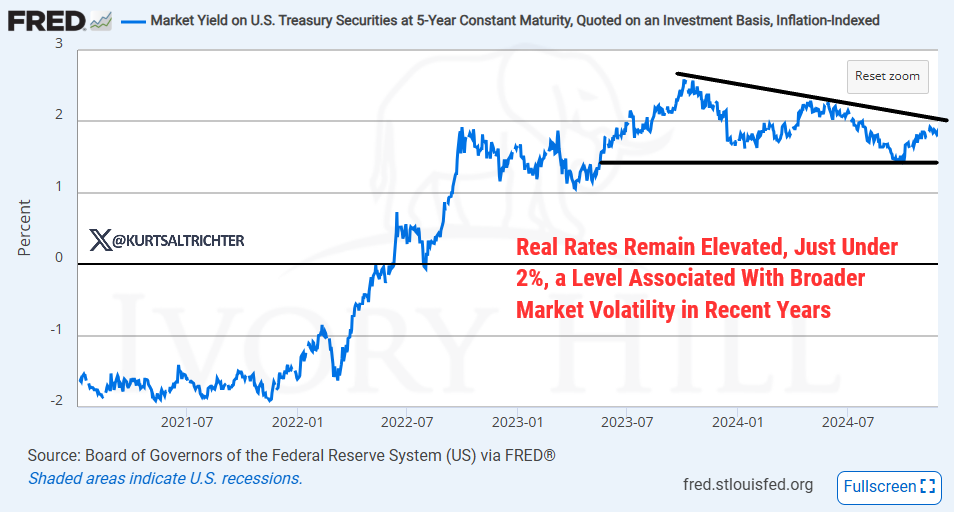
Real rates revisiting 2%—a threshold linked to economic stress—could pressure equities, as seen during the 2023 banking turmoil that everyone already forgot about.Weak Market Breadth
A declining percentage of stocks above their 50-, 100-, and 200-day moving averages on longer timeframes indicates deteriorating market breadth.Underperformance of High-Beta Sectors
High-risk sectors, including technology (XLK) and semiconductors (SOX), are underperforming the S&P 500, raising concerns about market leadership.Election Year Trends
Historical patterns suggest a potential sell-off, with the S&P 500 declining by double digits in prior election years featuring an inverted yield curve (2000, 2016).
Key Technical Levels to Watch on the S&P 500
Support Levels:
11/15/24 low close of 5,871 – A break here could shift short-term trends to neutral and heighten downside risks.
Pre-election low close of 5,705 – Breaching this level would confirm a lower-low on the daily chart, signaling a more pronounced market pullback.
Resistance Levels:
New record closing highs – Achieving this would affirm the bull market remains intact, albeit with persistent cyclical risks.
Conclusion
While the S&P 500 remains in a well-defined uptrend, the balance of technical indicators and cross-asset dynamics increasingly favor the bear case as we approach year-end. A failure to close at new highs next week could signal exhaustion in the uptrend, bringing key support levels into focus and raising the likelihood of a broader market pullback. Conversely, new highs would provide amnesty for bulls but would not eliminate the underlying risks tied to macroeconomic and market-specific factors.
For now, we plan on buying dips and staying fully invested unless our long-term signal flips red.
And remember - The one fact pertaining to all conditions is that they will change.
Feel free to use me as a sounding board.
Best regards,
-Kurt
Schedule a call with me by clicking HERE
Kurt S. Altrichter, CRPS®
Fiduciary Advisor | President
Email: kurt@ivoryhill.com | ivoryhill.com


