
Tactically Bullish, Structurally Nervous
Beneath the surface, divergences and volatility setups are stacking up.

We are still 100% invested after trend confirmation arrived in the final week of June.
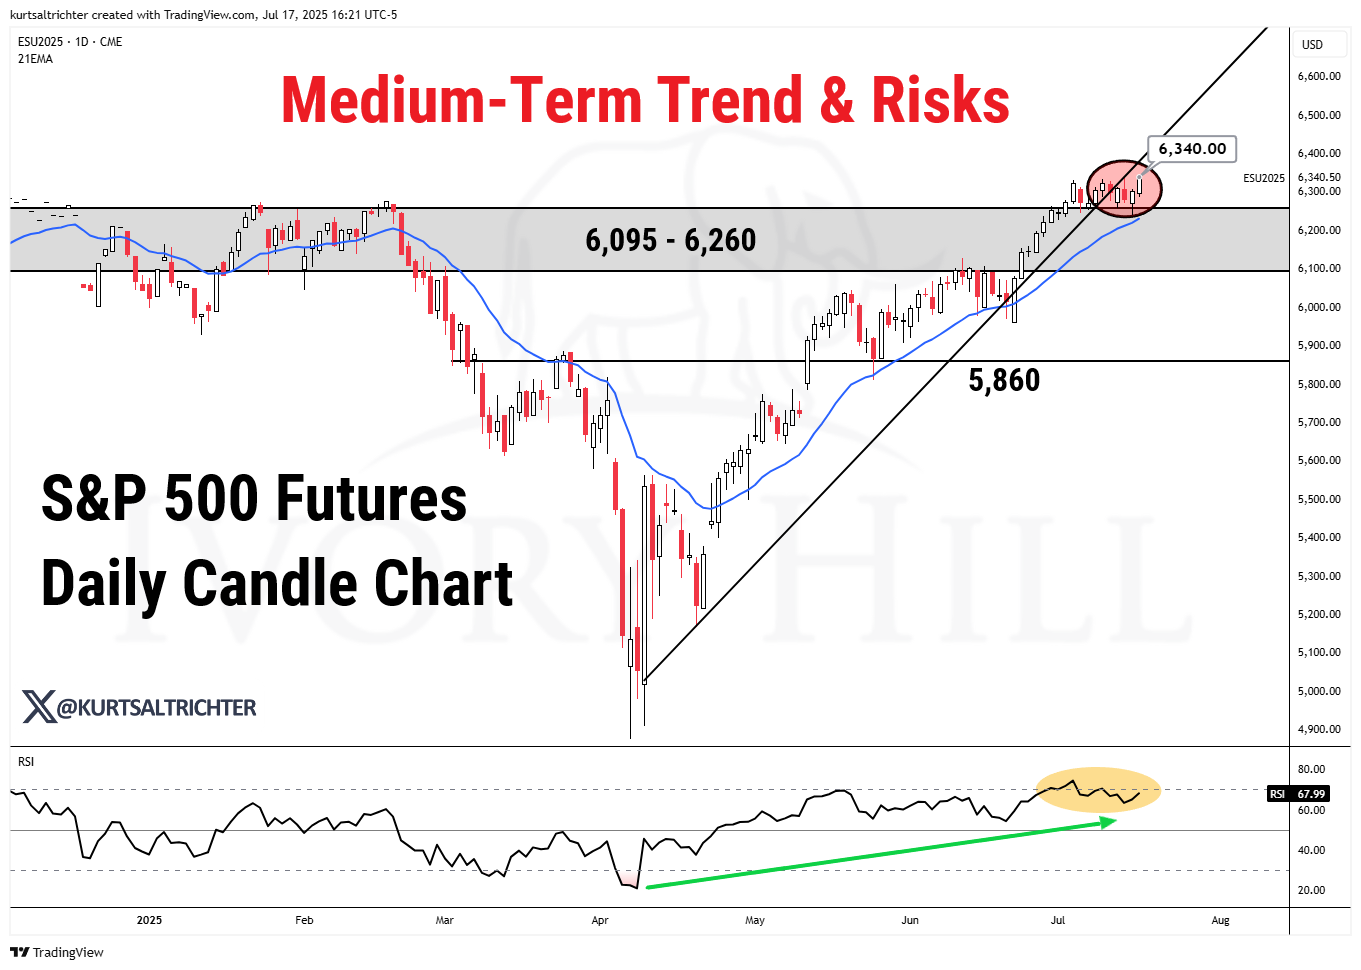
S&P 500 futures briefly pierced trend support last week, but bulls wasted no time stepping back in. Prices rebounded near the 21-day EMA and reclaimed the 6,300 level, but the bounce is far from convincing. Momentum, as shown by the RSI, remains in a bearish divergence, suggesting strength is fading under the surface. For this move to stick, 6,335 must flip to support. Otherwise, the door remains open for a retest of the 6,095–6,260 support band that held strong last time.
A lot of people called me crazy when I said on April 2nd that I still believed the S&P 500 would finish the year above 6,700. Fast forward, and we’re now just 6% away from that target.
The Trump tax bill should be a tailwind for cyclicals, and by extension, small caps. We’re starting to see some signs of that play out, but it hasn’t yet translated into a sustained outperformance trend. If corporate tax benefits begin to flow through meaningfully, small caps can finally take the lead.
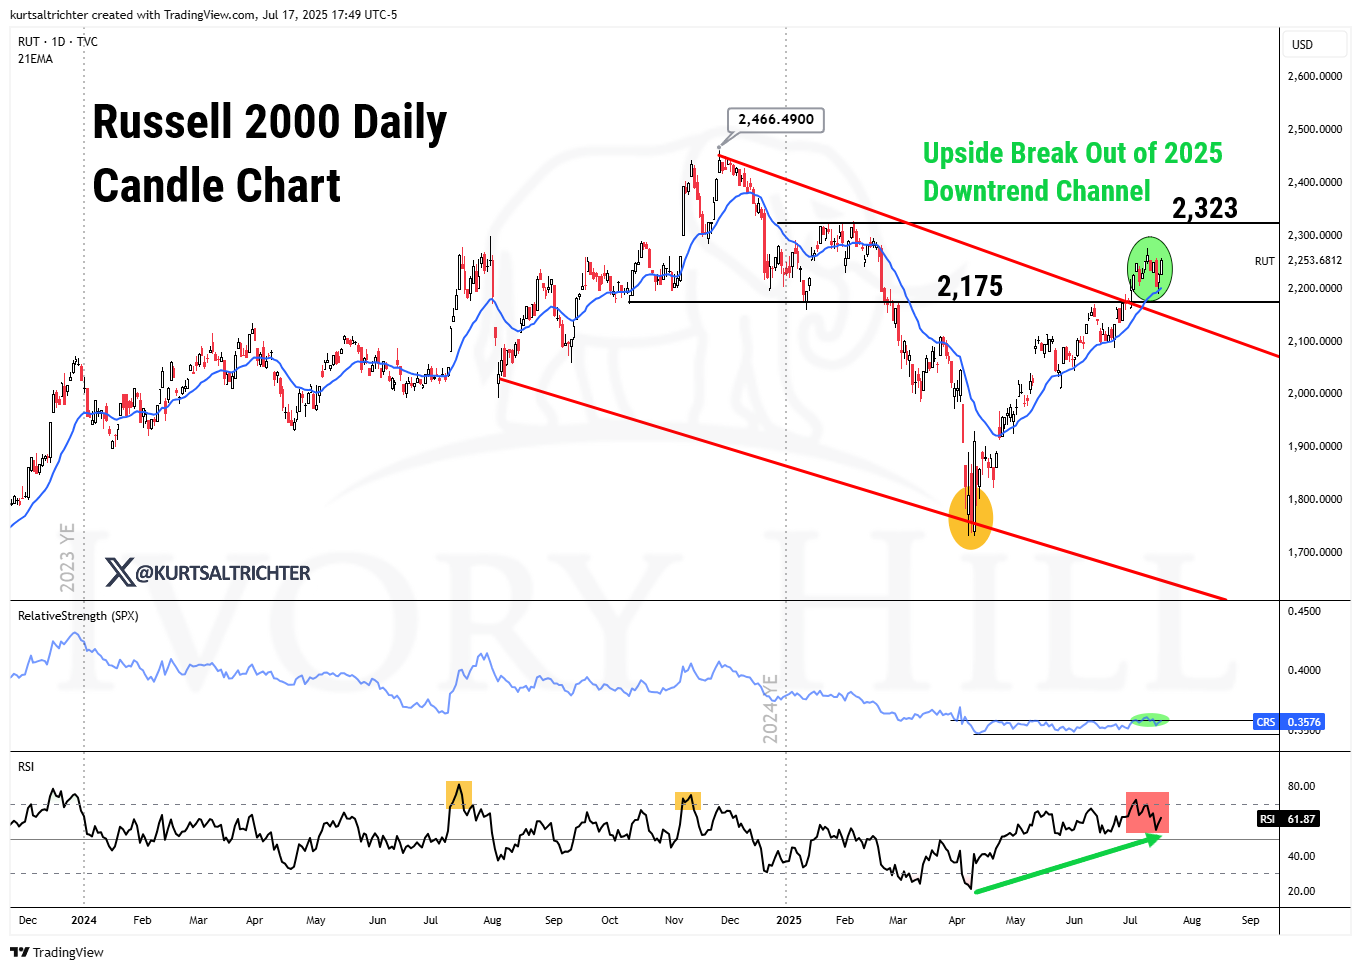
Technically, the Russell 2000 just broke out of its 2025 downtrend channel, reclaiming the 2,323 level. That’s an encouraging development, but it still lacks confirmation. Bearish RSI divergence and weak relative strength versus the S&P 500 remain red flags. Until we see fresh highs with improving momentum, this move still looks like a counter-trend rally inside a broader downtrend. That said, we’re positioned for the upside and have been long small caps via IWM and TNA.
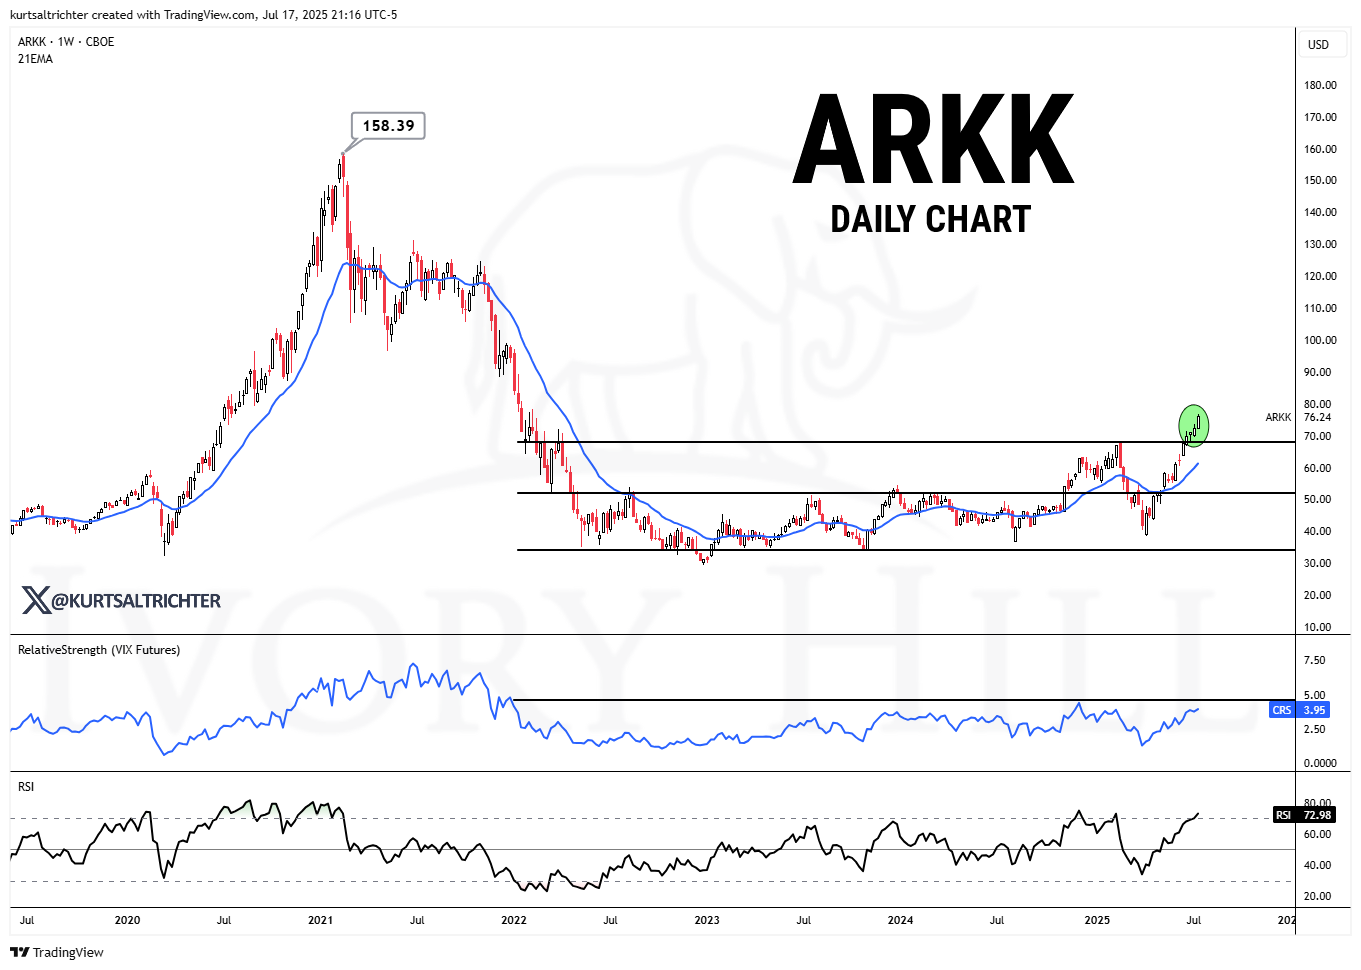
We also believe in the power of the deregulation narrative and expect rates to come down, whether through a political shake-up at the Fed or when Powell’s term ends in May 2026. Either path points to lower rates ahead, and when paired with deregulation, that’s a bullish cocktail for small- and mid-cap stocks. That’s why we’re not just long IWM and TNA, we’re also positioned in ARKK to capture the upside in high-beta innovation names, otherwise known as profitless tech.
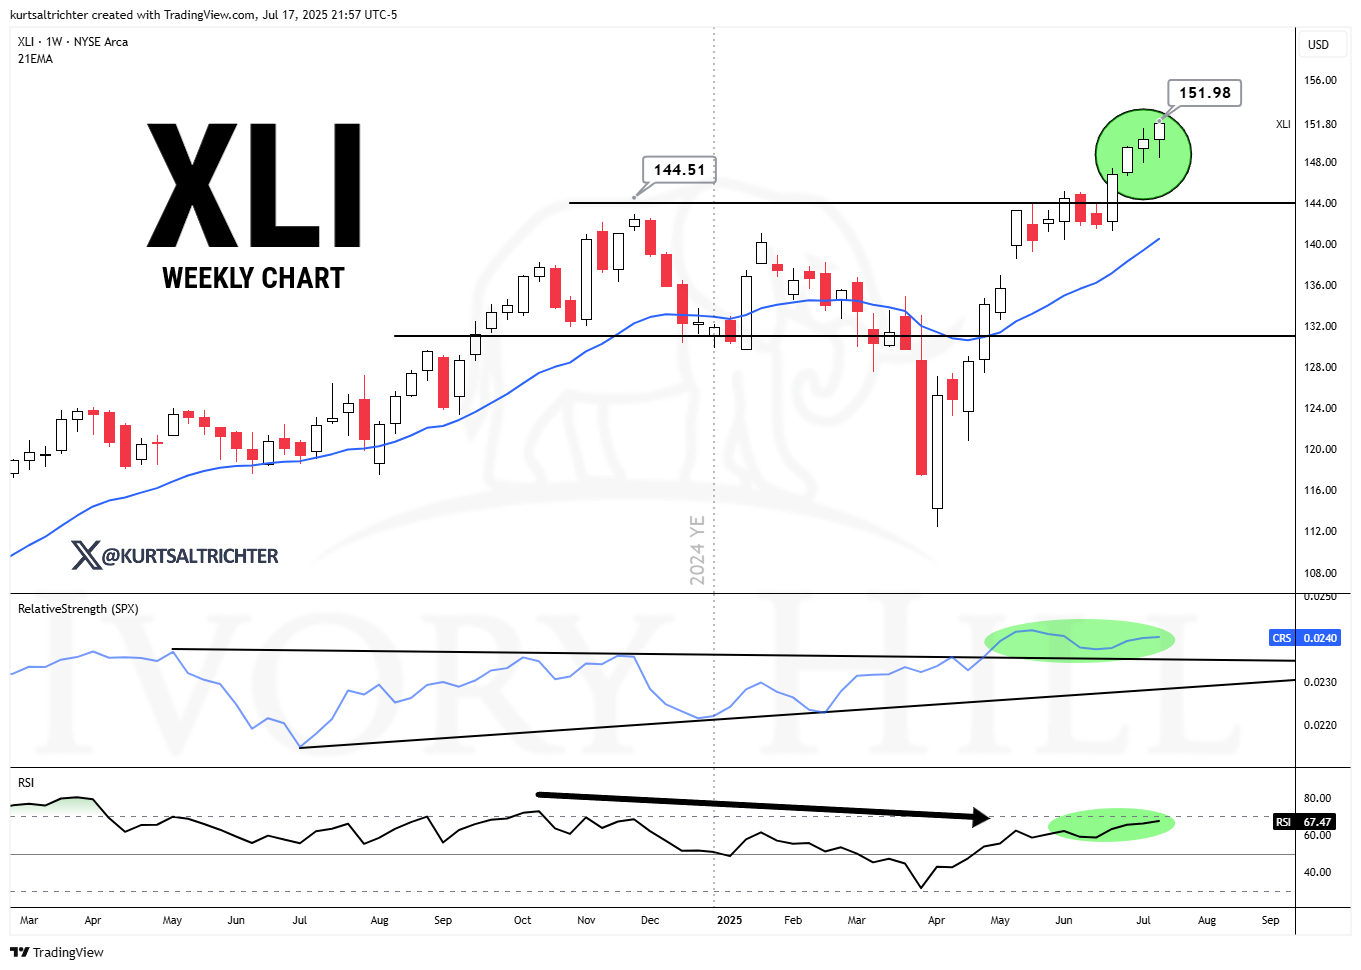
Industrials Leading the Charge, for Now
Industrials are currently the strongest sector in the S&P 500, breaking out of their recent downtrend and gaining momentum as cyclicals come back into favor. XLI is showing broad-based strength, clearing prior resistance, improving in relative strength, and pushing higher on RSI, all supported by solid buying pressure. That said, the setup isn’t bulletproof. Trade tensions remain a risk, but for now, optimism around infrastructure investment and the Trump tax plan is tilting the scales in favor of industrials. We're still early in the move, and any short-term weakness looks like a buying opportunity.
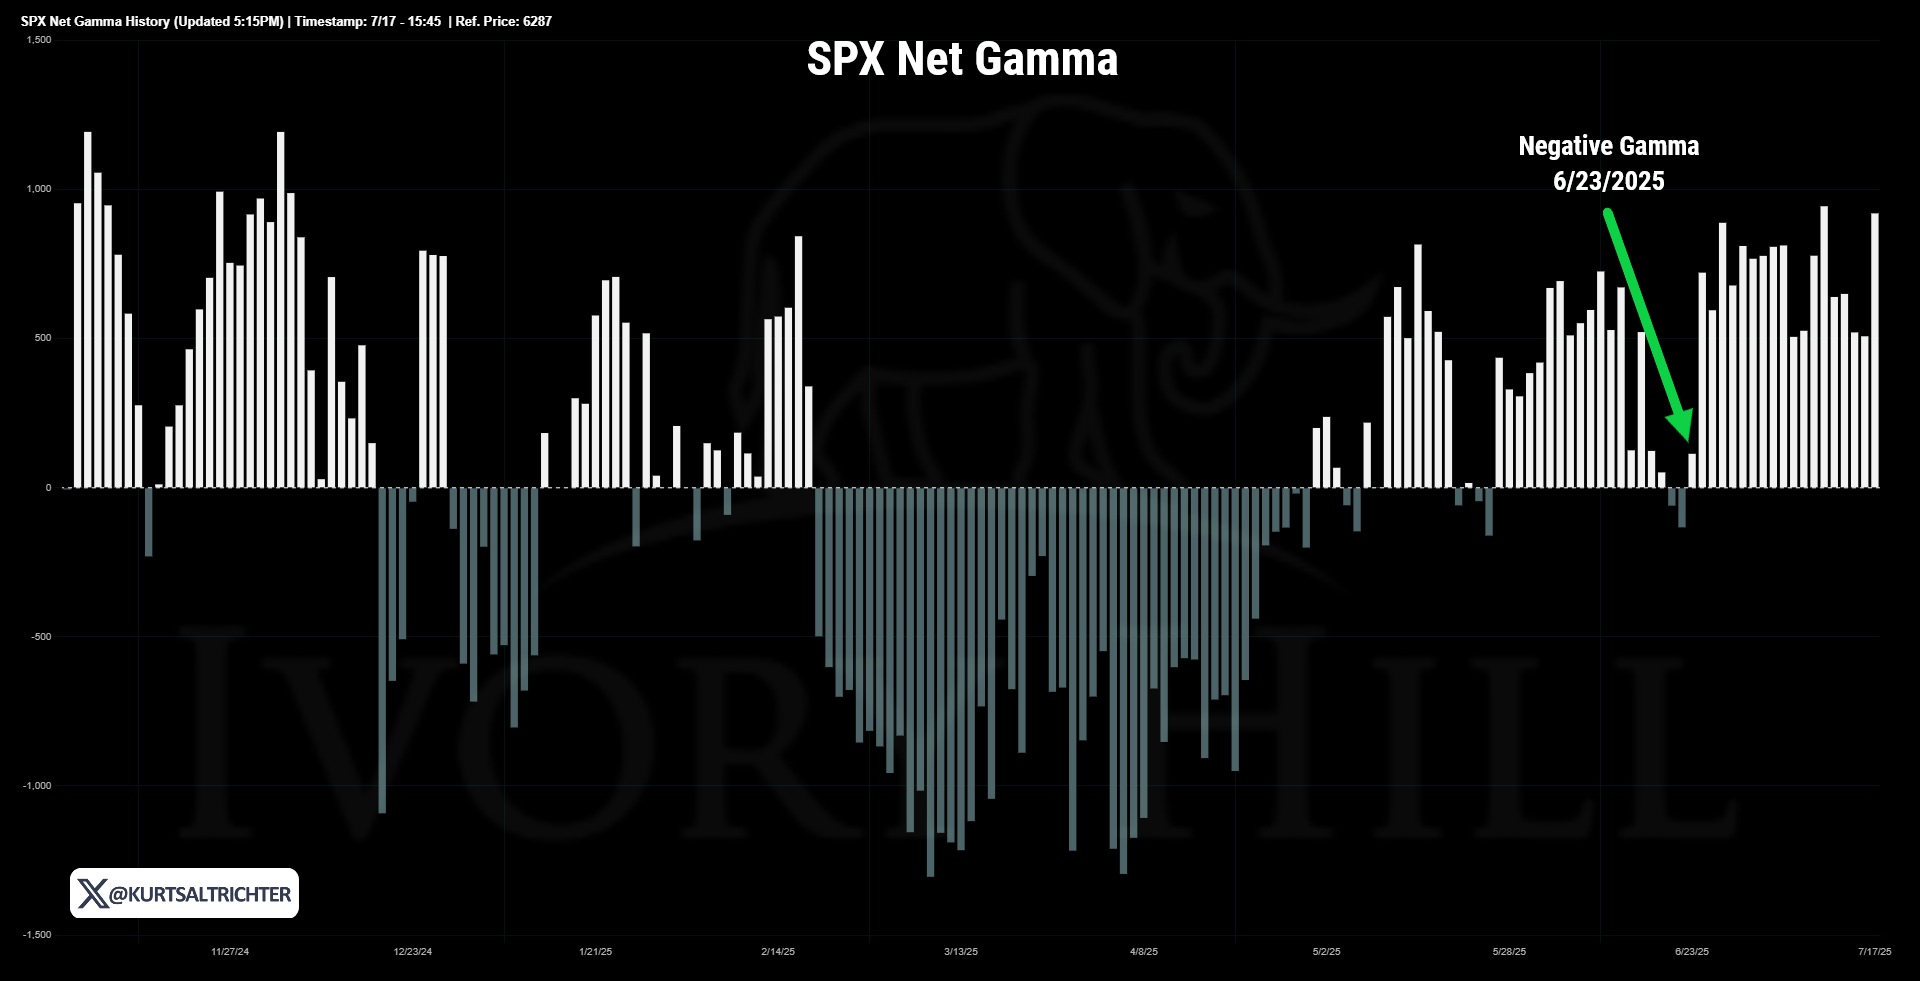
Dealer Gamma Exposure
The market has been in positive gamma territory since June. In this regime, dealers are forced to buy when the market goes down and sell when the market rises, which tends to suppress volatility.
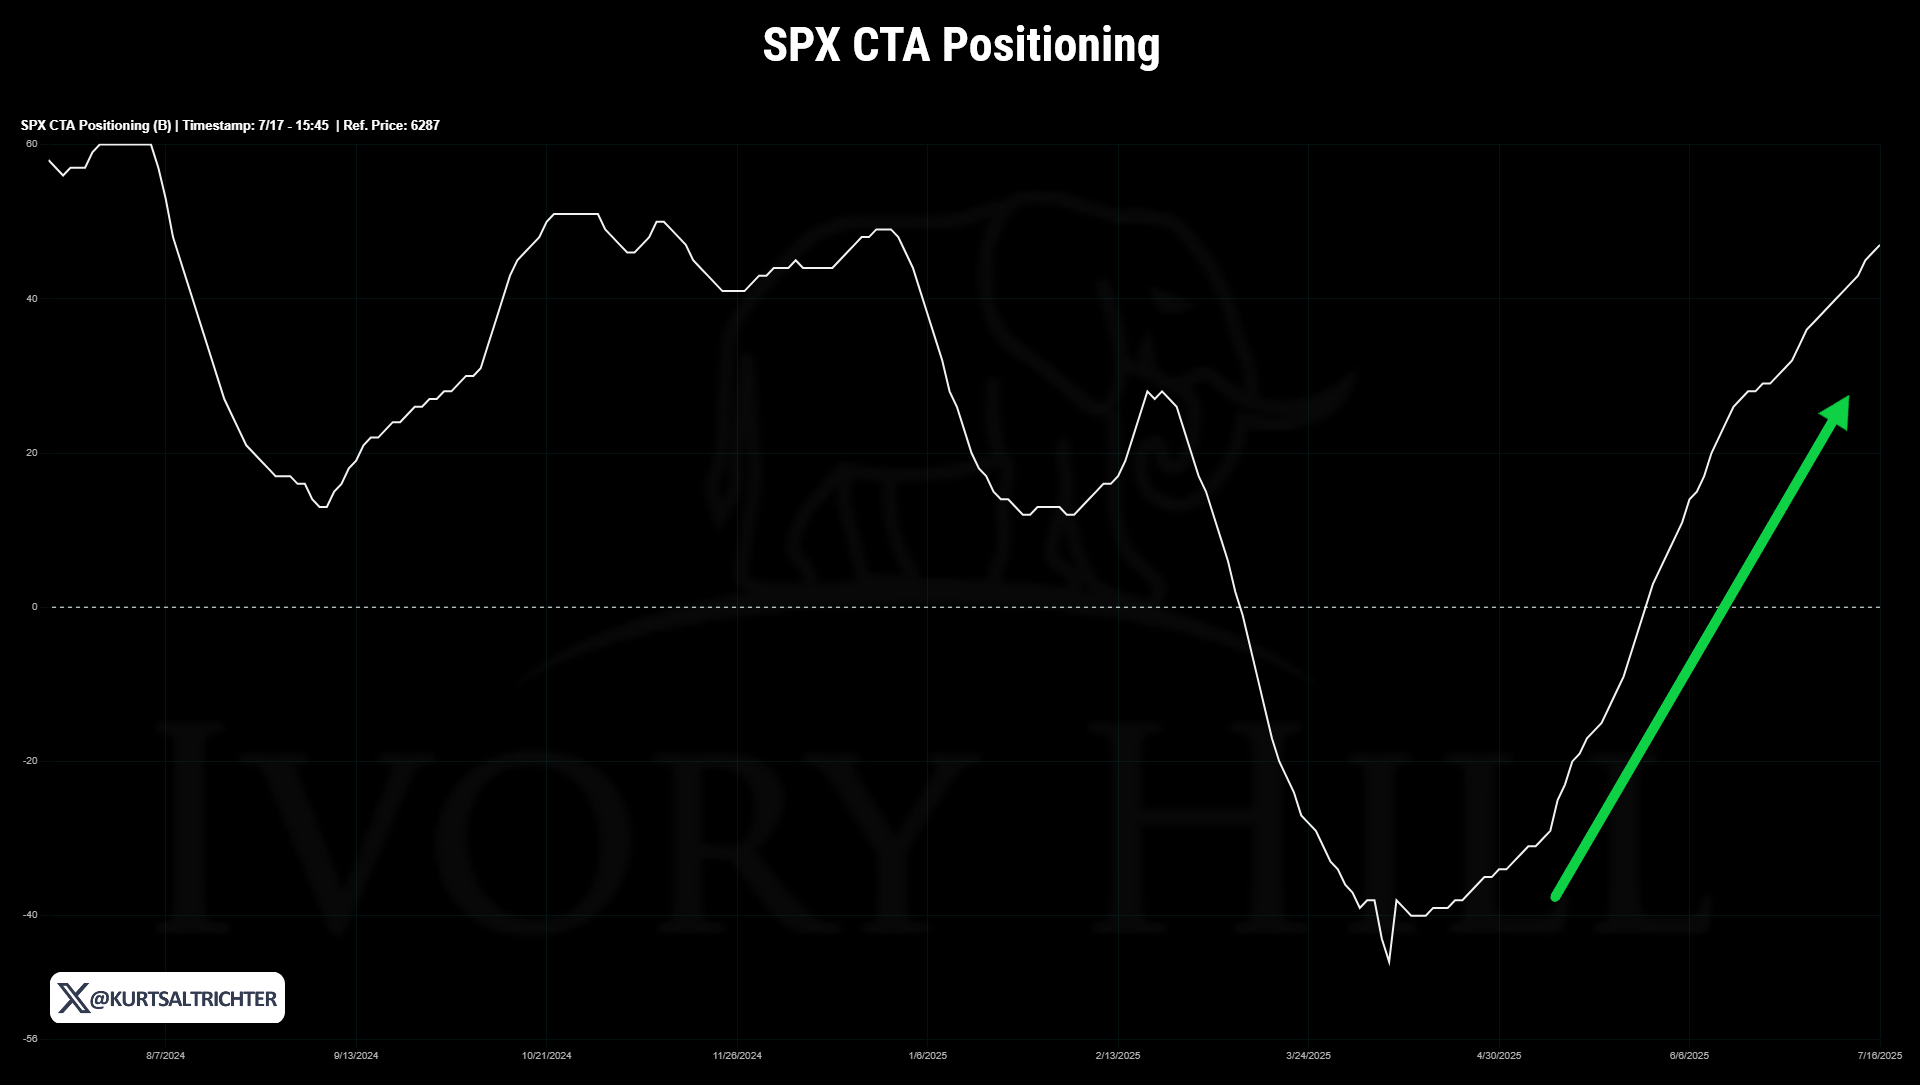
Systematic Flows Are Driving the Market, But Watch the Trap Door
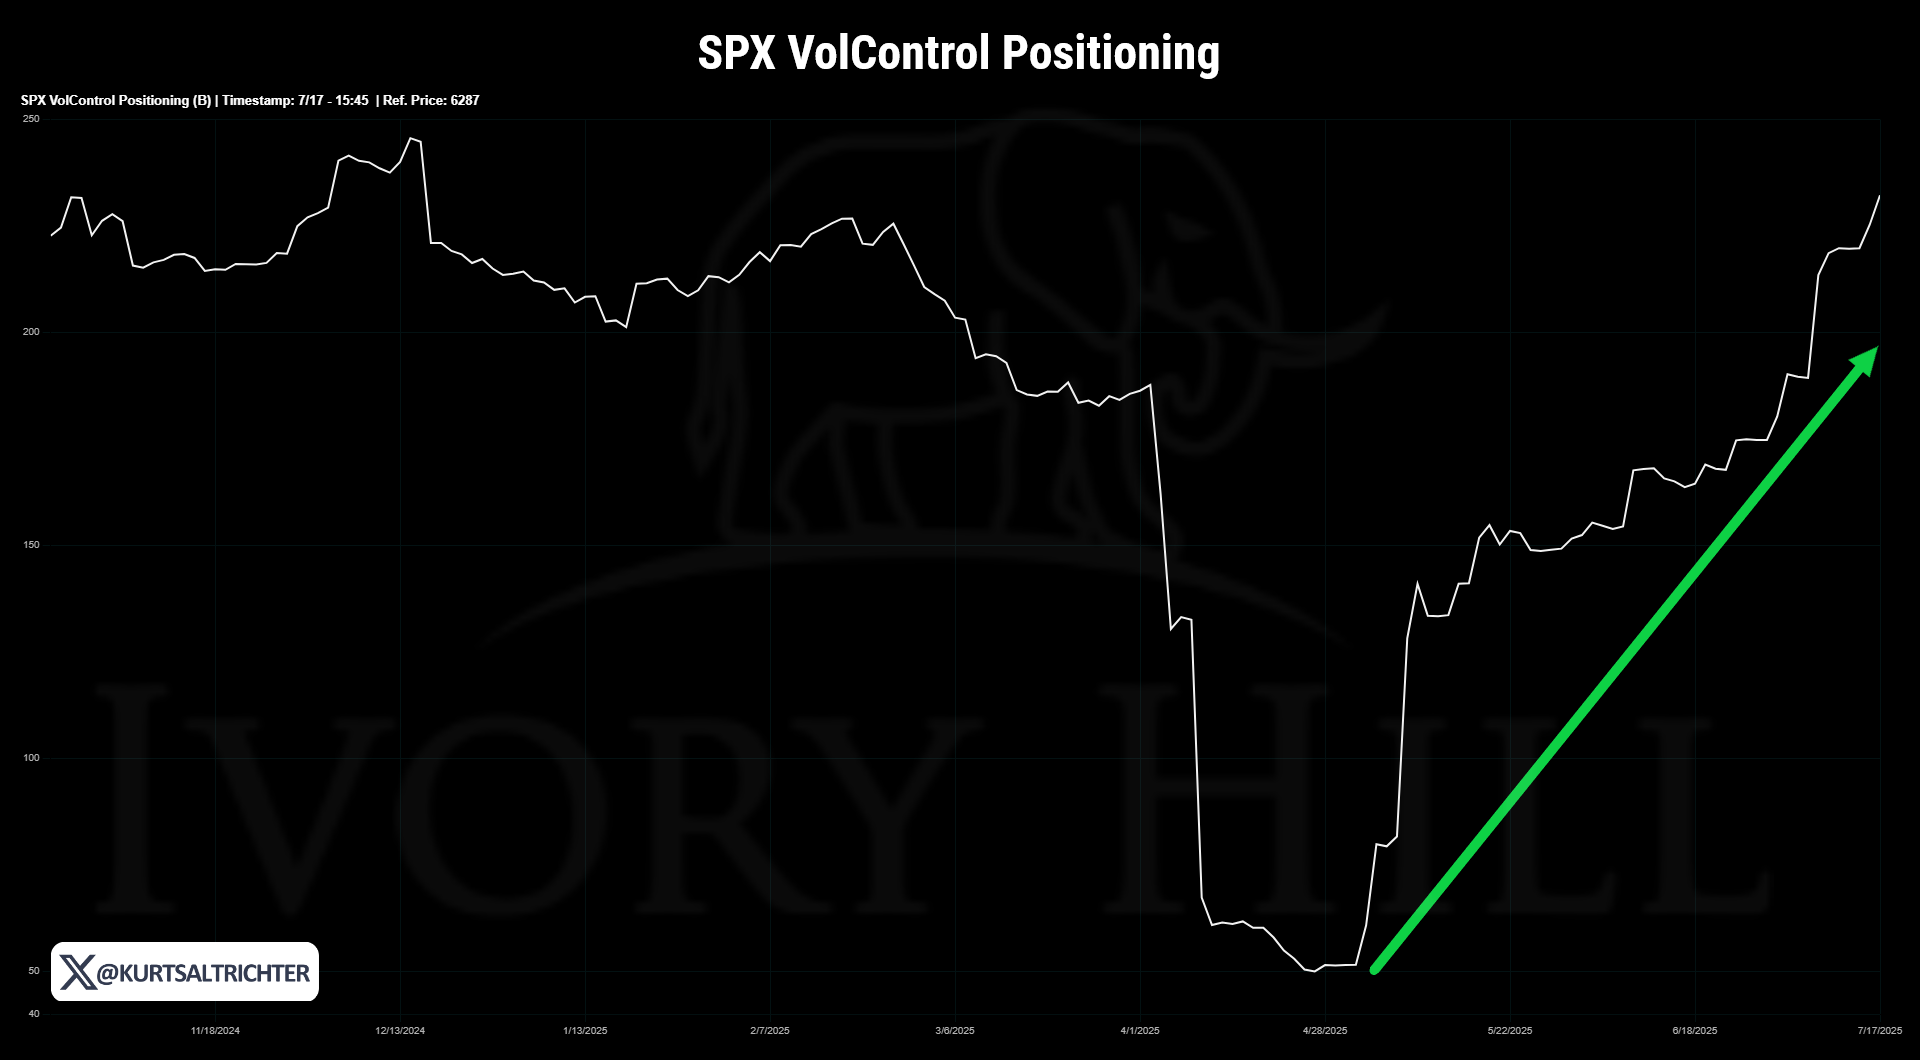
CTA and Vol Control strategies have been ramping up equity exposure as volatility trends lower, mechanically buying without regard to fundamentals or price. These flows have supercharged the rally, as shown in the sharp climb in both CTA and VolControl positioning charts.
But this kind of strength cuts both ways; what goes up mechanically can unwind even faster. As long as volatility stays low and the trend holds, the bid remains. But if either breaks, the same algorithms that have been forcing buyers could become forced sellers. It's bullish for now, but it's built on fragile footing.
With tomorrow’s OpEx on deck, we’re nearing another key inflection point. After such a strong run, a pause or pullback should be expected.
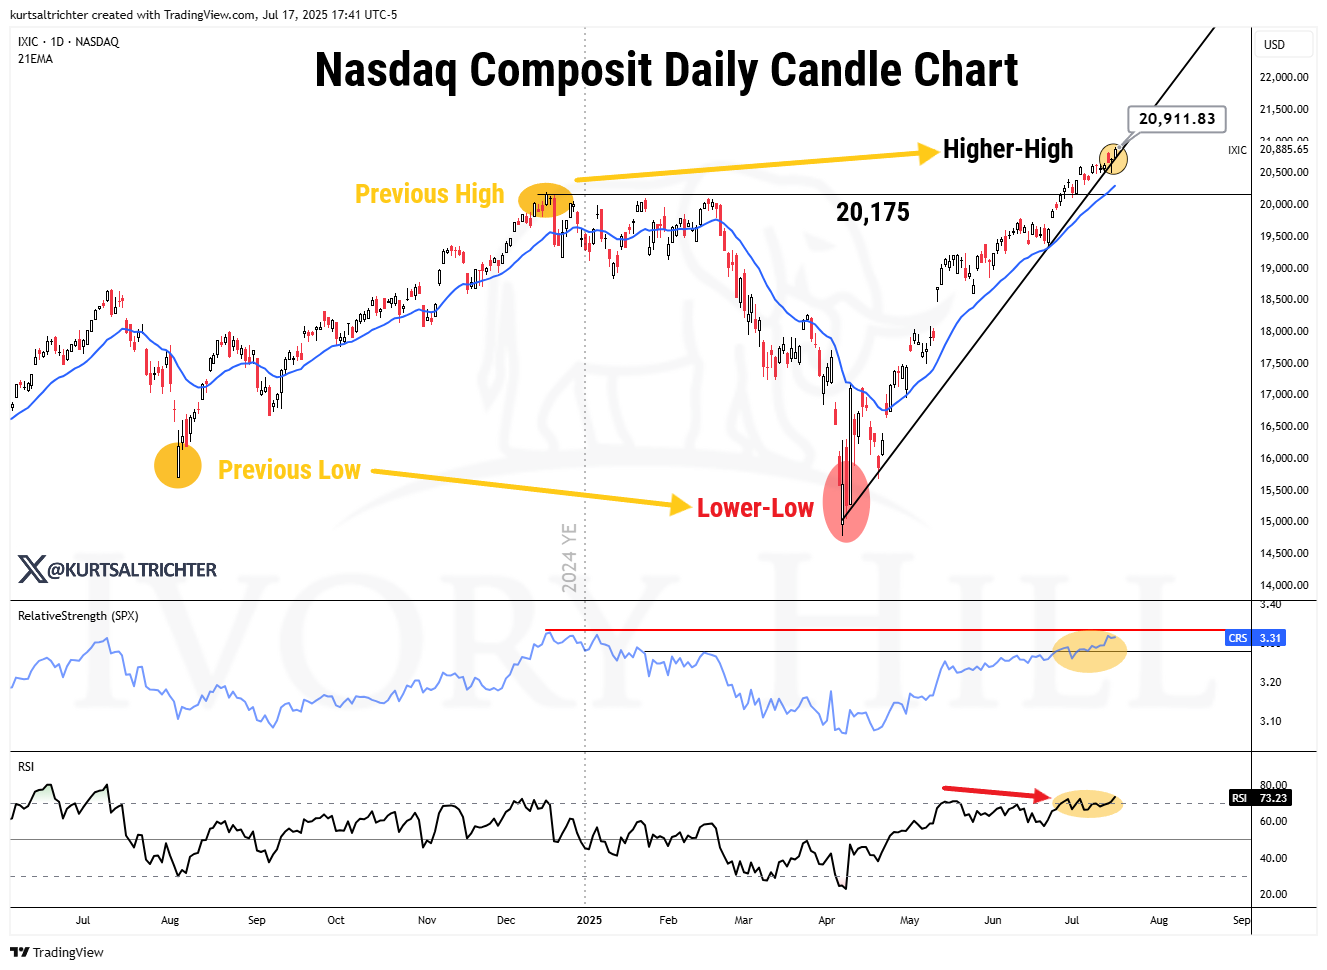
Nasdaq Leadership Is Starting to Crack
The Nasdaq has led this rally off the Q2 lows, but signs of exhaustion are building. Despite notching a higher high on the chart, RSI is flashing a bearish divergence, and relative strength to the S&P 500 is stalling. Leadership momentum is fading. With the index breaking slightly below short-term trend support, the risk is rising that tech could lead the next leg lower, just as it did on the way up. Any short-term weakness is a buying opportunity, but a break below 20,175 would be outright bearish.
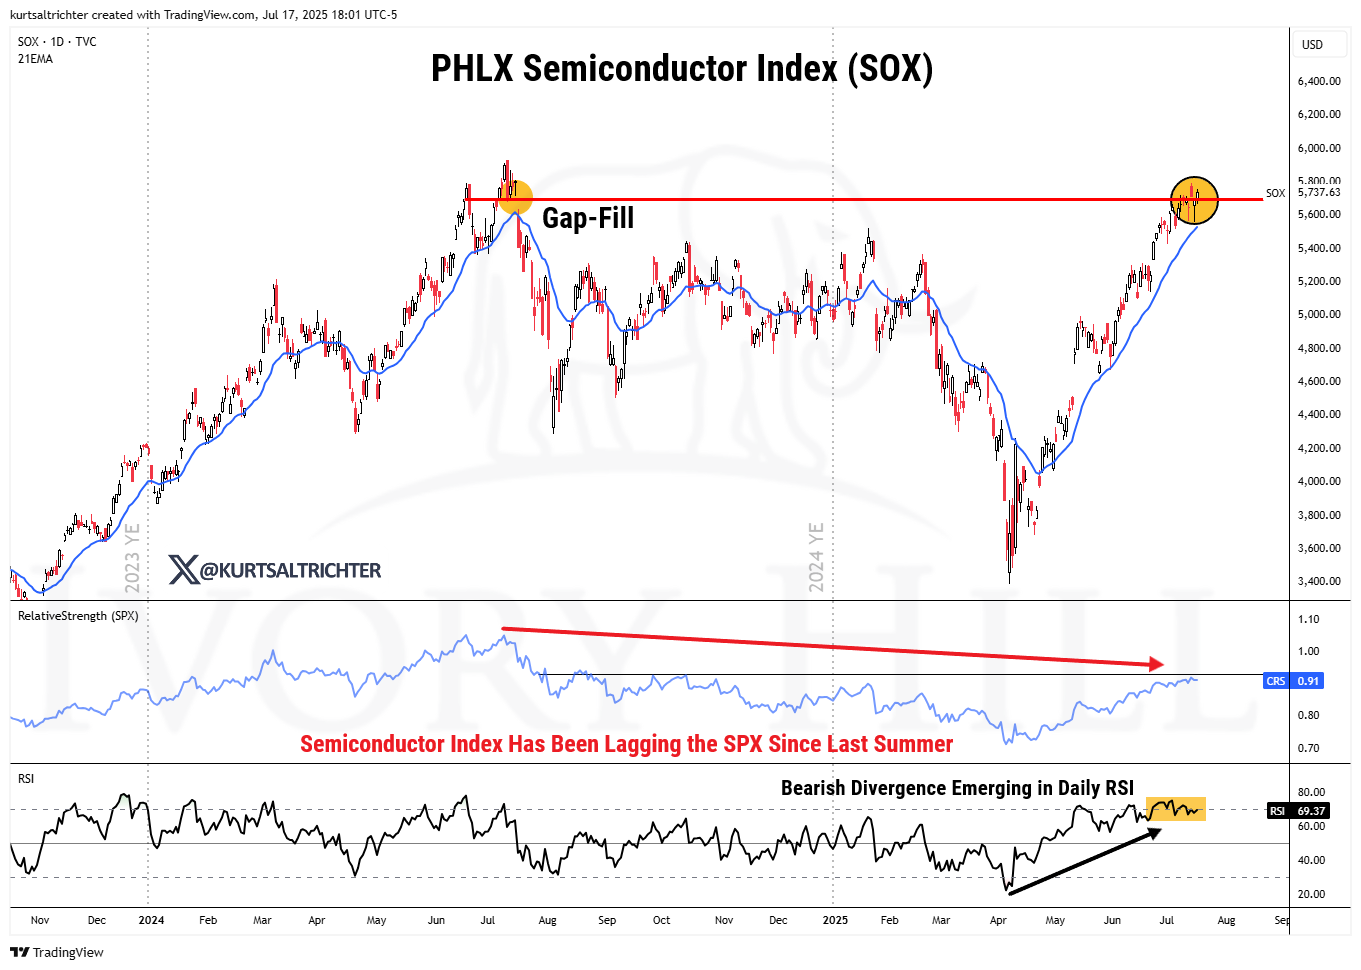
Semis at a Tipping Point
The SOX is knocking on the door of its all-time highs, but the setup beneath the surface is far from convincing. Bearish divergence is taking shape in the daily RSI, and the index continues to lag the S&P 500, an issue that’s persisted since last summer. Momentum is fading just as price fills the final gap. If semiconductors roll over here, the rest of the market is going to follow.
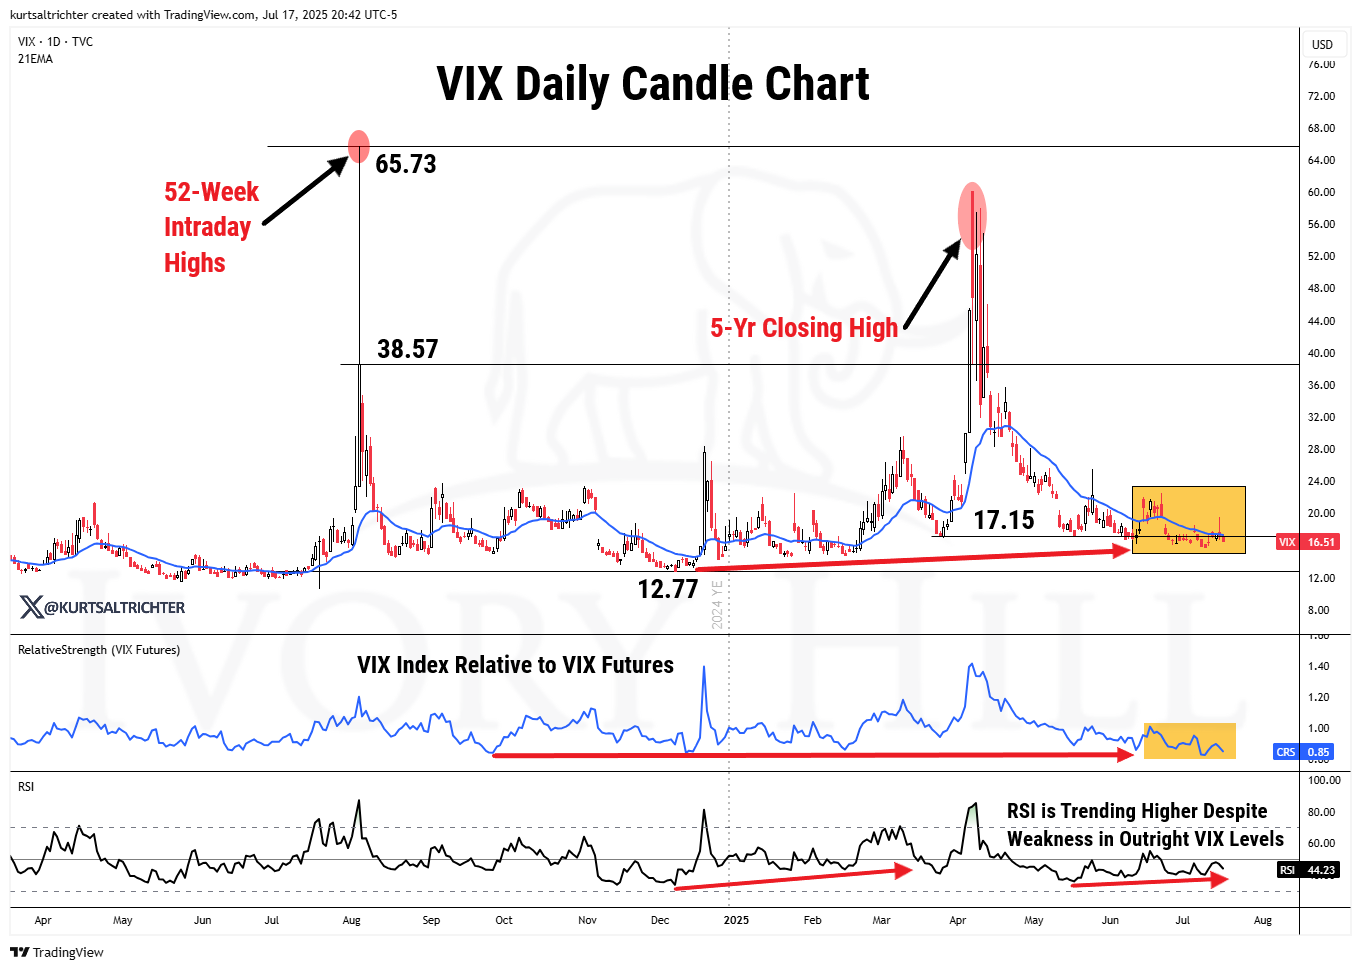
Volatility Is Quietly Coiling
The VIX just logged fresh 5-month lows, but don’t get too comfortable. Despite outright weakness in the index, both RSI and relative strength to VIX futures are trending higher, classic signs of a bullish divergence in volatility, not stocks. With the short-volatility trade becoming increasingly crowded and the calendar spread nearing extreme levels, the setup is ripe for a resurgence in volatility. Few are positioned for it, but the risk is building under the surface.
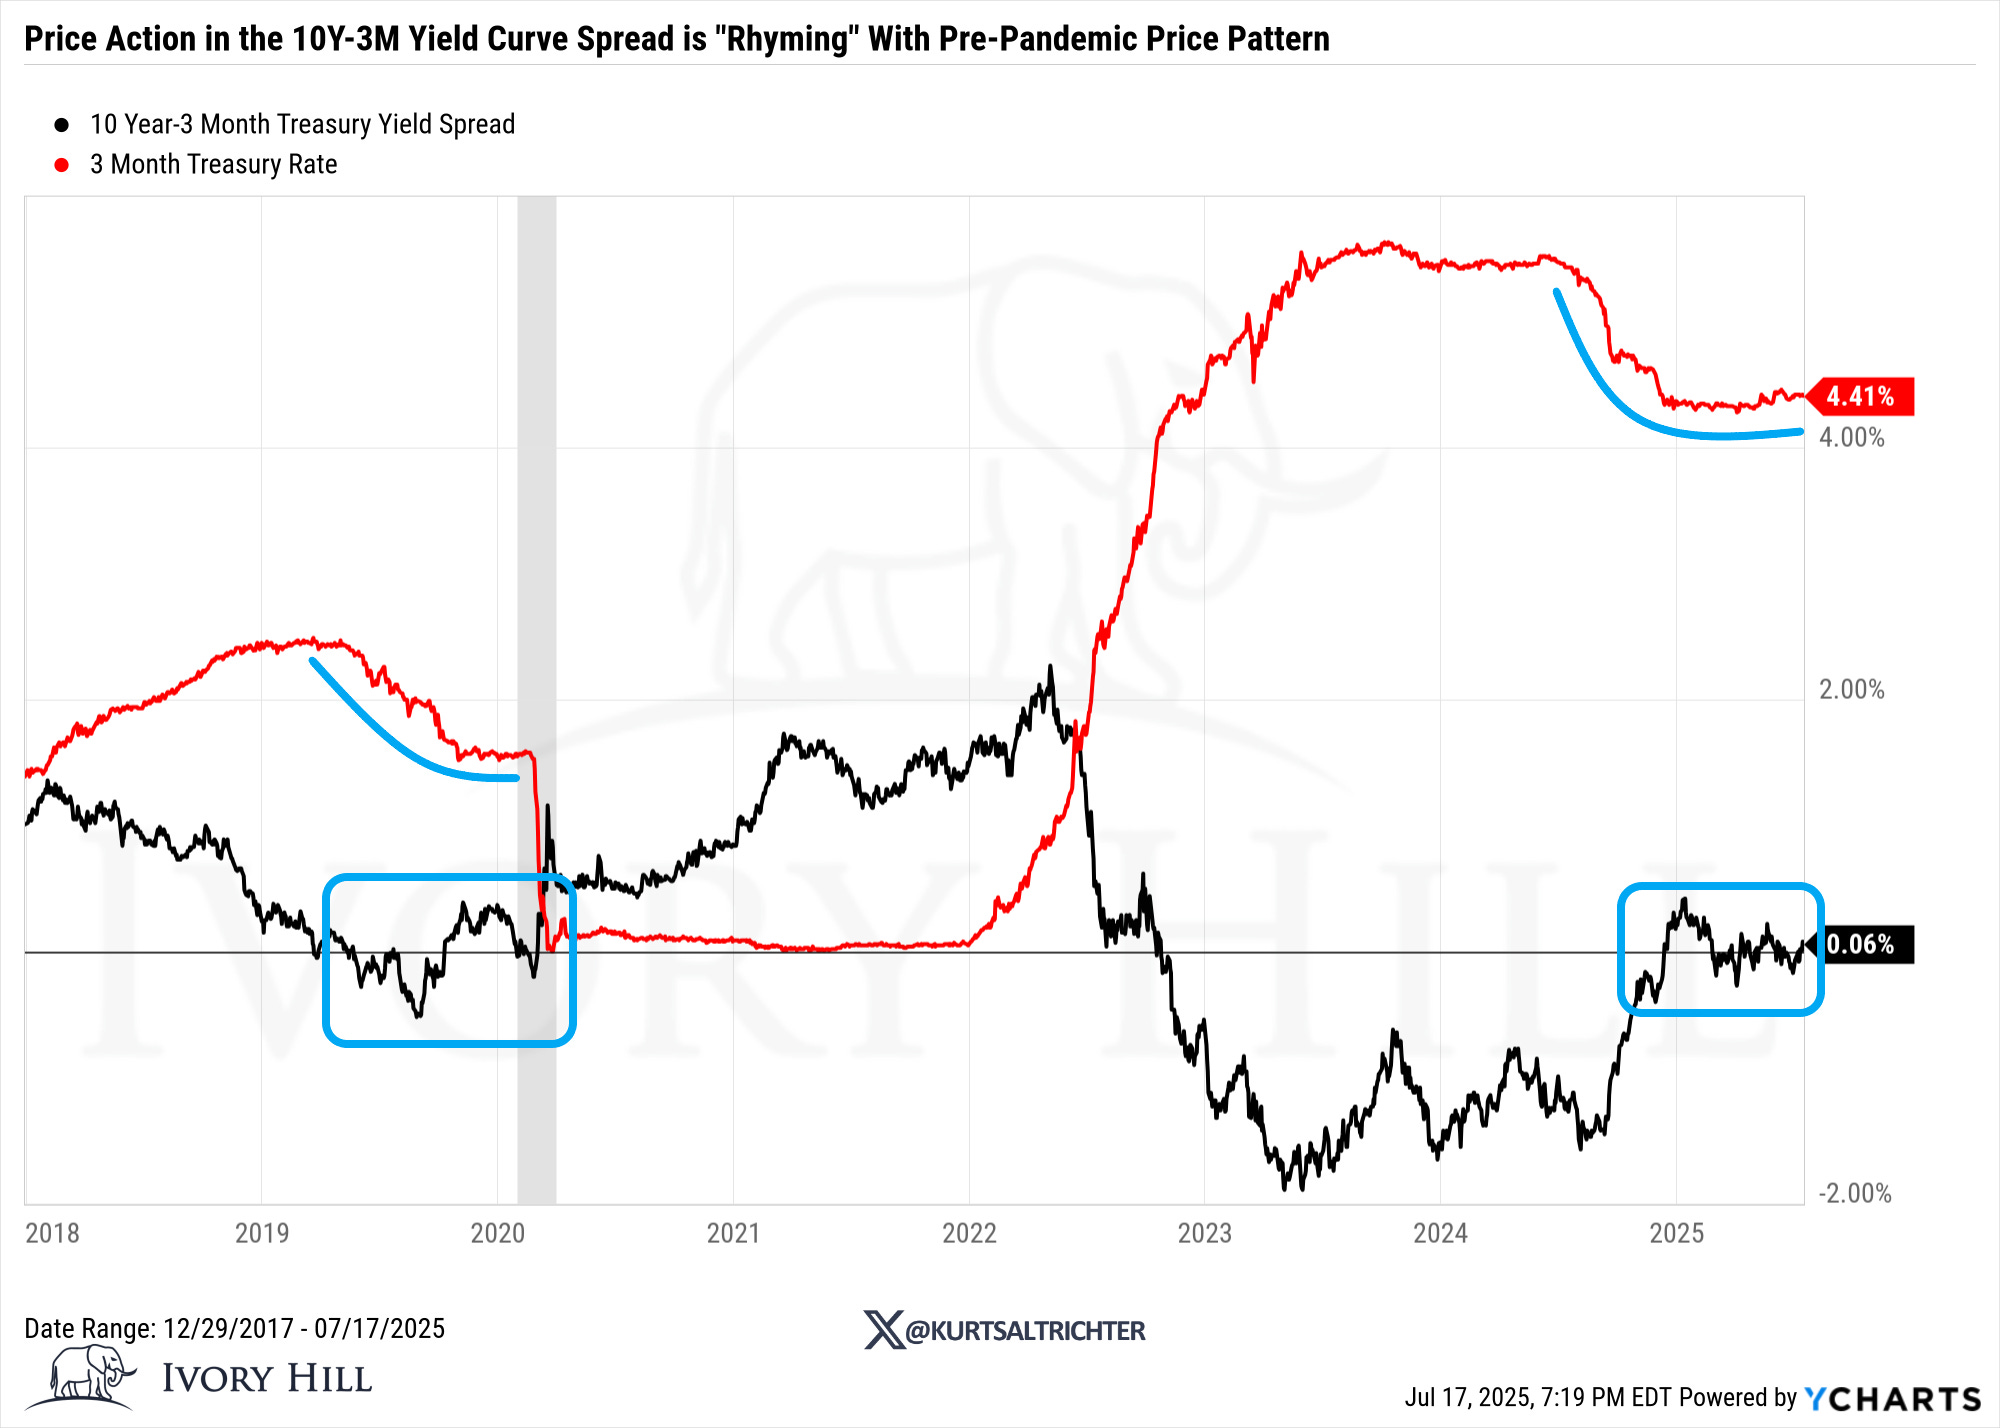
Yield Curve Echoes Pre-COVID Crash
The 10Y–3M yield curve is emerging from a deep inversion in a way that eerily mirrors the 2019 pre-COVID crash setup. Just like before the pandemic crash, we’re seeing the 3-month Treasury rate flatten while the spread grinds sideways around zero. History shows this “holding pattern” tends to resolve into economic weakness, not acceleration. The market may be obsessed with AI and soft-landing narratives, but yield curves are flashing a different message: this cycle isn’t done with us yet.
And remember - The one fact pertaining to all conditions is that they will change.
Feel free to use me as a sounding board.
Best regards,
-Kurt
Schedule a call with me by clicking HERE
Kurt S. Altrichter, CRPS®
Fiduciary Advisor | President