
Technical Economics: Reading the Market Without the Noise
How long-term charts can expose turning points faster than traditional data analysis

With September, historically the toughest month for stocks, now behind us, the outcome feels like a win. A pullback was not surprising after so many consecutive up days, and the S&P 500 has made 27 new all-time closing highs. Fortunately, Chair Powell’s remarks did not rattle markets too badly, aside from his unexpected commentary on stock valuations.
The Ivory Hill RiskSIGNAL remains in positive territory, so we view any weakness as a buying opportunity until the trend proves otherwise. Our outlook is constructive heading into Q4, and we see a run toward 6,700 or higher as a reasonable expectation.

Dealer gamma on the S&P 500 has shifted back into positive territory near 6,625, meaning options dealers are once again long gamma around the current spot. When dealers are long gamma, they tend to suppress volatility by buying dips and selling rips, which can help stabilize price action and keep intraday swings more contained. If spot breaks below this zone and dealers flip back to short gamma, the market could see sharper, more directional moves.
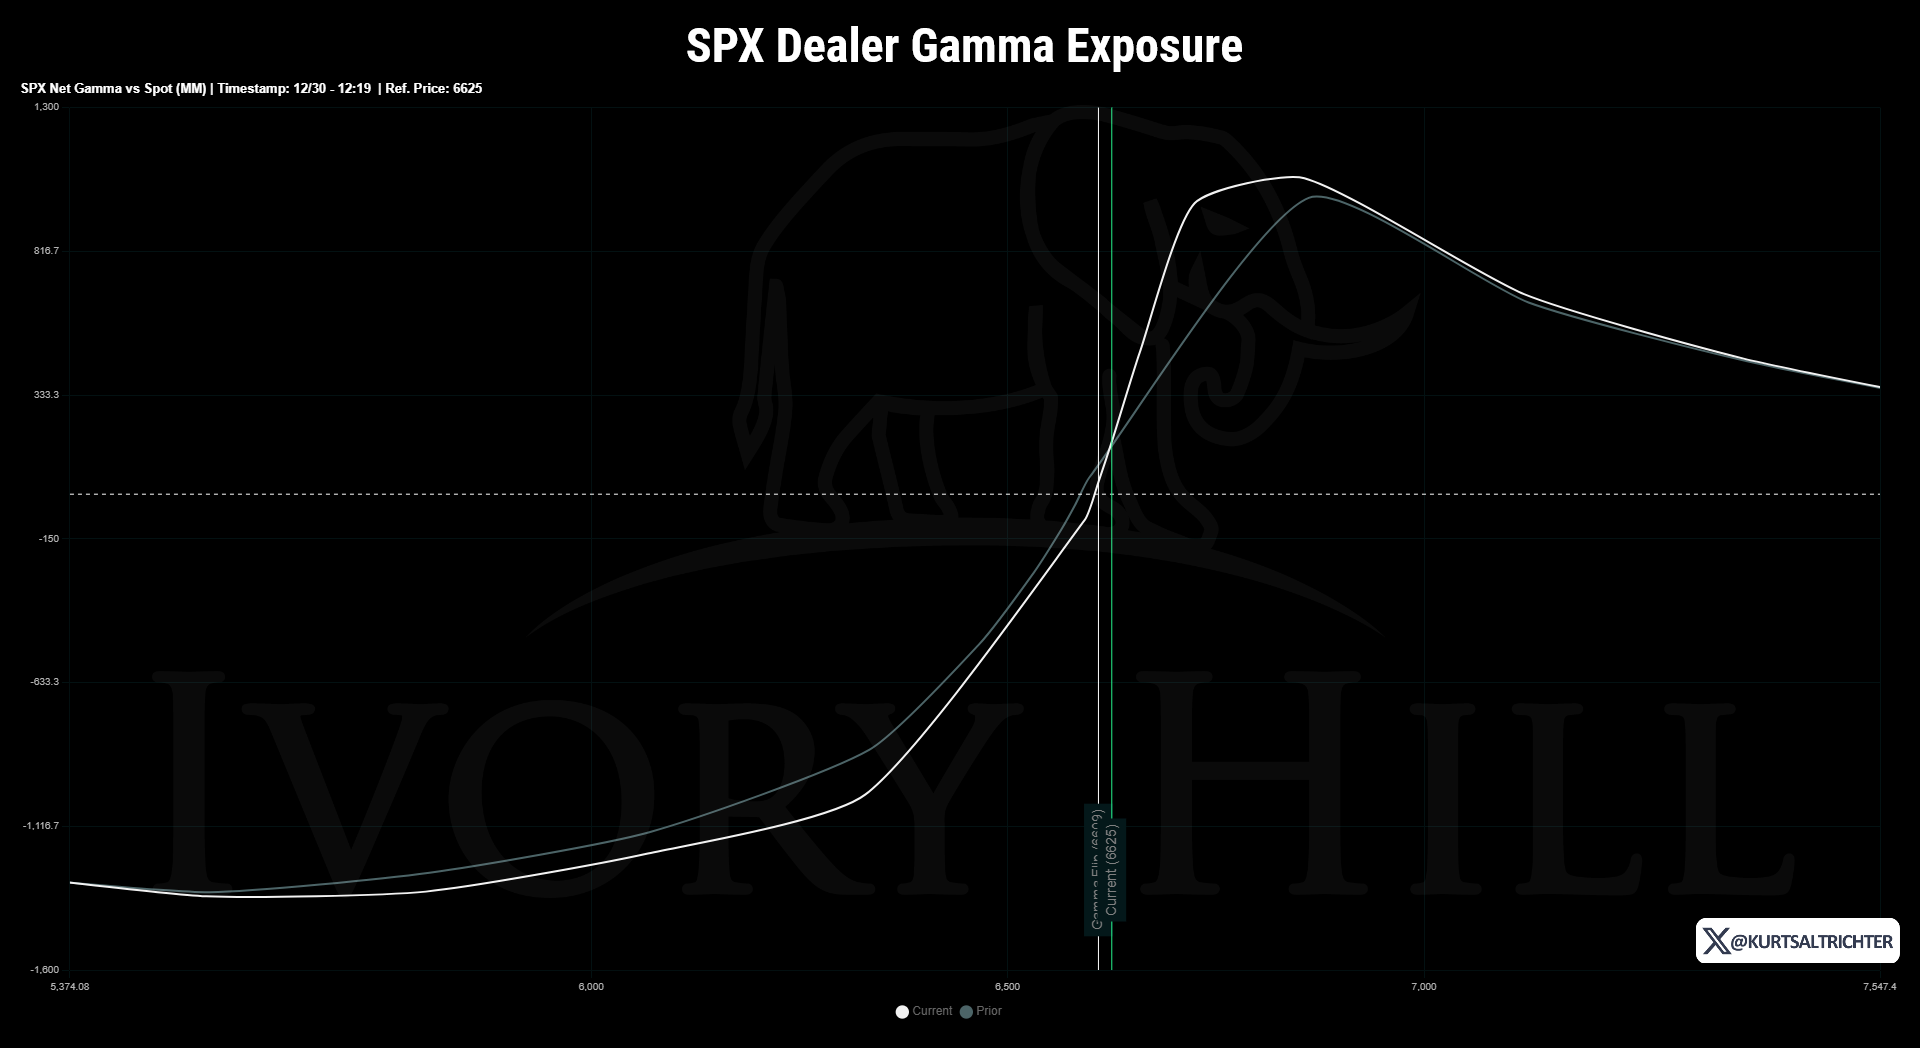
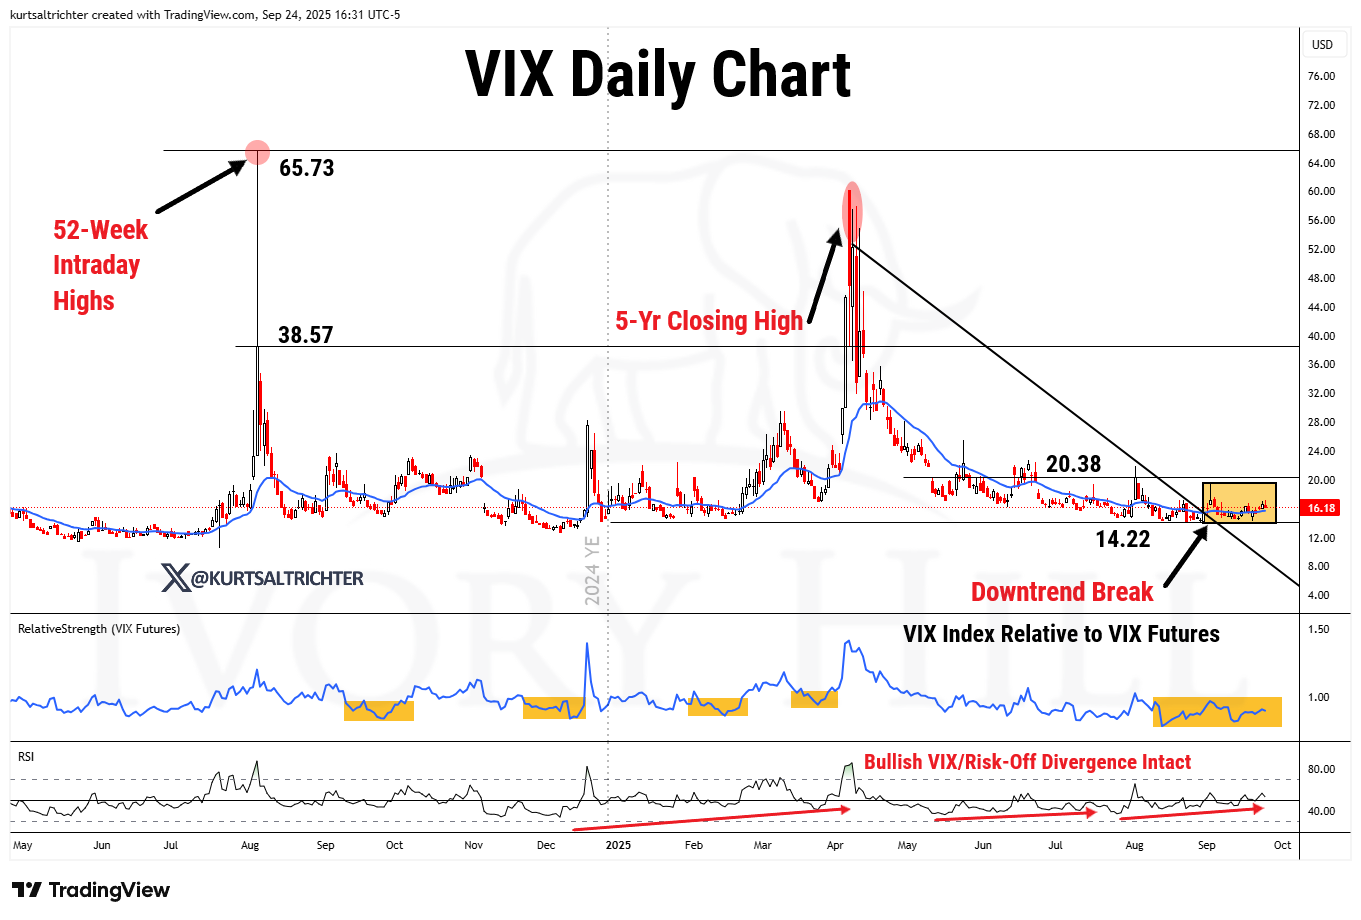
But if spot breaks below key gamma levels and dealers flip short gamma, their hedging flows reverse. Instead of absorbing moves, they chase them, adding fuel to downside volatility and often driving the VIX sharply higher. Right now, the calm is being maintained by dealer long gamma, but it’s fragile if the market moves out of their hedging range.
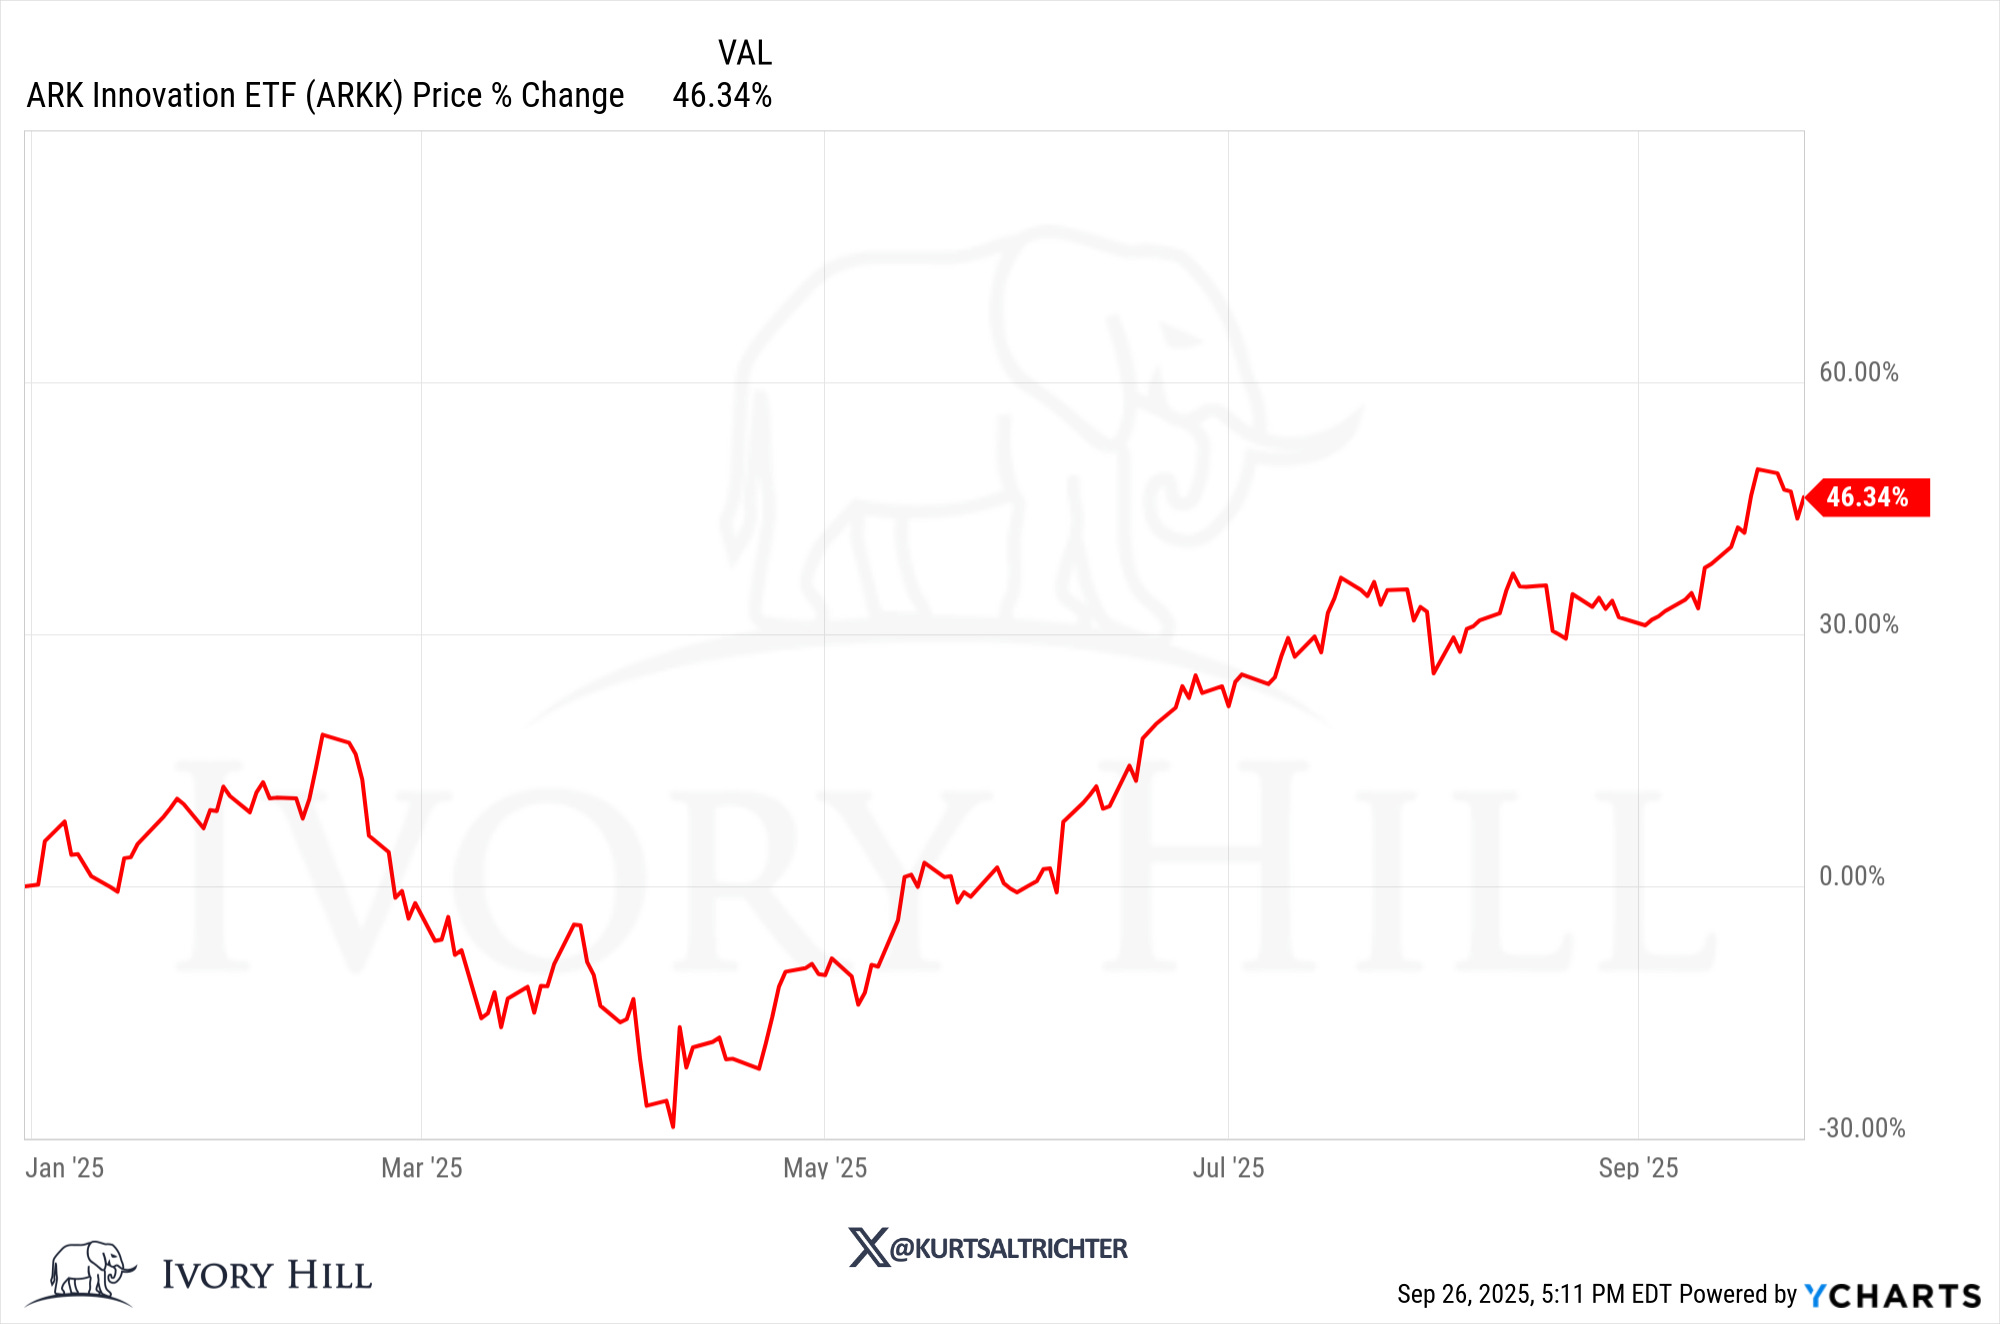
The market’s leadership has quietly been broadening beyond the mega-cap tech names that dominated earlier this year. High-beta growth themes and profitless tech have come back to life, and our positioning in ARKK has been a standout example. After a choppy start, the ETF has rallied strongly and remains up more than 45% year-to-date, validating our strategy of leaning into small- to mid-cap growth as market participation widens.
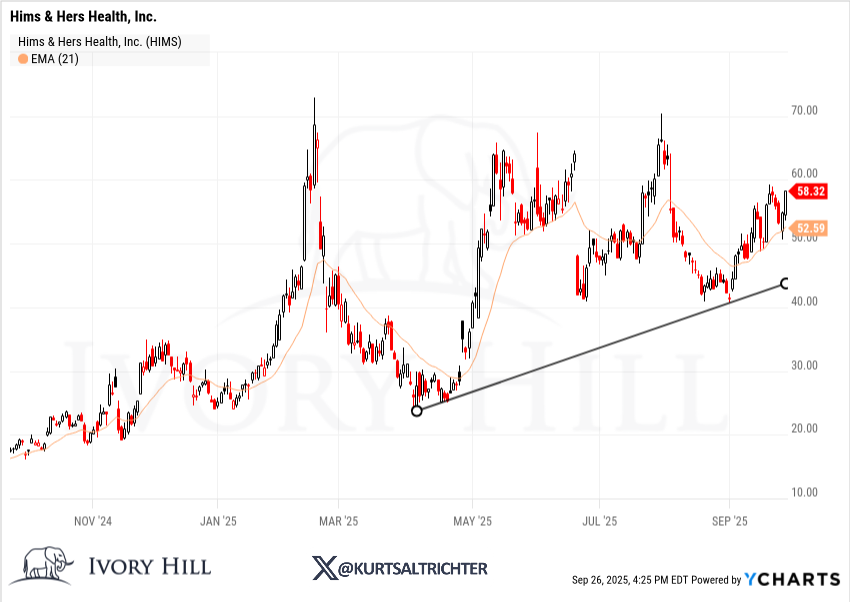
HIMS is in a constructive long-term uptrend, now retesting support with a chance to resume higher. It offers a defined entry with risk below the rising trendline, ideal for those looking to participate if the stock continues building on its higher-low structure.
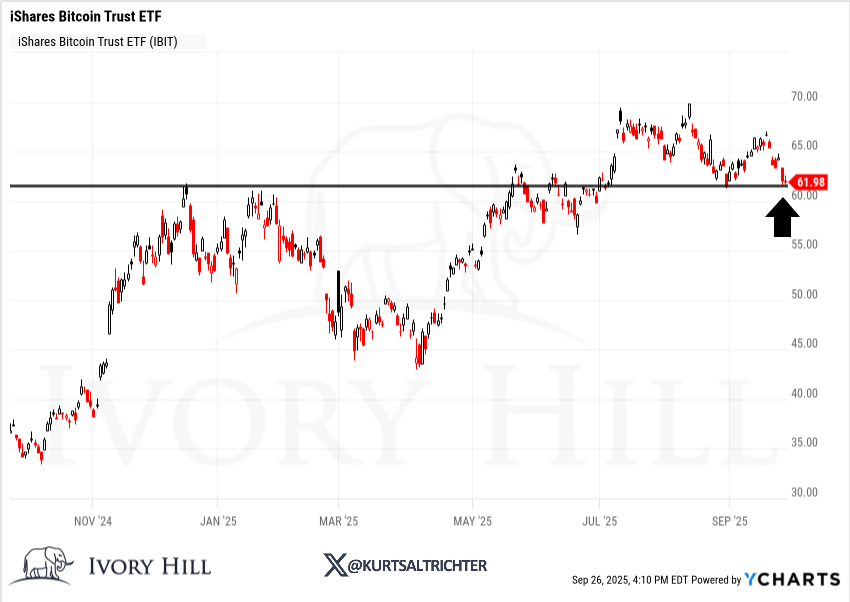
IBIT has pulled back to the $62 area, revisiting the breakout zone it cleared in early 2025. Markets often retest former resistance as support after extended advances. Despite recent weakness, IBIT’s long-term uptrend from late 2024 remains intact. Pullbacks to these key levels can offer more attractive risk/reward than chasing strength at new highs. The broader macro backdrop still looks favorable for Bitcoin and crypto in the coming months and quarters.
Technical Economics: Reading the Market Without the Noise
A chart can often tell you more in seconds than hours spent dissecting government data. Traditional economic analysis leans heavily on complex statistics, delayed data releases, and subjective forecasts. Worse, the numbers we base those forecasts on are often revised, sometimes dramatically, after the fact.
A recent example: the Bureau of Labor Statistics initially reported a gain of 147,000 jobs in June, only to revise that to a net loss of 13,000. Stocks rallied through the summer on what turned out to be inaccurate information about labor strength. This isn’t unusual; history shows that economic data trends, like stock prices, often appear misleading when viewed in real-time.
Instead of wrestling with backward-looking reports each month, jobs, inflation, consumer spending, retail sales, we can take the same technical approach investors use for equities and apply it to macro data itself. A well-chosen chart can cut through the noise and revisions, showing the true underlying trend.
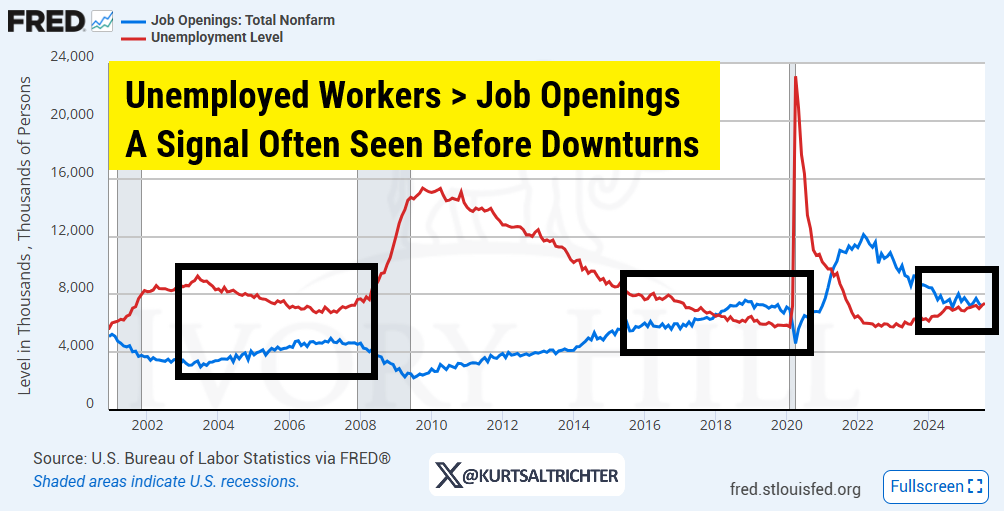
1. Labor Market: Open Jobs vs. the Unemployed
Job openings, measured by the JOLTS survey, typically rise during healthy expansions while unemployment falls. But in 2025, the lines have flipped: the total unemployed now exceeds the number of available jobs. That’s a meaningful shift, one we last saw ahead of past slowdowns. It doesn’t scream “recession now,” but it’s a cyclical warning sign worth respecting.
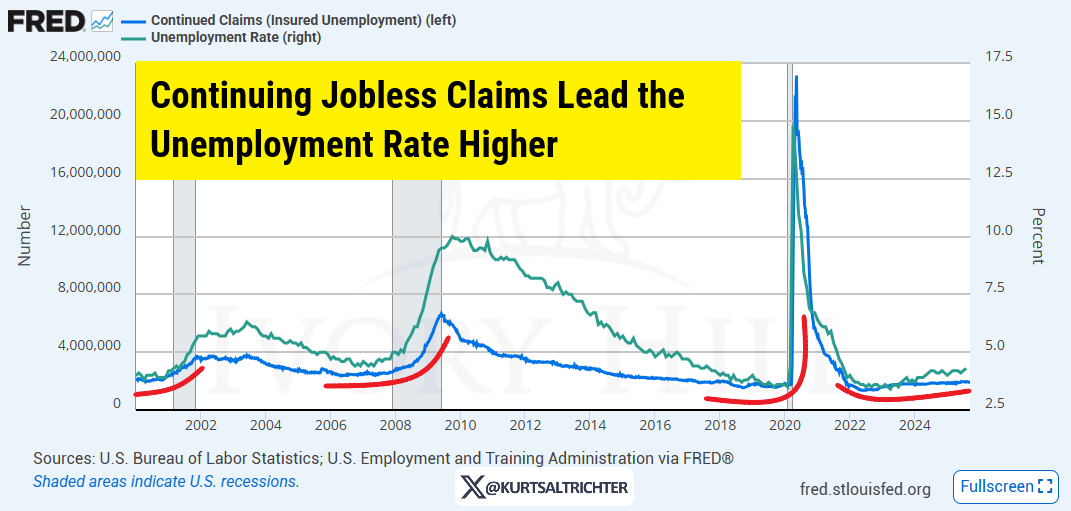
2. Jobless Claims Point to Labor Softness
Continuing jobless claims tend to turn higher before the official unemployment rate follows. Both series are now trending upward toward four-year highs. Historically, there hasn’t been an exception to this relationship in the modern era. If claims continue to rise, the headline unemployment rate typically follows, and markets eventually take notice.
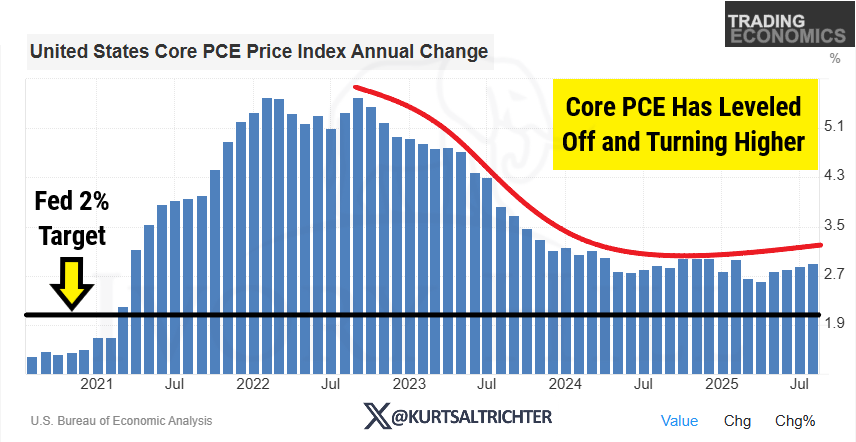
3. Inflation: Core PCE Turning Back Up
Core PCE, the Fed’s preferred inflation gauge, slowed through mid-2024 and approached the 2% target, but that decline stalled late last year. In 2025, it’s creeping up again, albeit slowly. With the Fed already easing policy, this renewed upward drift in prices is something equity markets may not yet fully price in. Our CPI model has the October 15th CPI print coming in hot between 3.01%-3.25%. Which should be good for energy stocks.
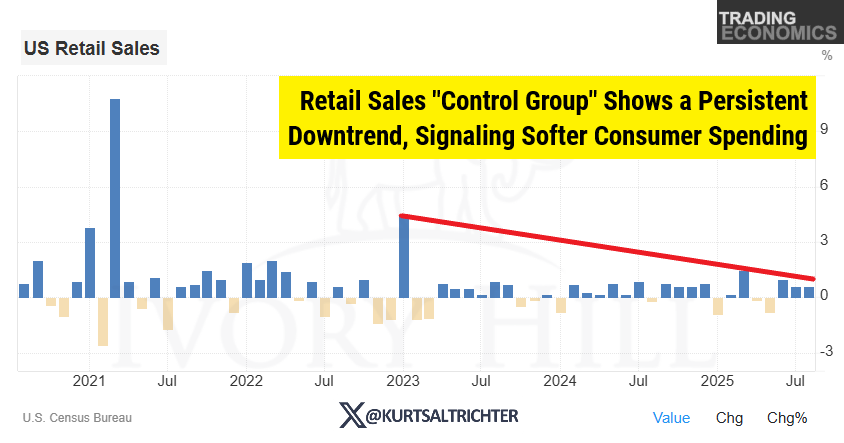
4. Consumers Are Cooling Off
Consumer spending accounts for two-thirds of the U.S. GDP. The “control group” retail sales measure, which filters out volatile categories, has been trending lower since 2023. It’s not collapsing, but the slowdown suggests less fuel for growth going forward, especially if labor softens further.
Big Picture
None of these trends alone calls for panic. However, together, they suggest that the economic engine is losing momentum, even as markets continue to price in resilience. If claims keep climbing, jobs stay scarce, inflation edges back up, and consumer spending slows, risk assets could face a new headwind.
Charts like these don’t predict the future perfectly, but they offer a faster, cleaner read on macro conditions than waiting for lagging, revised reports. In other words, technical economics can help you stay one step ahead when it matters most.
And remember - The one fact pertaining to all conditions is that they will change.
Best regards,
-Kurt
Schedule a call with me by clicking HERE
Kurt S. Altrichter, CRPS®
Fiduciary Advisor | President