

The first market-moving day of earnings season delivered. AI companies confirmed demand, capex, and revenue are still growing, and Capital One beat expectations on consumer lending.
Tech Earnings: Three Reports, No Cracks
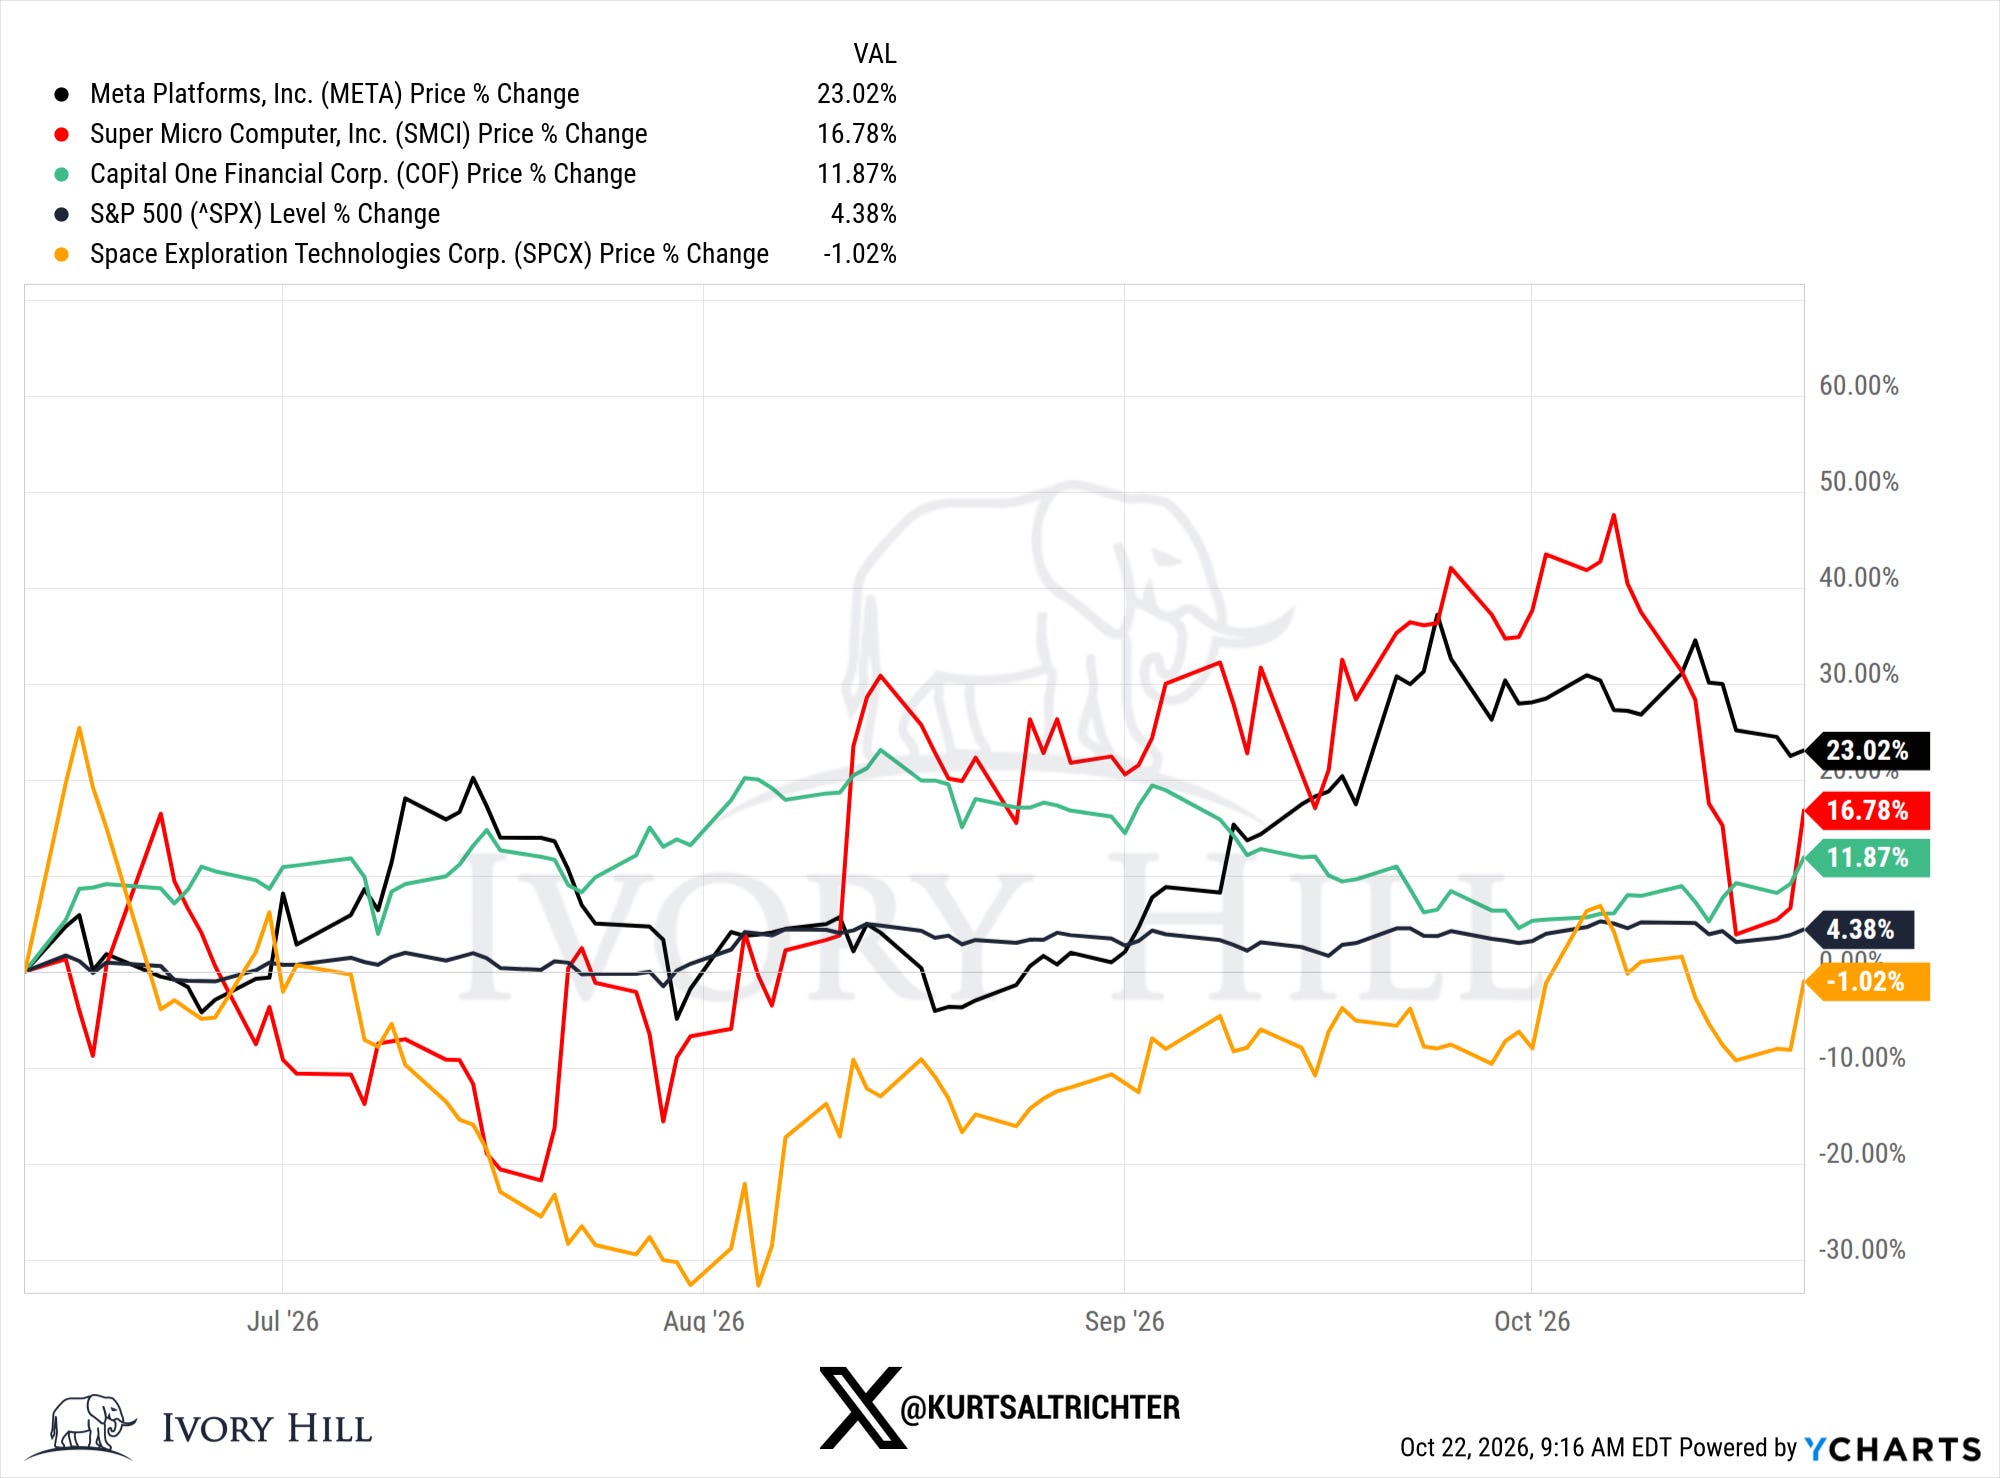
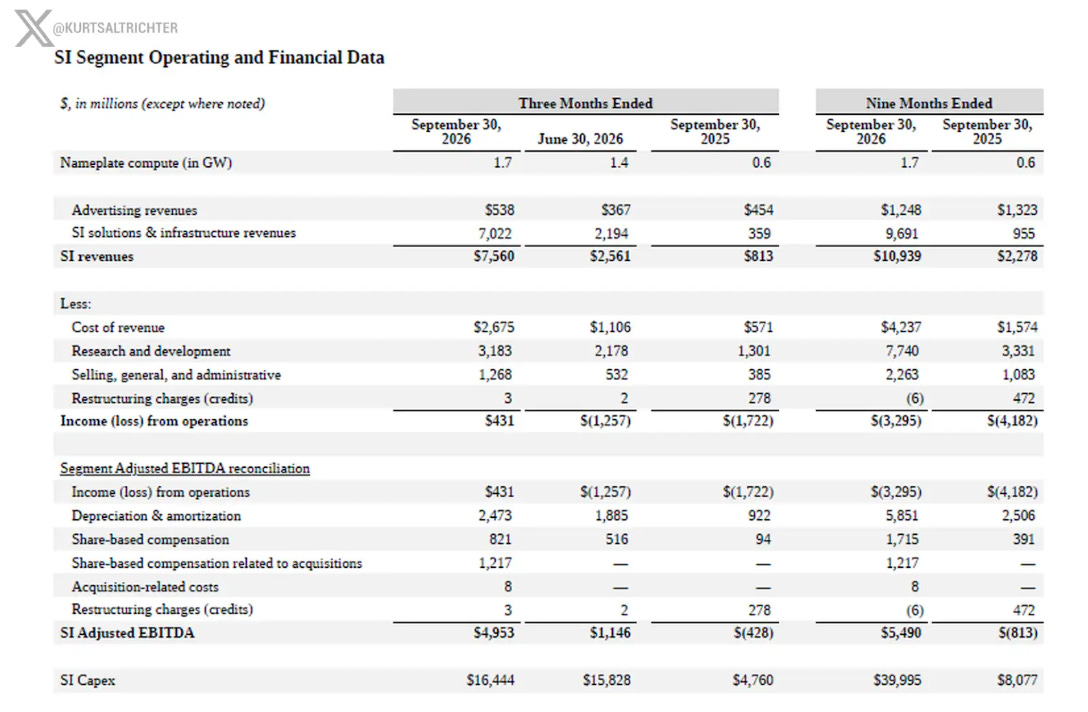
SpaceX and Super Micro Computer both reported after Tuesday’s close and set the tone for Wednesday. SpaceX is viewed as an AI infrastructure company more than a rocket business, and this quarter showed why: AI computing revenue was strong, and management plans to raise capex to build more computing capacity. Super Micro pre-announced its September quarter, estimating revenue of $18.5 billion to $19.5 billion against guidance of $14.5 billion to $15.5 billion. A $4 billion raise at the midpoint in one quarter tells you AI hardware demand is still running ahead of what even the company expected. Both stocks jumped at the open, pulled buyers back into tech, and the S&P 500 closed up 0.58% on Wednesday.
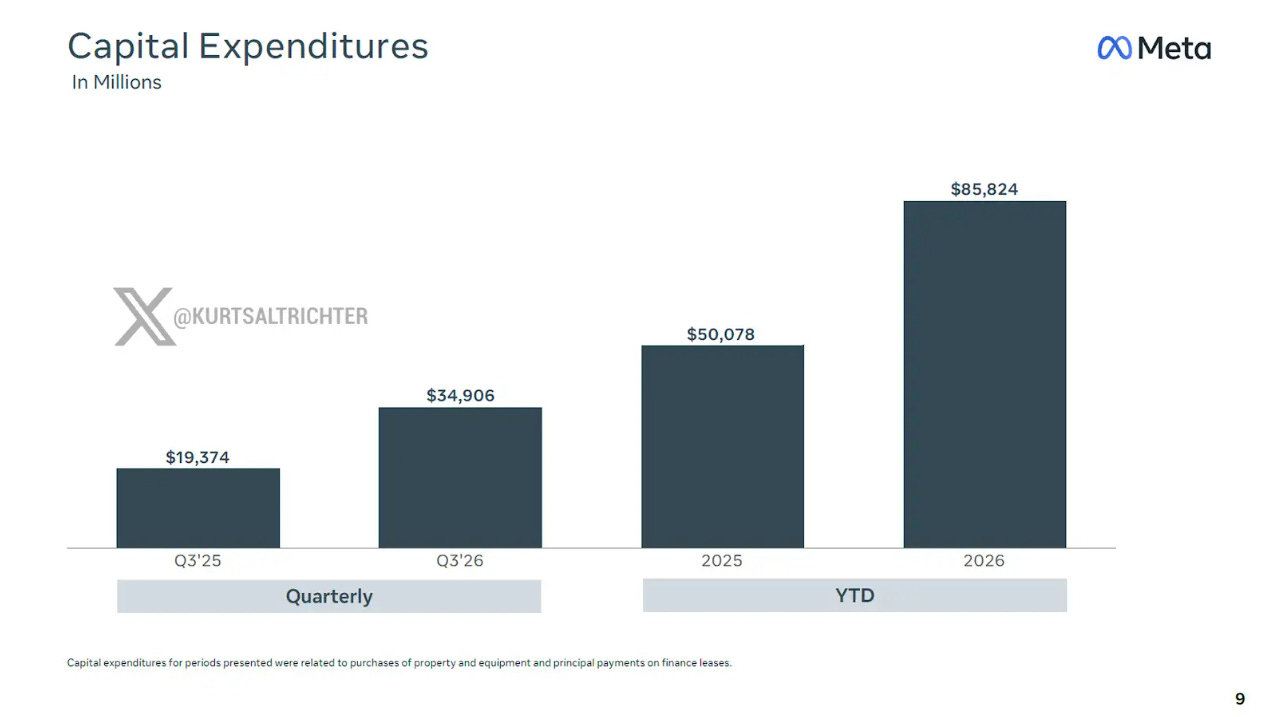
META, the first of the hyperscalers to report, delivered what amounts to a positive status quo. Revenue rose 26% to $64.6 billion in Q3 2026, beating the $63.3 billion consensus, which shows the core ad business is still growing fast enough to fund the AI build-out. That build-out is accelerating: capex hit $34.9 billion in the quarter, up 80% from $19.4 billion a year earlier, and management raised the low end of its 2026 range to $135 billion from $130 billion while saying it will keep investing aggressively in 2027. The report wasn’t jaw-dropping, and futures fell 0.96% before today’s open as investors digested the bigger spending bill. But revenue growing at 26% while capex climbs gives reasonable hope that this spending turns into returns, and nothing in the quarter suggests the AI investment cycle is slowing.
The test for tech earnings was simple: show that capital is still flowing into AI and starting to pay off. Three reports in, the answer is yes, and that is why stocks rallied Wednesday.
Consumer: Capital One Says Credit Is Holding
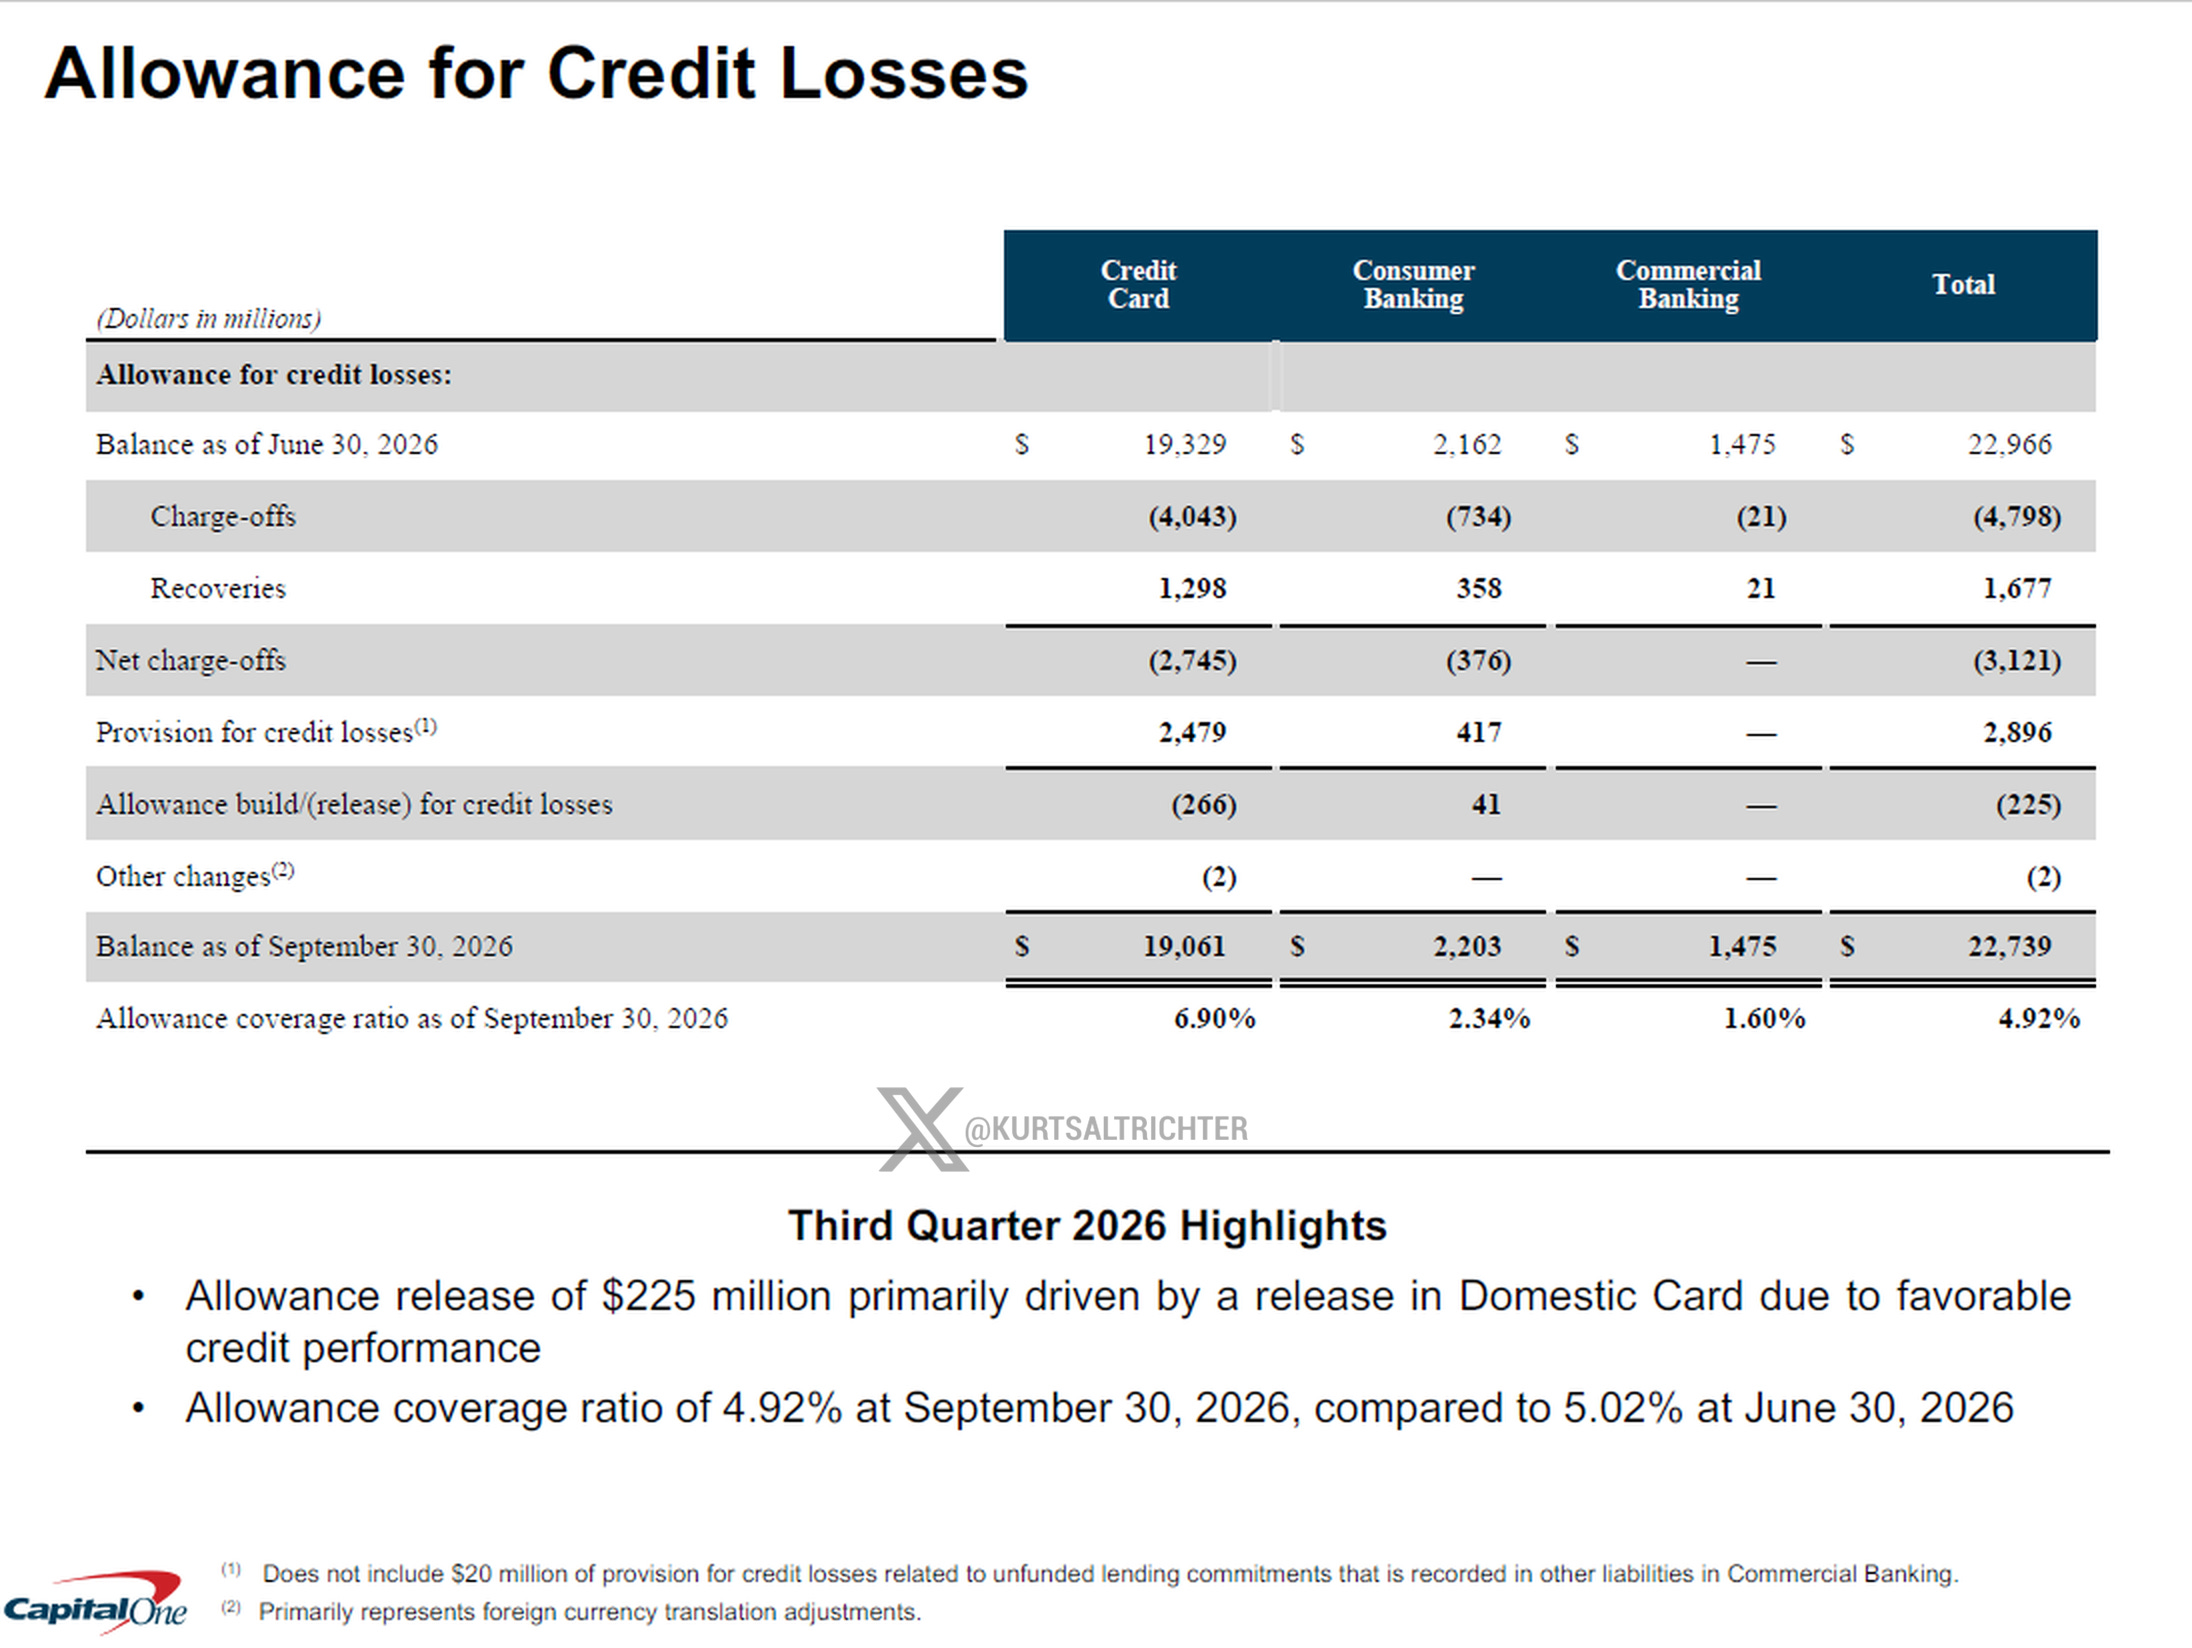
Capital One (COF) beat earnings estimates and struck an upbeat tone on the consumer. The key number was credit loss provisions, which came in $700 million below estimates. Capital One is setting aside less for bad loans because its borrowers are paying better than they expected.
That carries a little extra weight because Capital One’s card book skews more towards lower-quality borrowers, the first place consumer stress would show up. If that customer base is holding, it supports the “stable consumer” message JPMorgan gave earlier this month. One report is not a trend, but Wednesday was a net positive for stocks.
Credit Spreads: Any Warning Signs?
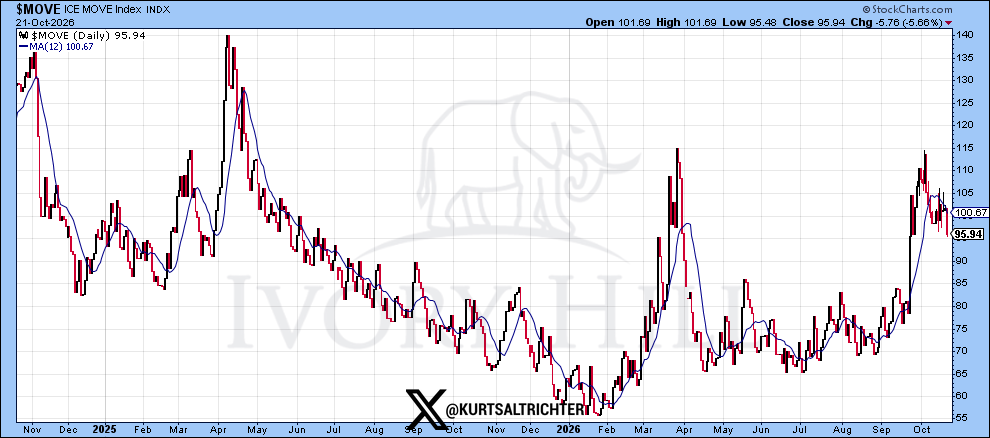
Earlier this week, I was monitoring the MOVE Index, which tracks Treasury volatility (the VIX for bonds). I watch it because if the AI trade breaks, it likely breaks through credit first. Defaults among neoclouds and other leveraged AI borrowers would force markdowns, which would force spending cuts, which would compress both growth and multiples across the sector. The MOVE jumped from about 80 in mid-September to roughly 114 in early October, and it has since eased to 95.94 as of October 21, so bond volatility is calming but still elevated.
The other half of that warning system is credit spreads, which show whether higher yields are straining corporate balance sheets. A credit spread is the yield spread between two bonds with similar maturities but different credit quality, typically a Treasury against a basket of corporate bonds. Investors demand extra yield for extra risk, so the spread measures how worried lenders are about corporate health.
When rates are low, widening spreads usually signal recession risk. When rates are high, as they are today, spreads become a real-time signal on whether companies can service their debt. The setup to be scared of is rising Treasury yields with widening spreads, because it means borrowing costs are climbing just as lenders lose confidence.
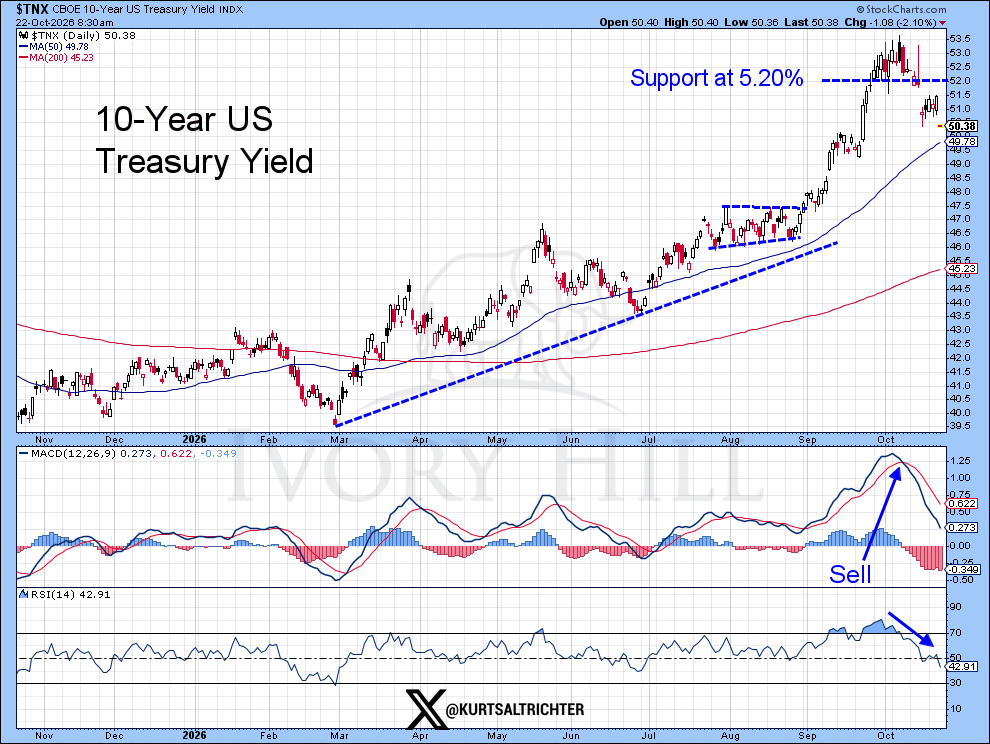
The first half of that setup is starting to fade as the 10-year Treasury yield has broken below 5.20% support and sits at 5.04%. This looks like a pause in the uptrend rather than a reversal, but the pressure from Treasuries is easing for now.
The second half, credit spreads, is where the early signs of stress are showing up, specifically in junk bonds. The chart below is the spread, the ICE BofA US High Yield Option-Adjusted Spread, which measures the extra yield investors demand to hold junk bonds over Treasuries. Because junk issuers are the most leveraged borrowers in the market, the junk spread is usually the first place to see corporate stress. My warning threshold is 5.00%, the level where both the late 2018 selloff and the 2022 bear market topped out. Above that, the bond market is pricing in real default risk.
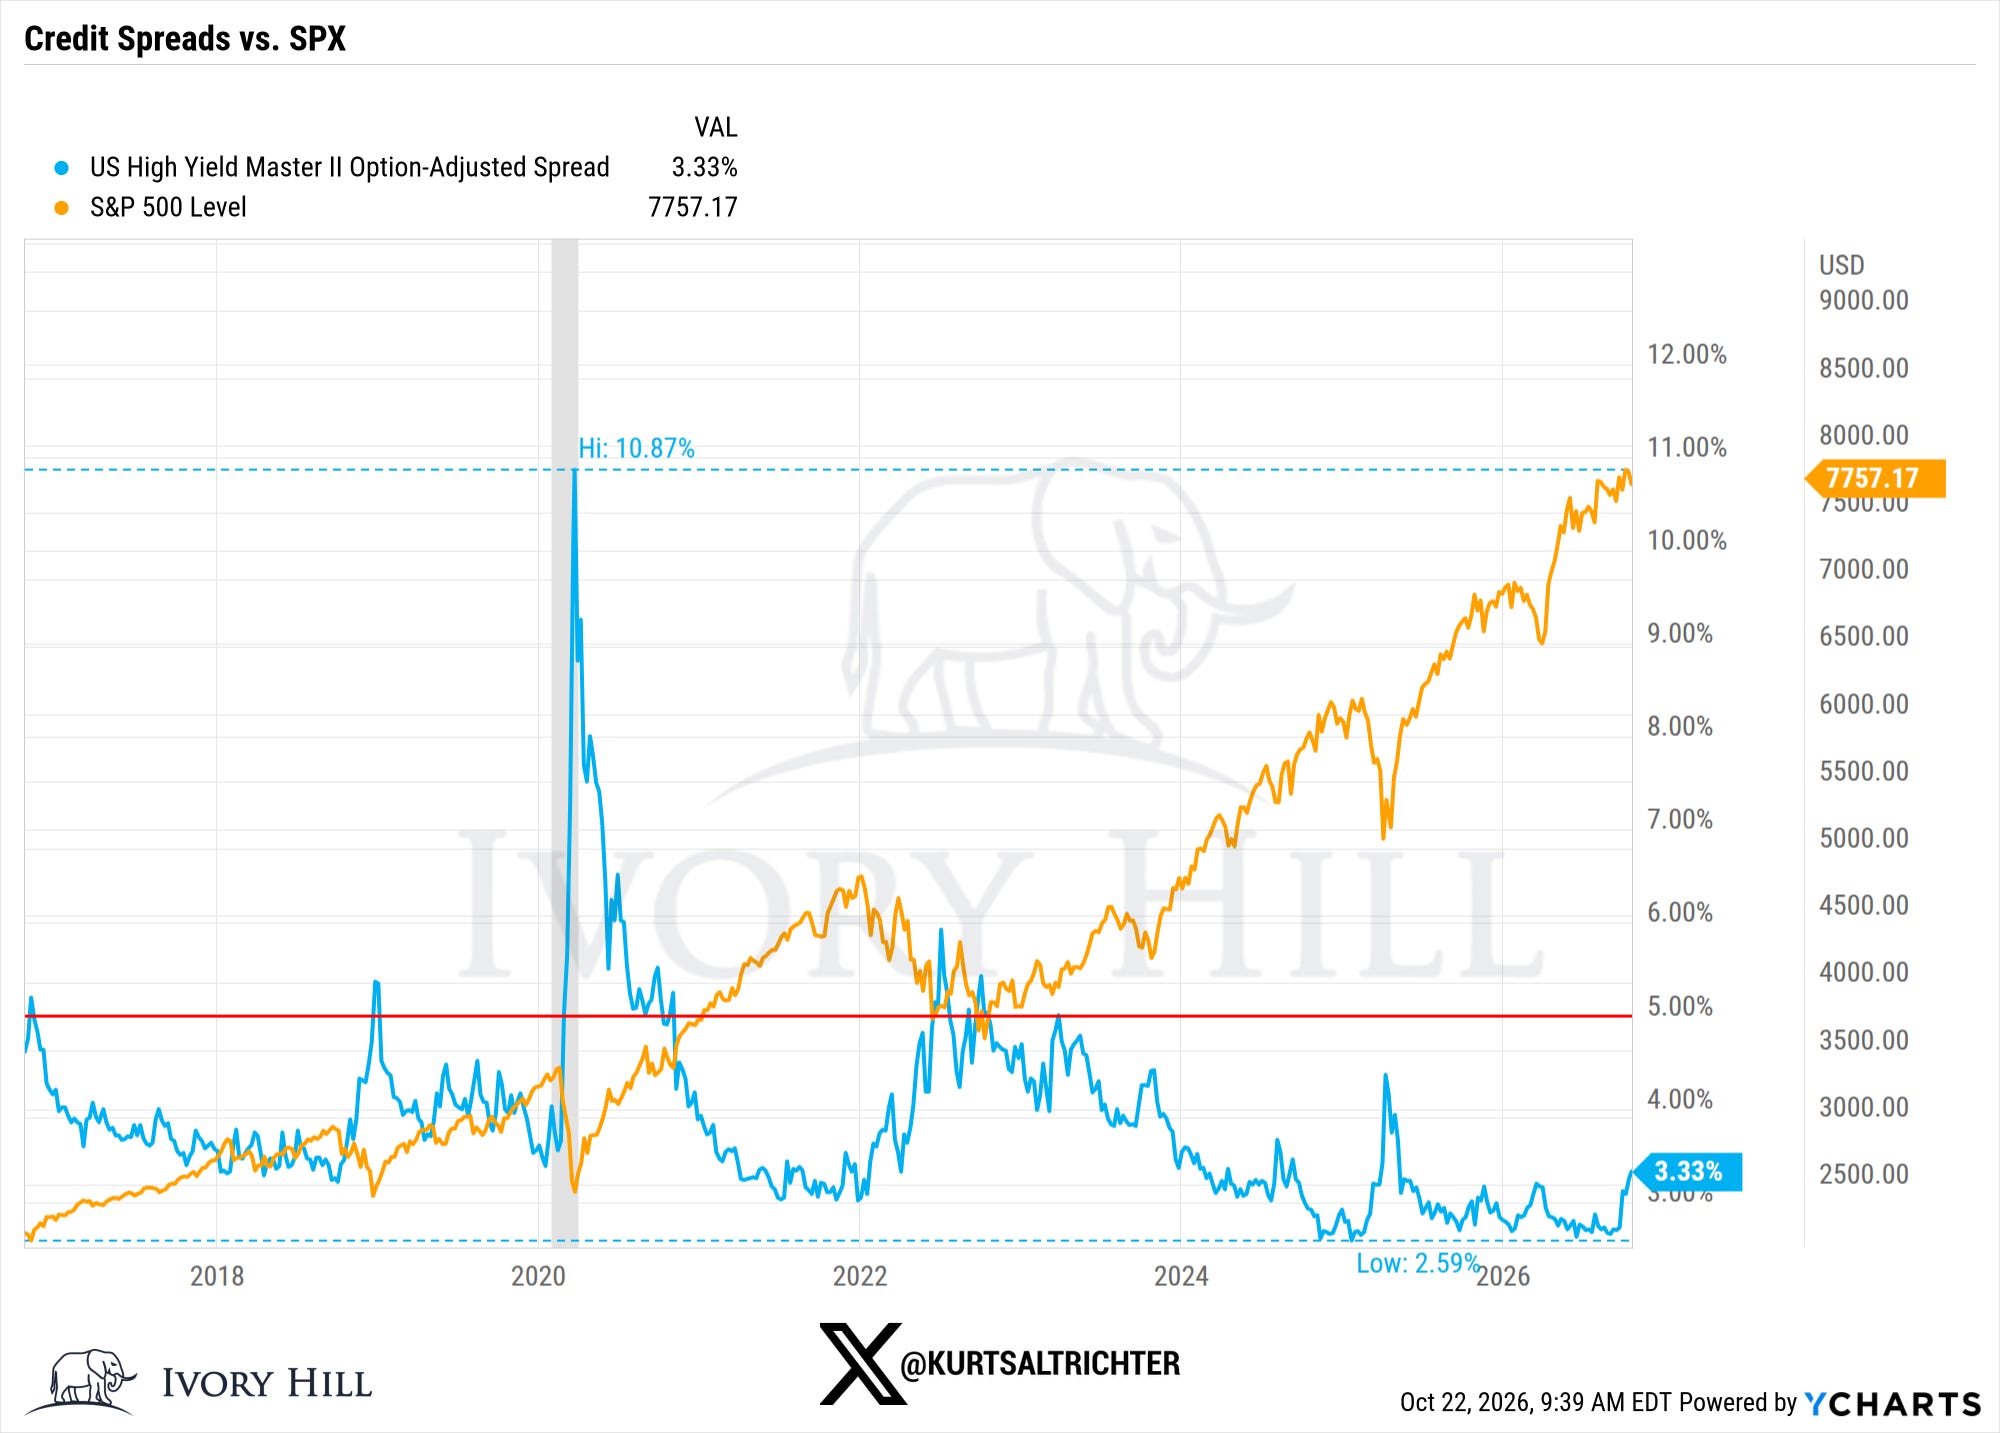
The junk spread has jumped from its 2.59% low to 3.33% over the past several weeks. That is worth keeping an eye on, but 3.33% is still well below the 5.00% warning line and nowhere near the 10.87% spike of March 2020.
The chart below is the junk yield, the total yield on B-rated junk bonds, which is what a typical junk issuer actually pays to borrow. It has climbed from about 6.5% in January to 8.26%, its highest level since late 2023. Most of that climb since January came from higher Treasury rates, but over the past few weeks the 10-year fell while the junk yield kept rising. That means the recent move is coming from a wider junk spread, in other words from credit risk in the weakest borrowers, not from Treasury rates.
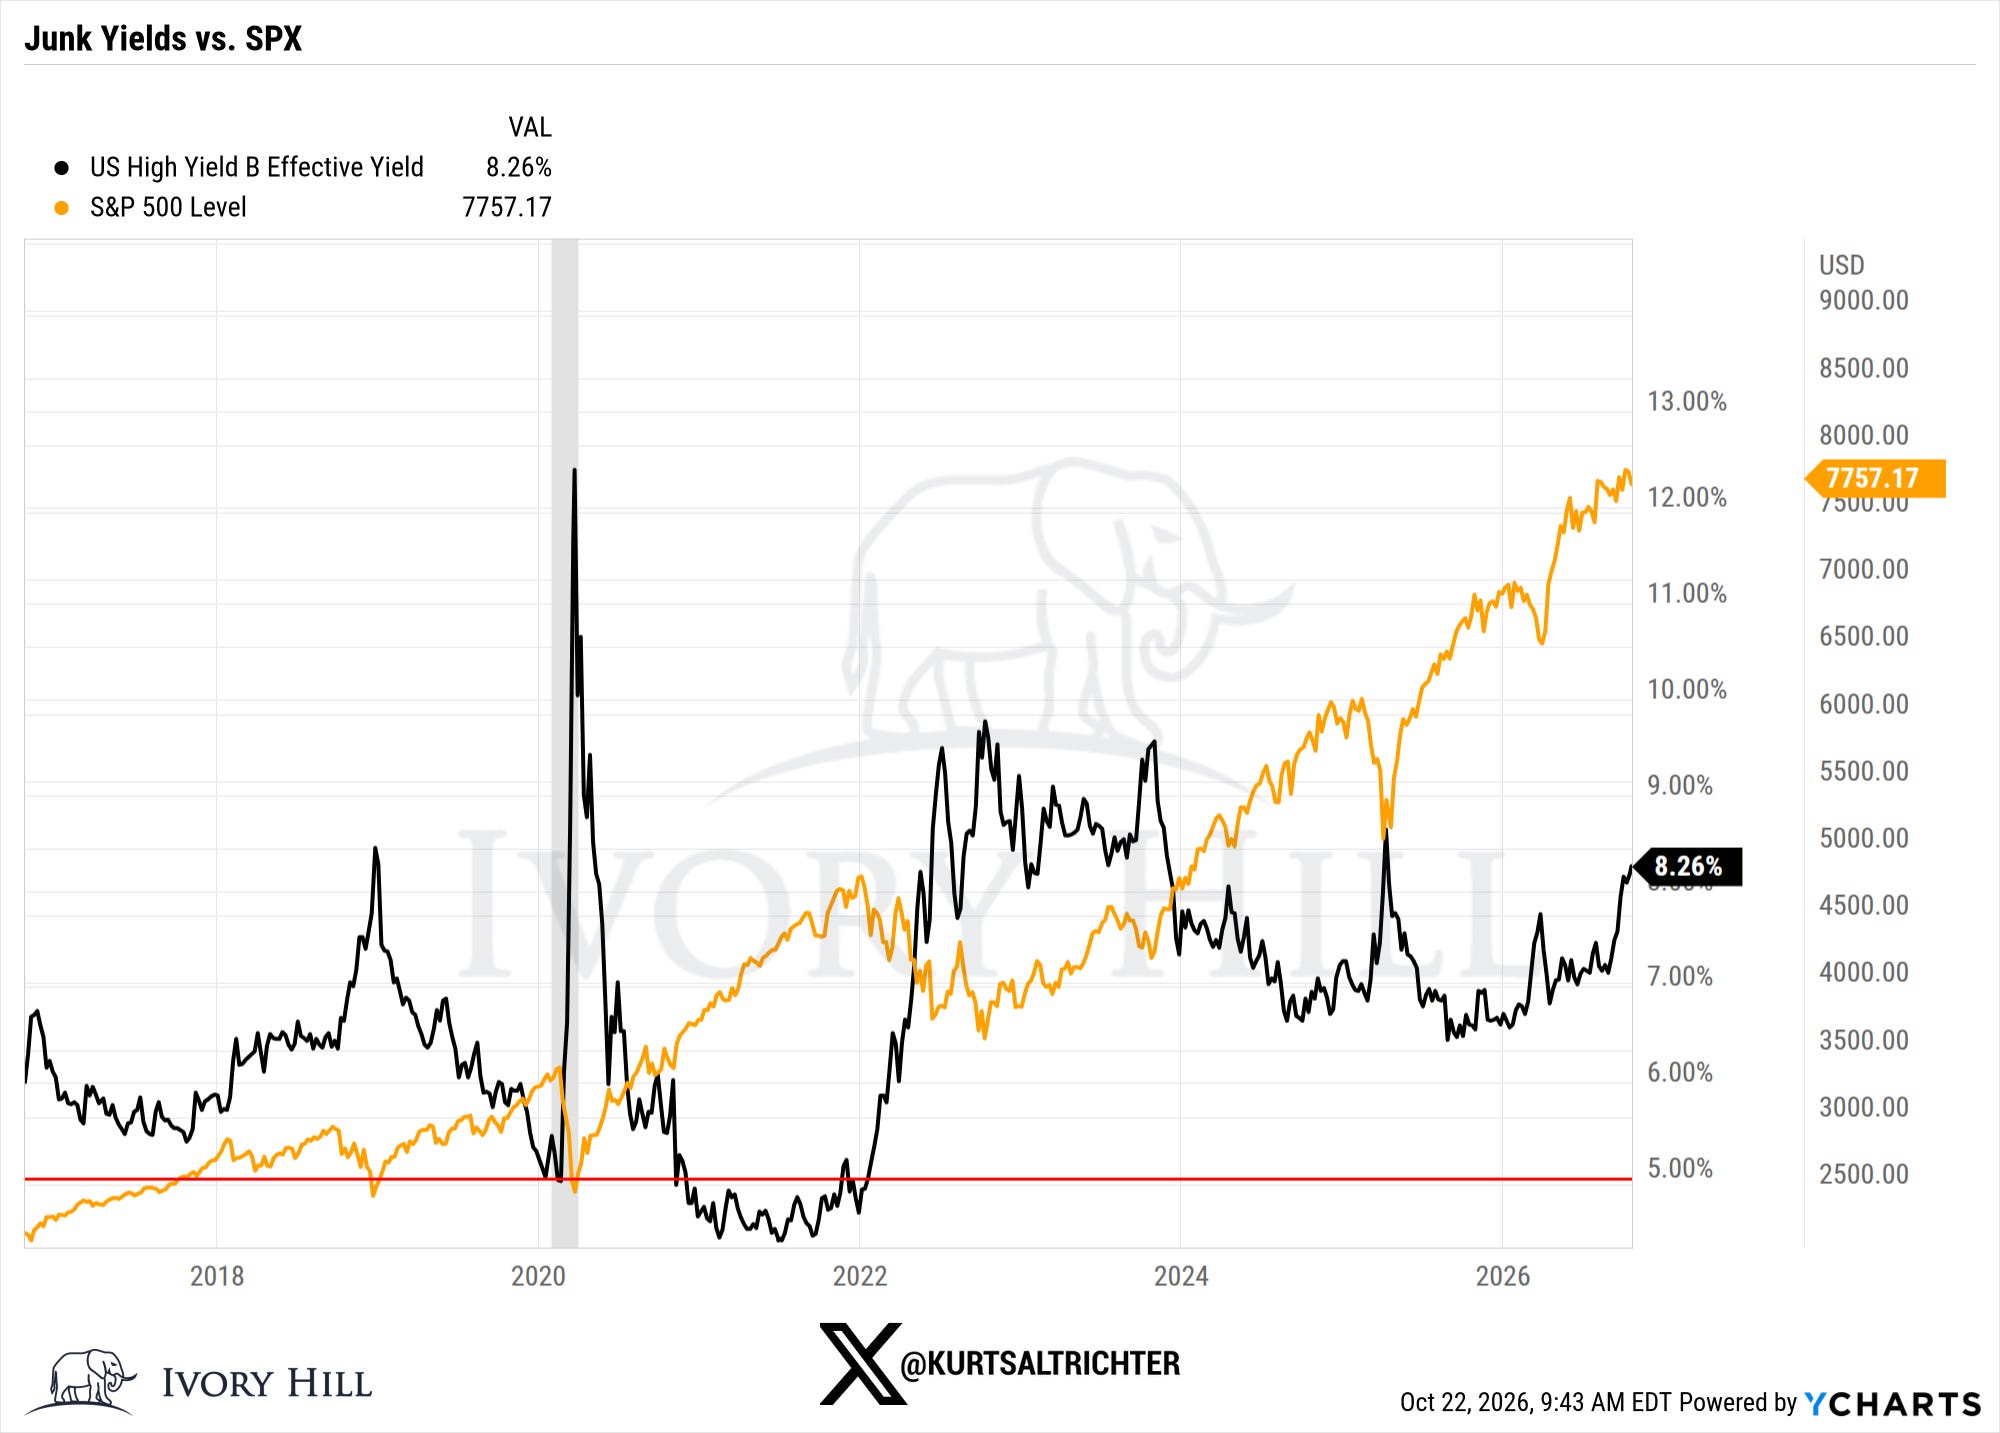
Putting the junk yield next to the S&P 500 shows why this matters for stocks. The big junk yield spikes in late 2018, 2022 and April 2025 all lined up with major S&P 500 drawdowns, because when borrowing costs jump for the weakest companies, equity investors start pricing in defaults and slower growth. This time is different so far: the junk yield has climbed to 8.26% while the S&P 500 closed at a record 7,757 on October 21. Stocks are not treating higher junk yields as a systemic threat yet, and a real drawdown would most likely start when the junk yield spikes rather than grinds higher.
Lenders are demanding more to hold the riskiest debt, but they are nowhere close to pulling back from the credit market as a whole, which fits the view that AI debt problems are concentrated in specific names rather than spreading across corporate America.
I will keep watching the junk spread and the MOVE Index for signs of weakness. As long as the junk spread stays below 5.00%, weakness in AI stocks looks like a sector correction, not the end of the bull market, and is more than likely a buying opportunity. I do expect volatility to continue through midterms, so start putting together your buy list now.
And remember - The one fact pertaining to all conditions is that they will change.
Follow me on X for more updates.
Best regards,
-Kurt
Schedule a call with me by clicking HERE
Kurt S. Altrichter, CRPS®
Fiduciary Advisor | President
Disclosure
The RiskSignal Report is published by Ivory Hill, LLC. All opinions and views expressed in this report reflect our analysis as of the date of publication and are subject to change without notice. The information contained herein is for informational and educational purposes only and should not be considered specific investment advice or a recommendation to buy or sell any security.
The data, models, and tactical allocations discussed in this report are designed to illustrate market structure and positioning trends and may differ from portfolio decisions made by Ivory Hill, LLC or its affiliates. Investing involves risk, including the possible loss of principal. Past performance is not indicative of future results.
Ivory Hill, LLC, and its members, officers, directors, and employees expressly disclaim any and all liability for actions taken based on the information contained in this report.
Super Micro pre-announcing September quarter revenue of $18.5 to $19.5 billion against guidance of $14.5 to $15.5 billion is a big step-up in one quarter. Pairing that with Meta's capex of $34.9 billion makes the AI hardware demand picture hard to ignore.