

The full Gamma Report stat pack is attached as a PDF, covering where the S&P 500 sits against its 7,690 gamma flip, positioning, breadth, and expected moves as of the October 2, 2026 close. If you’d like this data in your inbox daily, just reply to this email.

The stock market’s fear gauge, the VIX, closed Friday at 15.31, near its lowest levels of the year. The bond market’s fear gauge, the MOVE Index, closed the same day at 107.29 after jumping roughly 35% in September. When those two indices disagree this badly, the bond market has usually been right first, and as of last week, credit spreads have started siding with bonds. If you don’t understand the credit markets, you do not understand the stock markets.
Two fear gauges, two different markets
The VIX (formally the Cboe Volatility Index) measures what traders are paying for insurance on the S&P 500 over the next 30 days. Cheap insurance means stock investors see little danger ahead.
The MOVE Index does the same for Treasury yields. A reading of 107 means the options market expects the 10-year Treasury yield to swing about 6.7 basis points per day (a basis point is 0.01%). That sounds small until you remember that Treasury yields set the price of mortgages, car loans, corporate debt, and the discount rate every stock valuation is built on.
One bond rule makes the rest of this report click: when yields rise, the price of bonds you already own falls, because new bonds now pay more than yours. The longer your bond’s maturity, the harder that price drop hits.
The third signal in this report is the credit spread, which is the extra yield that weaker companies must pay above Treasuries to borrow money. When spreads widen, lenders are demanding more pay for the risk of not getting their money back.
The risk changed markets in 2026
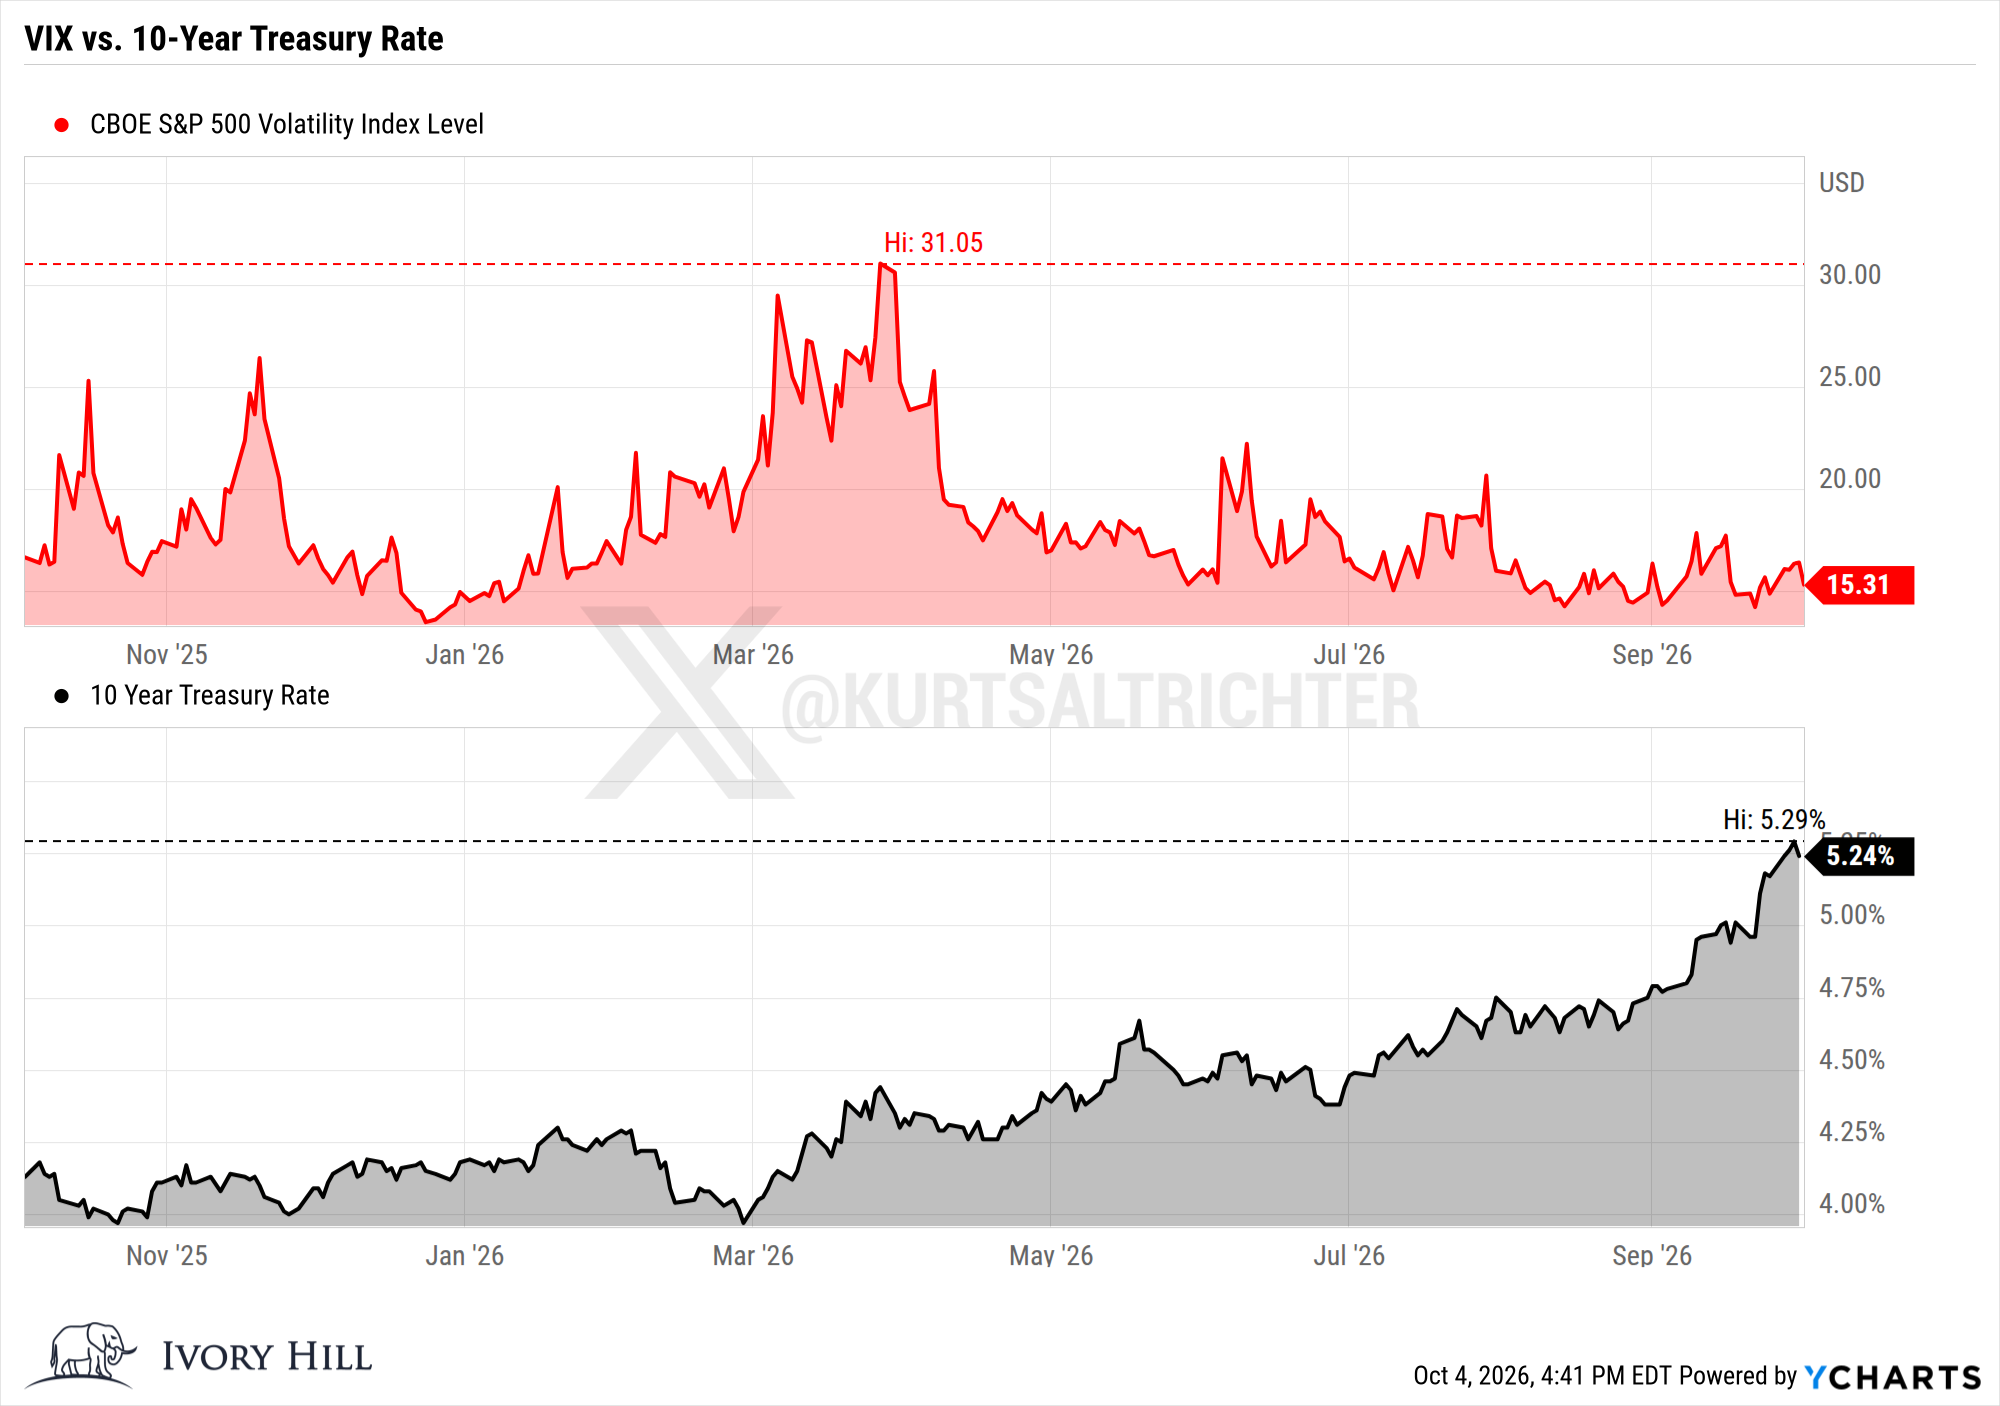
The 10-year Treasury yield ended 2025 at 4.14% and closed Friday at 5.28%, a rise of 114 basis points in 9 months. Earlier last week it touched 5.34%, its highest level since 2002, and the quarter that ended in September produced the largest quarterly jump in the 10-year yield this century.
Chart 1 covers October 2025 to October 2026. The VIX’s closing high this year was 31.05 in late March, when the oil spike tied to the Iran war hit markets. It has made lower highs ever since. The 10-year yield in the bottom panel has done the opposite, climbing steadily from about 4% to new highs. (The chart uses Treasury’s official daily rate, which printed 5.24% on October 2 versus the 5.28% market close.)
Equity traders got paid through all of it. The S&P 500 is up 12.81% year to date through October 2, 2026. Over the same period of time, TLT, the largest long-term Treasury ETF, is down about 11% in price and down 7.81% even after counting its interest payments.
Friday’s jobs report proved the bond market has stopped listening to the economy
The September jobs report was weak on every line. Employers added 29,000 jobs against a Bloomberg survey estimate of about 85,000, revisions erased 60,000 jobs from July and August, turning July negative at minus 10,000, unemployment rose to 4.2%, and annual wage growth slowed to 3.0%, the weakest since May 2021.
For 40 years, a report like that sent a panic into Treasuries and pushed yields down. On Friday, the 10-year yield dropped to 5.18% right after the release, then reversed and closed at 5.28%, up 4 basis points on the day. Stocks took the bad news as good news: the S&P 500 rose 0.73% to 7,722.72, the Nasdaq gained 1.19%, and the VIX fell 6.59%.
The bond market ignored the jobs data because it is pricing in Washington’s borrowing. The 10-year inflation-protected Treasury pays a real yield of 2.92%, which implies investors expect only about 2.36% annual inflation over the next decade. Most of that 5.28% yield is extra pay that lenders now demand for funding a government that keeps running massive deficits. The printing press and the deficit debase the dollar, and bond buyers are pricing that in.
The Fed made the picture worse. On September 16, 2026, it raised rates 25 basis points to 3.75% to 4.00%, its first hike since 2023, citing energy prices driven by the Middle East conflict. A rate hike does not produce a single barrel of oil. All it did was raise borrowing costs at the short end while long-term yields kept climbing on their own, which tells you the Fed has no control over the part of the curve that sets your mortgage rate.
The hedge became the hazard
The classic 60/40 portfolio (60% stocks, 40% bonds) rests on one assumption: when stocks fall, bonds rise and cushion the blow. Chart 2 shows what happened to that assumption over the past 5 years (October 2021 to October 2026). SPY gained 77.24% in price. TLT lost 46.69%.
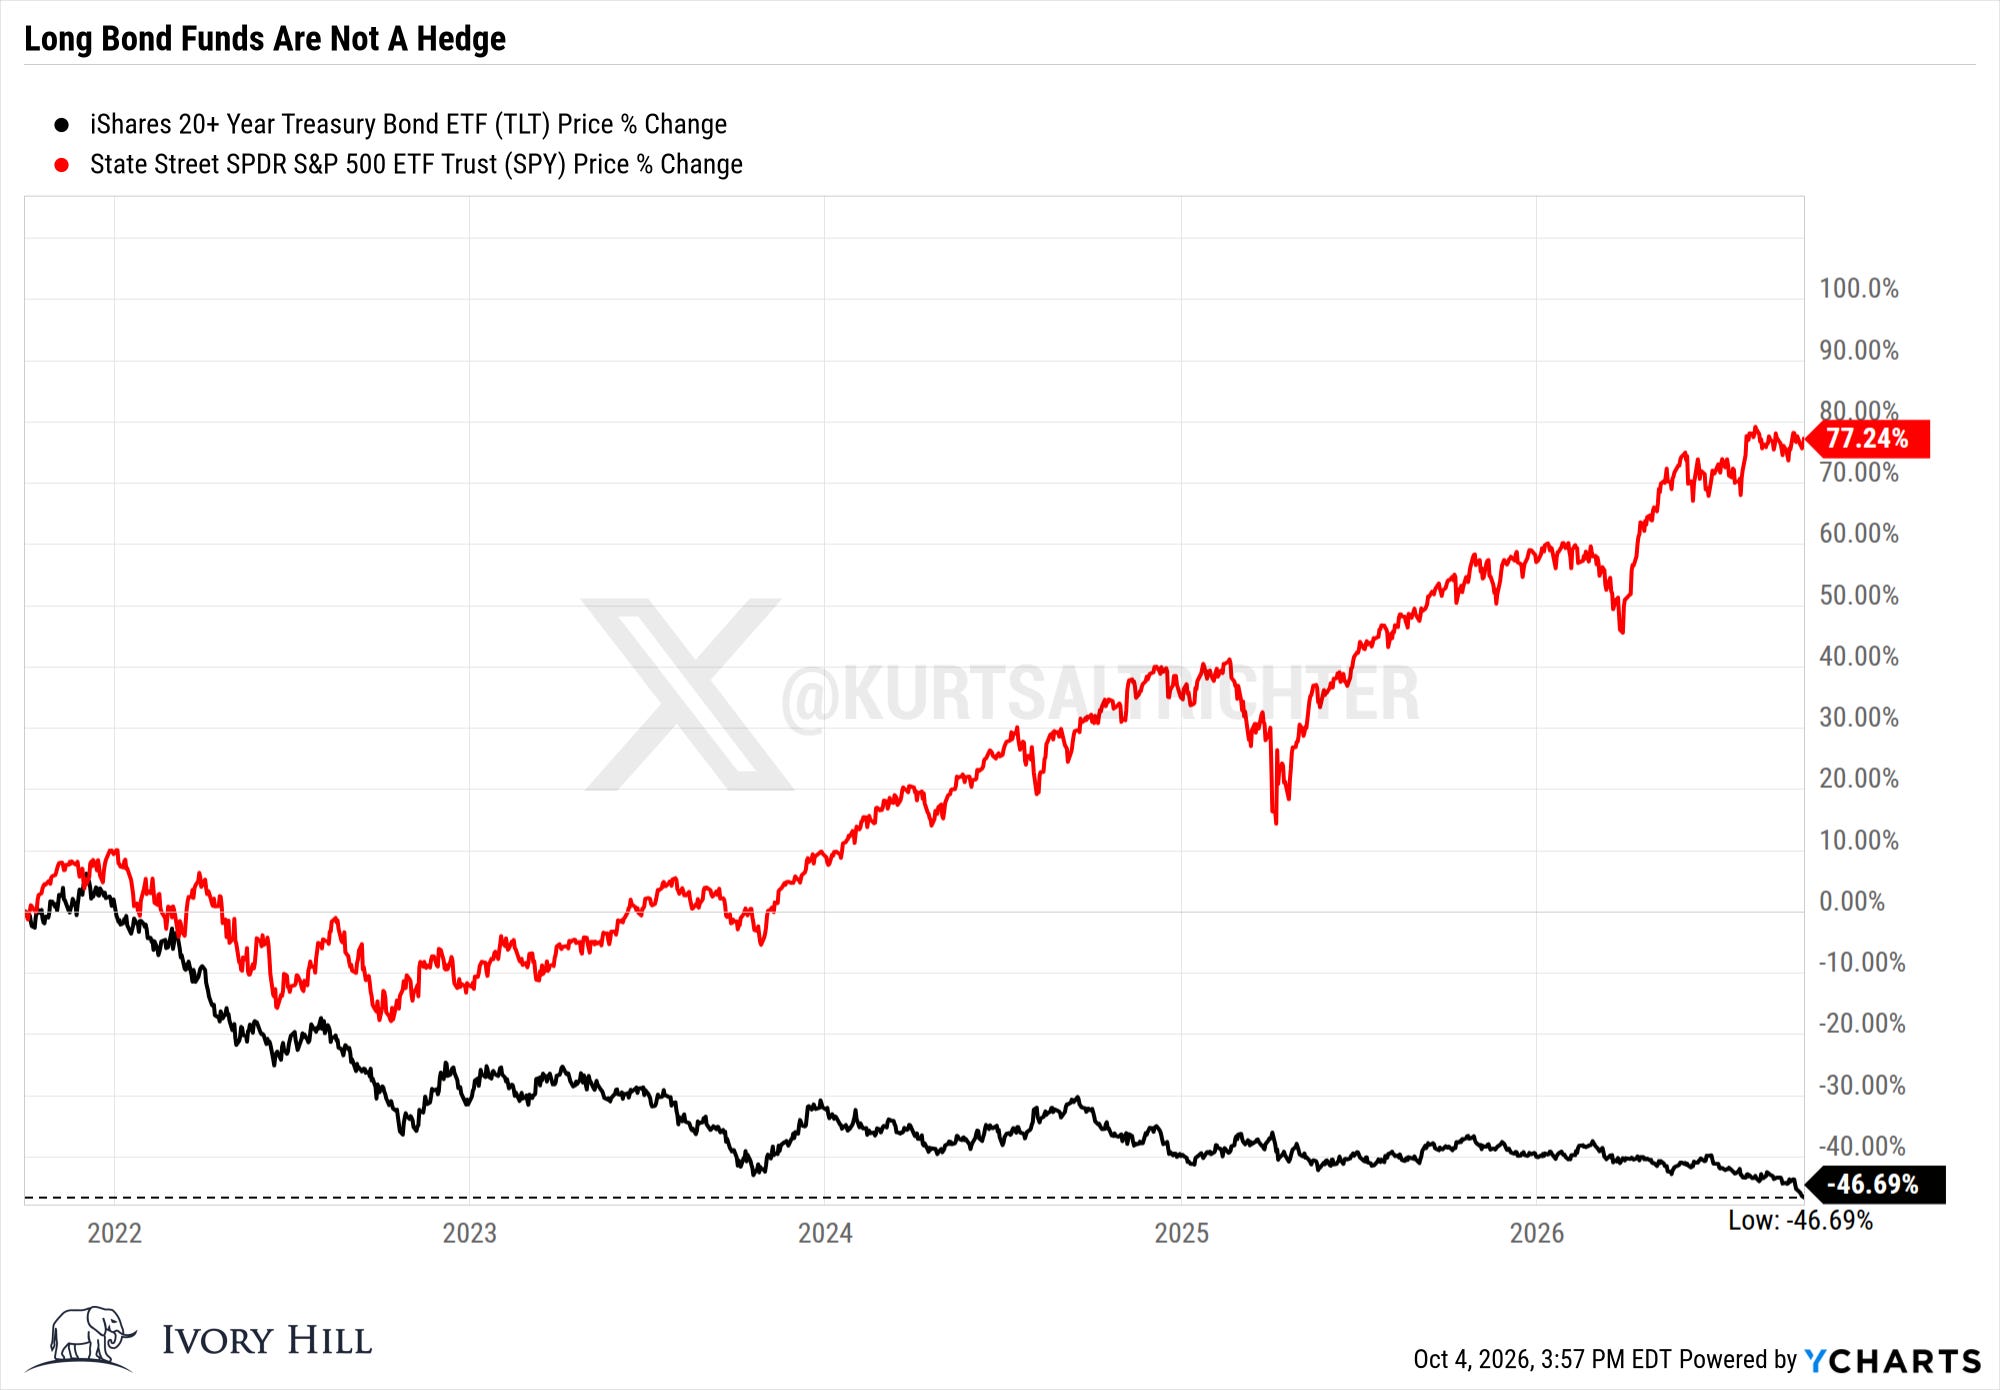
Long-term Treasuries fell this hard because they hold bonds maturing 20 to 30 years out, so every rise in yields compounds into a large price loss. TLT posted the lowest close in its history on September 23, 2026 at $80.46, then fell further to $77.48 on October 2. Anyone who bought long Treasuries for safety in late 2021 has sat through a drawdown worse than the S&P 500’s 2022 bear market.
In 2022, stocks and long bonds fell together, and in 2026 long bonds fell while stocks rose, so the bond sleeve failed at its one job both times.
The MOVE Index moves first
The MOVE Index rose 35% in September through September 28, a monthly jump seen only 8 times since 2008. During the week of September 25 alone, it climbed about 30%, its biggest weekly gain since the April 2025 tariff shock.
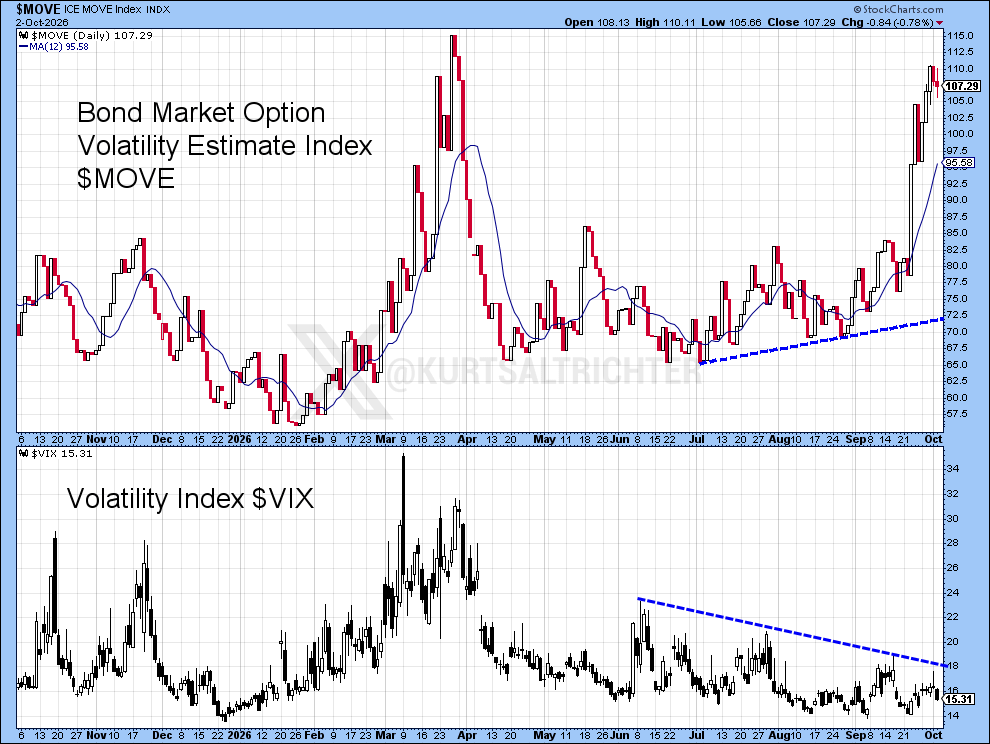
Chart 3 runs from October 2025 to October 2, 2026, and the two blue lines tell the story. On the MOVE (top panel), the rising line connects higher lows since early July: bond volatility has been building a floor for 3 months, and in late September it exploded off that floor to 107.29. On the VIX (bottom panel), the falling line connects lower highs since June: stock volatility keeps fading.
That divergence is important because the MOVE has a track record of leading the VIX. It flashed turbulence before the VIX in early 2022, in March 2023, and in the opening days of the 2026 Iran war. Treasury yields are the base interest rate for the entire financial system, so when that base rate swings 7 basis points a day, every lender, insurer, and pension fund has to recalibrate its risk.
Credit is the second domino, and it has started to tip (still very early).
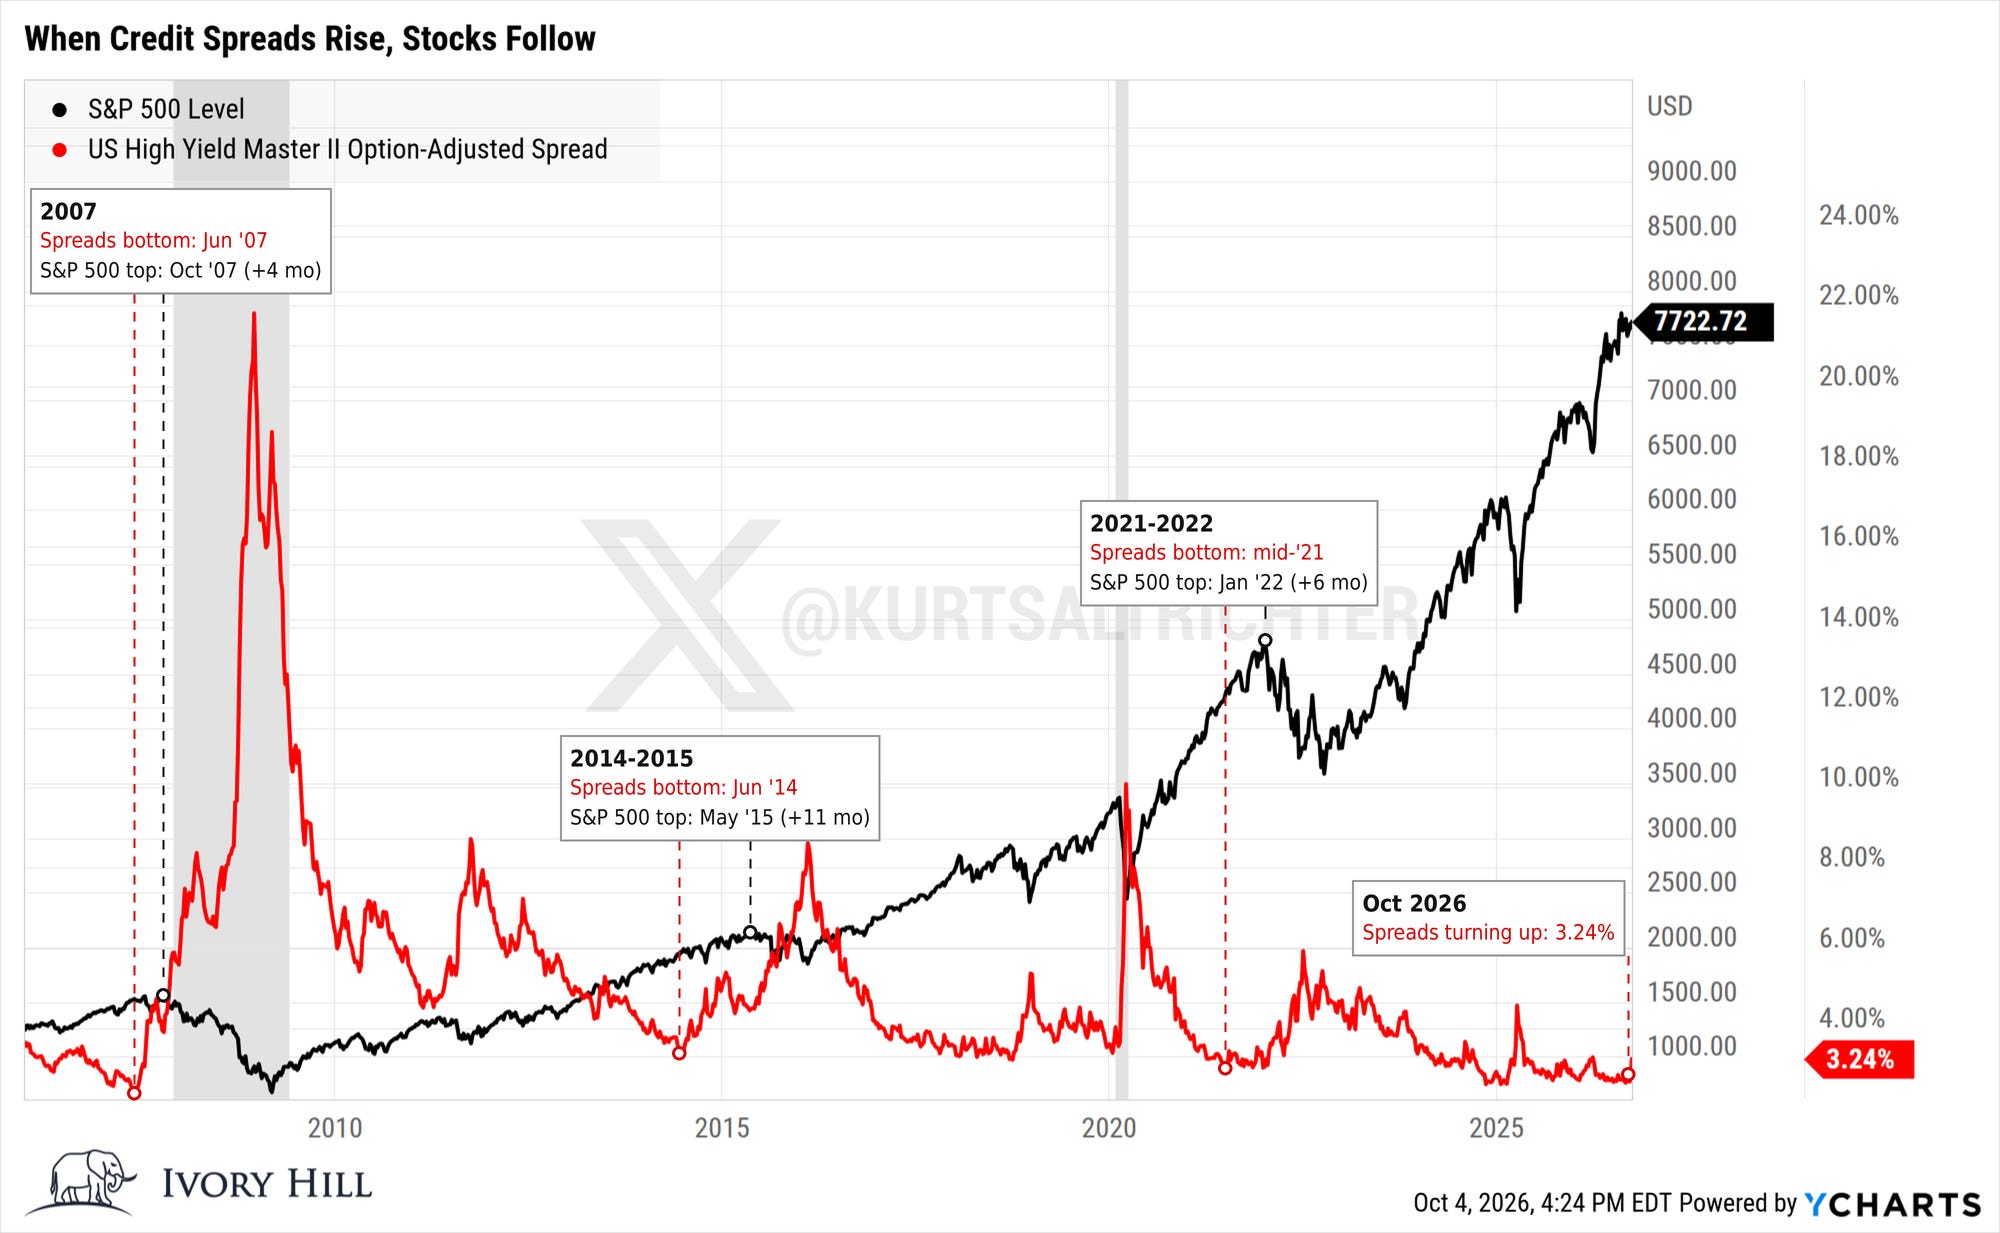
The intermarket chain runs in order: bond volatility rises first, credit spreads widen second, and stocks crack last. Chart 4 shows that order from January 2006 to October 2026. In 2007, the junk bond spread bottomed and started rising months before the S&P 500 peaked in October 2007. In mid-2014, spreads turned higher roughly a year before the S&P 500 topped in May 2015 and fell into its August 2015 and early 2016 selloffs. In the second half of 2021, spreads bottomed again ahead of the January 2022 stock peak. Lenders spotted the stress first every time, because bondholders only care about getting repaid and watch balance sheets more closely than stock buyers do.
Stage 1 of that chain is done. Stage 2 began last week.
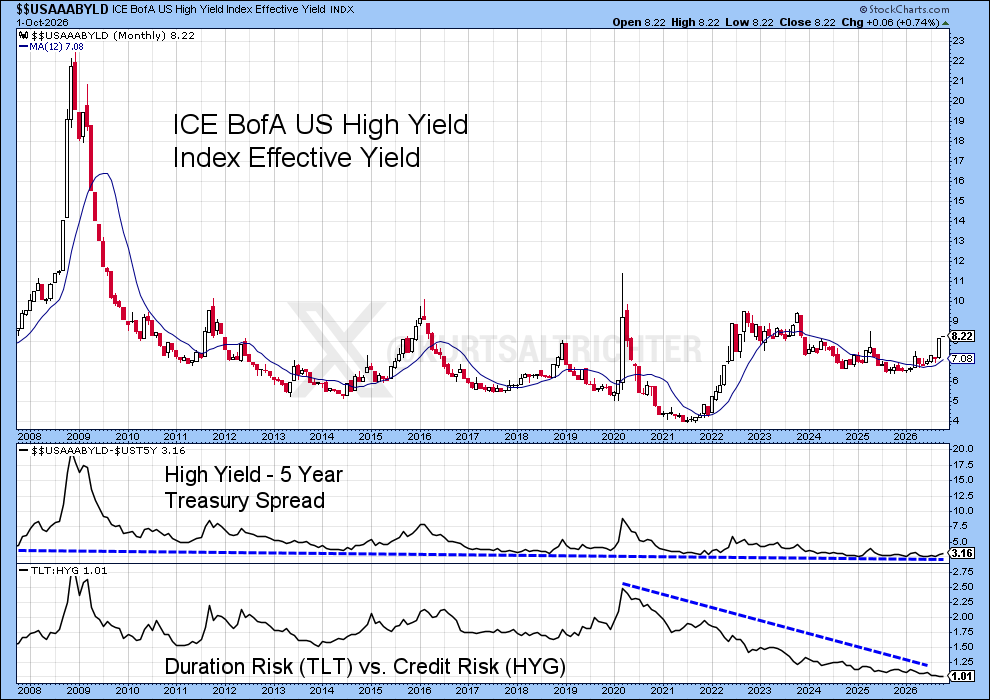
The high-yield (junk bond) spread widened from 2.93% on September 25 to 3.24% on October 1, a 31 basis point jump in 4 trading days. Chart 5’s top panel shows the all-in yield on junk bonds at 8.22% as of October 1, 2026, breaking above its 12-month average of 7.08%. Companies with weaker balance sheets now pay more than 8% to borrow, and the ones facing large debt maturities in 2026 and 2027 must refinance at those rates or default. Rising rates on revolving credit can have a big negative impact on businesses that don’t make any money or have very small margins.
The bottom panel is the price ratio. It divides TLT by HYG (a junk bond ETF) to compare duration risk with credit risk. The ratio has fallen from about 2.5 in 2020 to 1.01 today, meaning investors spent 6 years preferring junk bonds over long Treasuries, a trade that works only while spreads stay tight. Spreads are still well below the long-term average of 5.17%, so they have plenty of room to widen, and a rising MOVE is what historically pushes them there.
The bull case, and why it falls short
Bulls will argue three things: the weak jobs report likely ends Fed hikes, spreads remain historically tight, and a 15 VIX simply reflects a strong market. Each argument has a hole.
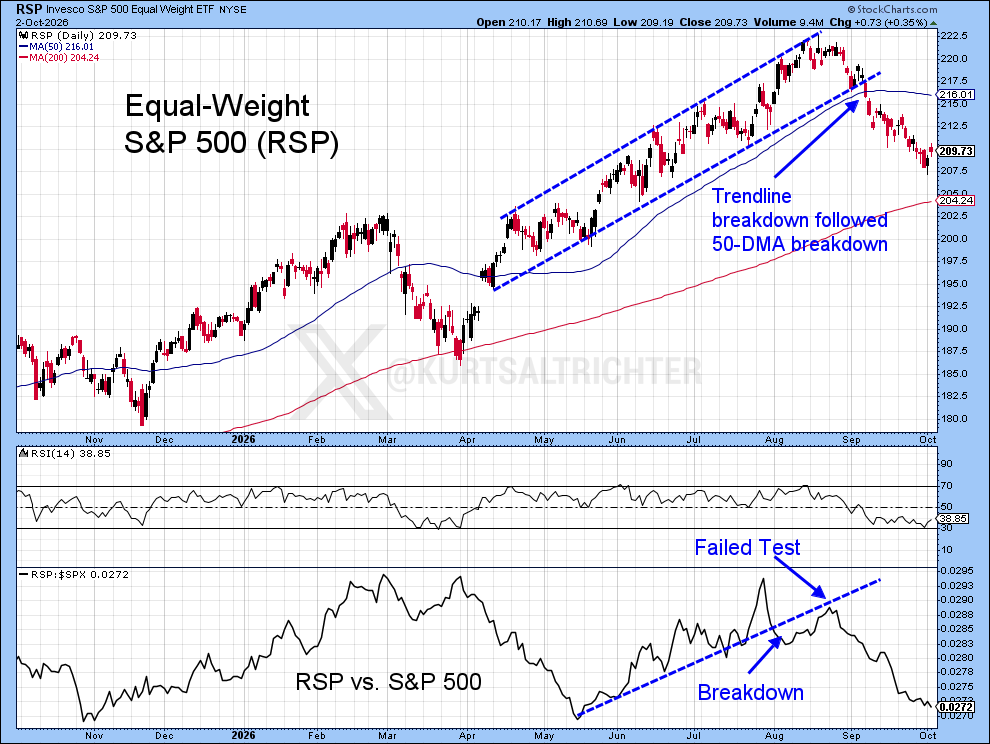
A Fed pause does nothing for long-term yields, which climbed without any help from the Fed and ignored Friday’s jobs data entirely. Tight spreads are a starting point with no cushion, which means a widening cycle has further to run. And the strong market is narrow. The S&P 500 is up 12.81% this year, but the equal-weight version is up only 9.47% through October 2, and in September roughly 3/4 of S&P 500 stocks fell while 4 stocks delivered about half the index’s 2026 gain. A low VIX on top of a handful of chipmakers is a crowded trade that breaks hard when rates move.
What it means for you
Check the duration on your bond funds. Duration is listed on every fund’s fact sheet, and it tells you roughly how much the fund loses for each 1 percentage point rise in yields. A fund with a duration of 15 loses about 15%. With the Fed at 3.75% to 4.00%, short-term Treasuries and T-bills pay close to that rate without the price swings that have gutted long bond funds.
Stop counting on long Treasury funds to hedge your stocks. When the threat is rising rates, long bonds and stocks fall together.
Do not chase an 8% junk bond yield. At a 3.24% spread, you are paid very little extra for lending to the weakest companies right as their borrowing costs jump.
Watch two levels. If the MOVE breaks above its March 2026 high near 115 and the junk spread climbs above 4%, rate stress will have reached corporate balance sheets, and the VIX at 15 will not survive it. The next tests are the Fed decision on October 28, 2026 and Treasury’s quarterly refunding announcement in early November, which tells the market how much more long-term debt is coming. If supply keeps climbing, mortgage rates and corporate refinancing costs go higher, and stocks will be the last asset to reprice.
There is a difference between Treasury Funds and individual Treasuries. Buying an individual Treasury at today’s 5.28% 10-year yield (as of October 2, 2026) locks in that income for the full 10 years, and if you hold it to maturity, you get your full principal back no matter how far prices swing in between. A bond fund never matures because it keeps selling aging bonds and buying new ones to hold its duration steady, so its share price moves with every change in rates and there’s no maturity date to wait for that guarantees your money back. That difference matters because an investor who needs a known sum on a known date, like a retirement paycheck or a tuition bill, can count on the individual bond to deliver it, while the bond fund leaves that same investor guessing what the money will be worth when they need it.
Quick hits on the rest of the macro
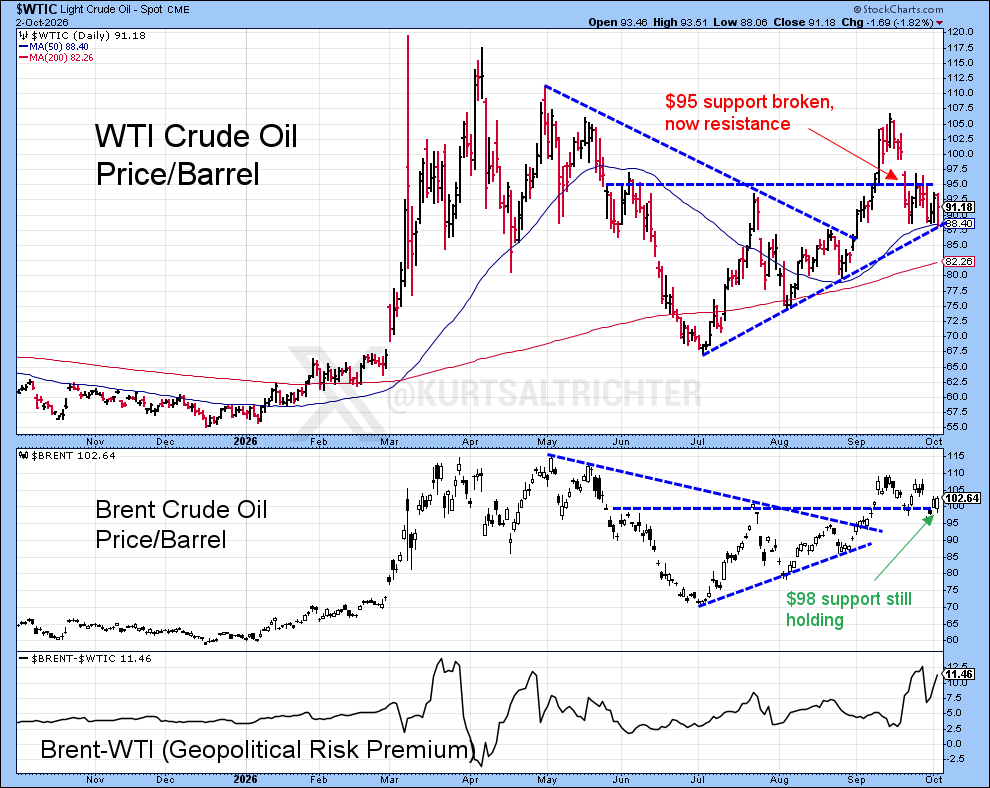
Oil: WTI closed at $91 last week and remains stuck below $95 resistance because the dollar’s breakout makes every dollar-priced barrel more expensive for overseas buyers.
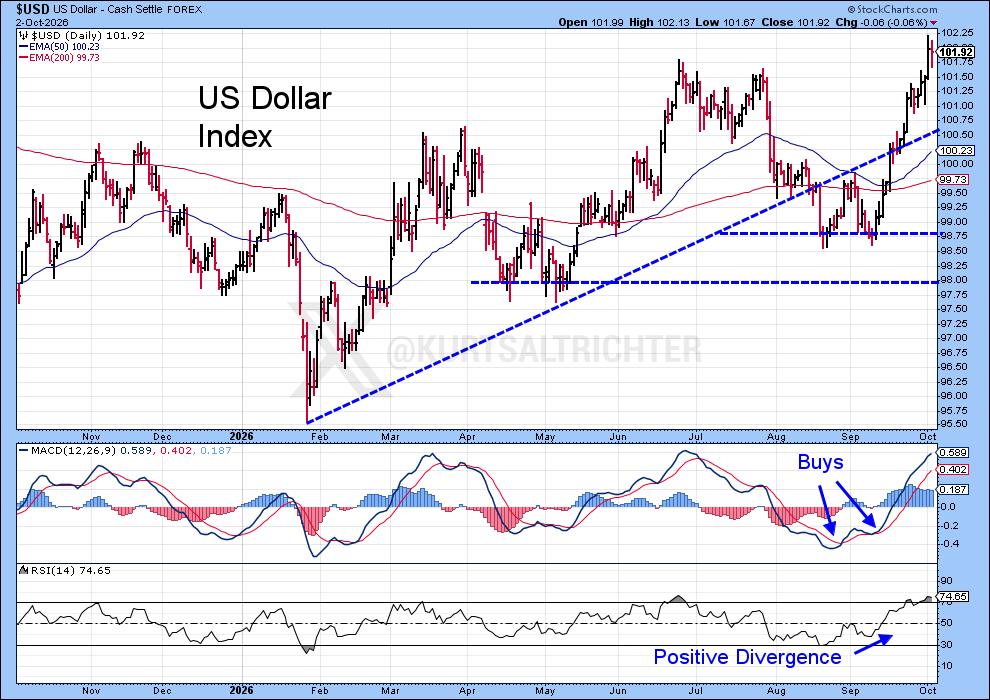
U.S. dollar: The Dollar Index closed near 102 last week (October 2, 2026), breaking out above its summer highs around 101.75. The sequence behind it starts with the oil shock, which pushed the Fed into a September 16 rate hike, while heavy Treasury borrowing lifted the 10-year yield to 5.28%, the highest since 2002. Those yields now pay far more than bonds in Europe or Japan, so global money is selling other currencies to buy dollars and capture that gap. The stronger dollar squeezes every foreign company and government that has to repay dollar debt, and it's a headwind for commodities because they're priced in dollars and get more expensive for overseas buyers every time the dollar climbs. That pressure is already showing in WTI stalling below $95.
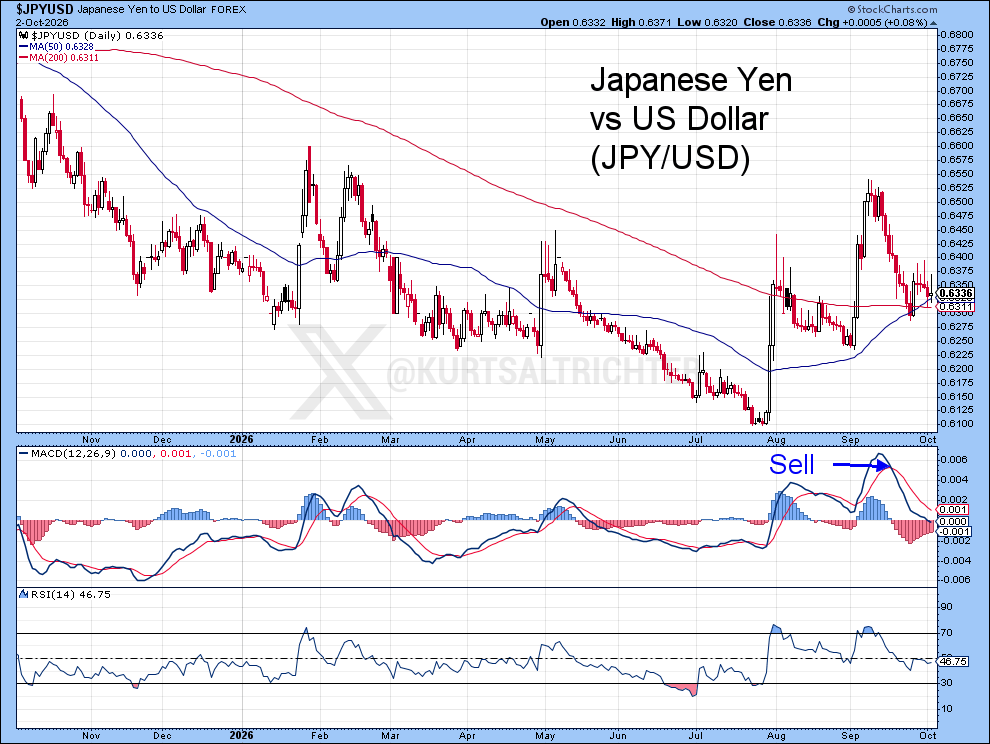
Japanese yen: The yen closed at 0.6336 last week (about 158 yen per dollar), and Treasury Secretary Bessent wants it stronger. He called the yen “very undervalued,” backed the first joint U.S.-Japan yen-buying intervention in 28 years in July after it hit roughly 164 per dollar, and keeps pressing the Bank of Japan to raise rates. The rally faded from its September high near 0.6550 because 5.28% U.S. Treasury yields keep paying traders to borrow cheap yen and buy U.S. assets, which pushes the yen lower. That leaves a carry trade built on a currency the U.S. Treasury is actively trying to push higher, and if Bessent and the Bank of Japan force the yen back above that level, those traders have to sell U.S. stocks and bonds at the same time to repay their yen loans.
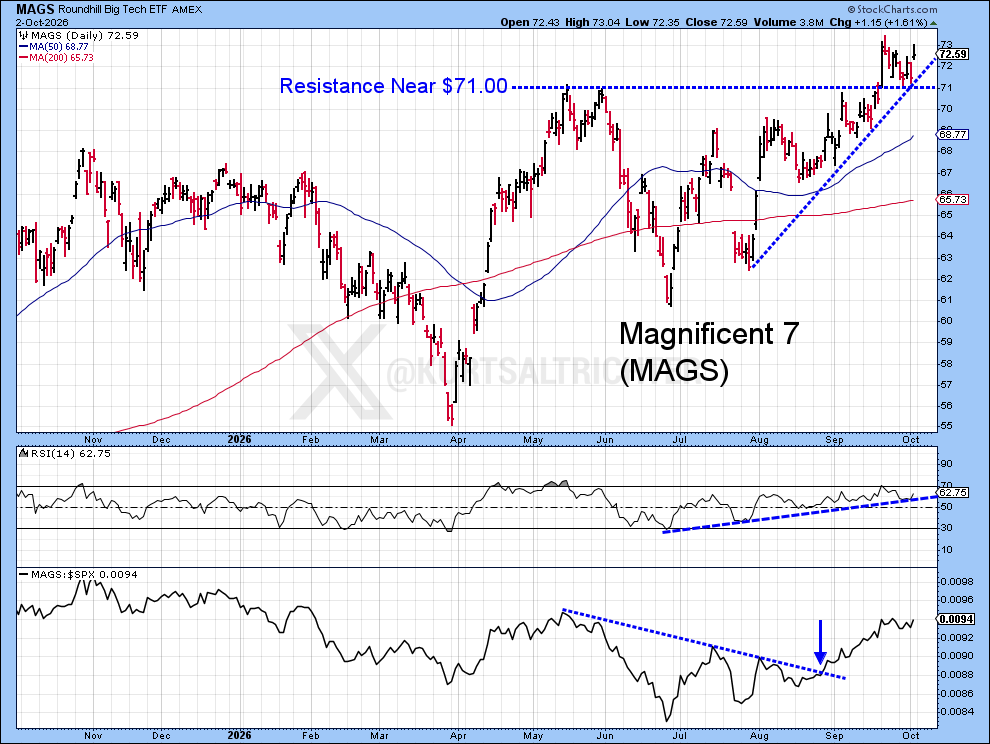
M7: MAGS closed at $72.59 last week, holding above its $71 breakout level as money crowds back into the biggest tech names, the same narrow leadership that leaves the S&P 500 exposed if rates keep climbing.
And remember - The one fact pertaining to all conditions is that they will change.
Follow me on X for more updates.
Best regards,
-Kurt
Schedule a call with me by clicking HERE
Kurt S. Altrichter, CRPS®
Fiduciary Advisor | President
Disclosure
The RiskSignal Report is published by Ivory Hill, LLC. All opinions and views expressed in this report reflect our analysis as of the date of publication and are subject to change without notice. The information contained herein is for informational and educational purposes only and should not be considered specific investment advice or a recommendation to buy or sell any security.
The data, models, and tactical allocations discussed in this report are designed to illustrate market structure and positioning trends and may differ from portfolio decisions made by Ivory Hill, LLC or its affiliates. Investing involves risk, including the possible loss of principal. Past performance is not indicative of future results.
Ivory Hill, LLC, and its members, officers, directors, and employees expressly disclaim any and all liability for actions taken based on the information contained in this report.