

The S&P 500 touched a new all-time high last week, yet the NYSE Advance-Decline Line, which tracks how many stocks are rising versus falling, sits near its lowest level in months. The index is climbing on the backs of a few giant companies while the typical stock goes nowhere, and the force behind that split is the one I flagged last week: rising U.S. yields and the dollar they are dragging higher with them.
What a record high with bad breadth actually means
The S&P 500 is weighted by size, so a handful of trillion-dollar stocks can lift the index even when hundreds of others fall.
Breadth measures how many stocks are participating. The Advance-Decline Line keeps a running total of stocks that rose each day minus the ones that fell, and in a healthy bull market it makes new highs alongside the index.
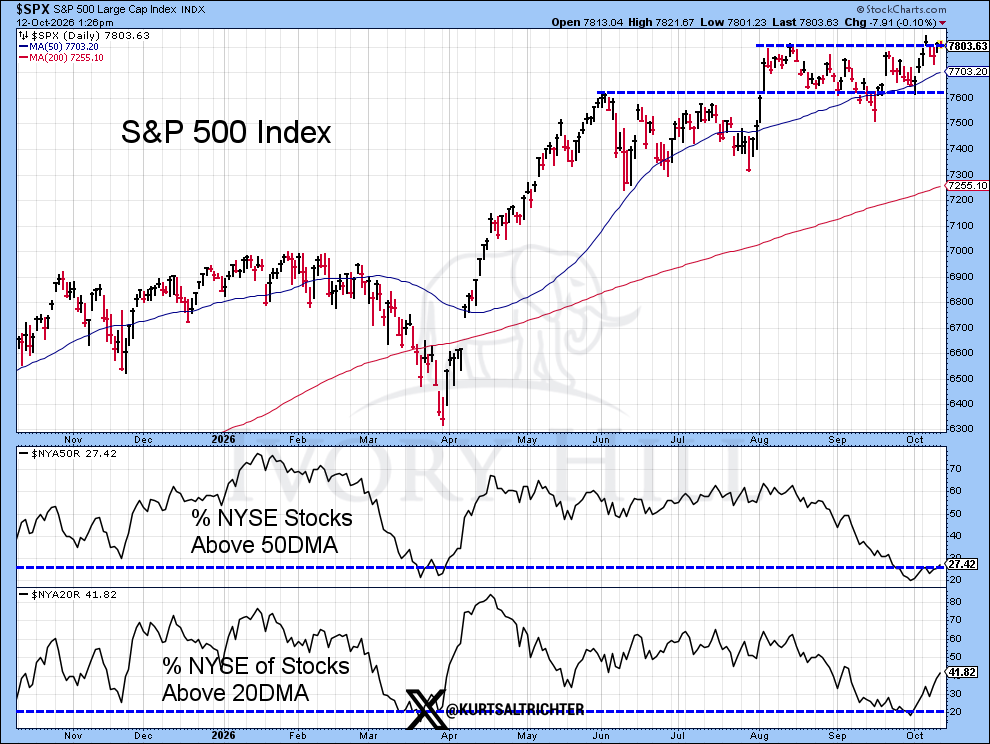
That isn’t happening. The S&P 500 in the top panel on the chart below is showing it pressing against 7,800, while the A-D Line in the middle panel peaked in mid-August and rolled over hard through September. Technicians call this a negative divergence, which in plain English means more stocks have been falling than rising even as the headline number climbs. The bottom panel shows the damage underneath: only about 39% of NYSE stocks trade above their 150-day average, down from roughly 60% in August.
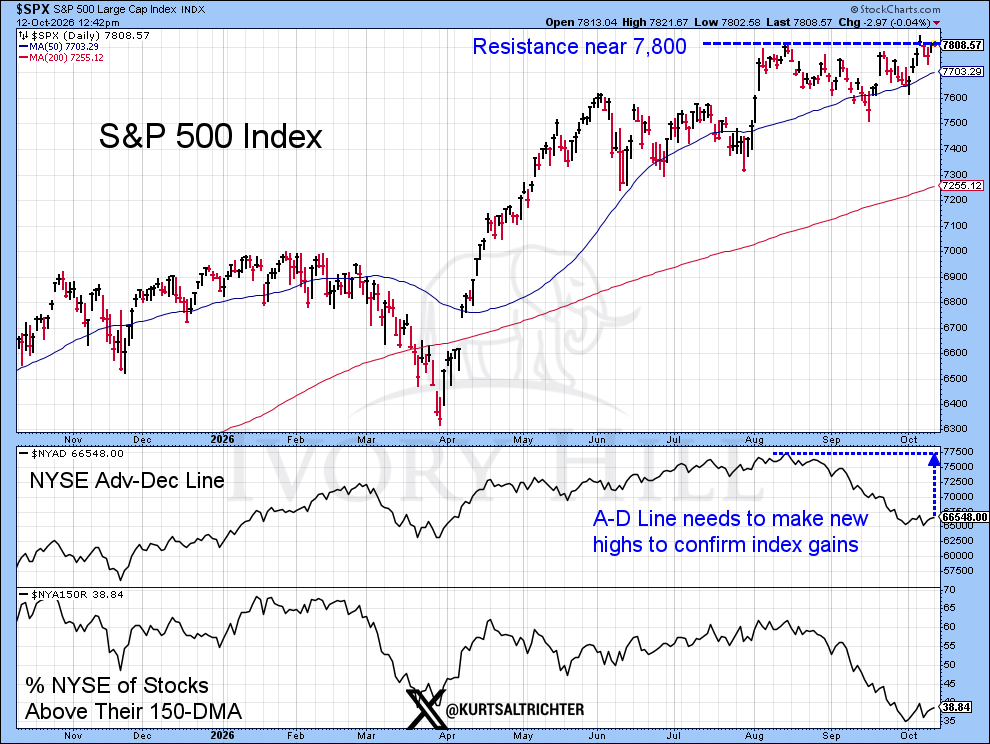
A divergence isn’t a sell signal on its own, but it makes this rally fragile: when a few names carry the index, they only have to stumble to drag the whole party lower, with no army of other stocks underneath to catch it. The fix is easy to watch: the A-D Line has to climb back to the mid-August high marked by the dotted arrow. Until it does, every new high in the S&P 500 is built on fewer shoulders.
Rising yields built the dollar, and the dollar is choosing winners
Last week’s report covered the 10-year Treasury yield hitting 5.34%, its highest level since 2002. The second-order effect is now showing up in currencies.
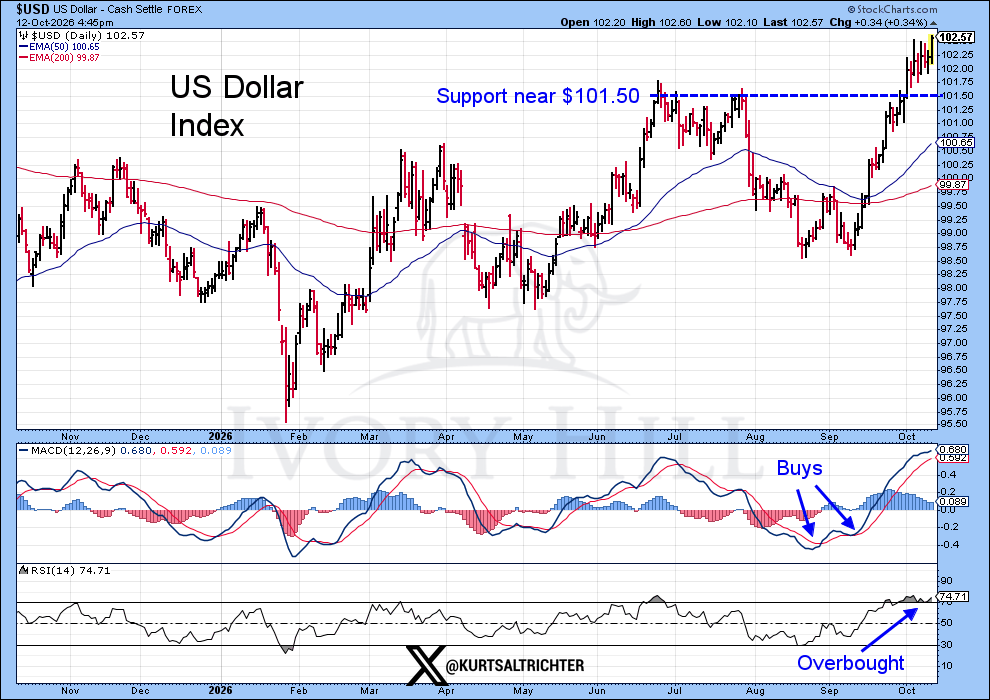
When U.S. Treasuries pay far more than bonds in Europe or Japan, global money sells euros and yen to buy dollars and collect the difference. The chart below shows the Dollar Index closing at 102.57, well above the $101.50 level that capped it in June and July. That old ceiling is now the floor, and with the RSI overbought above 70, a pullback toward $101.50 would be a normal pause inside the uptrend.
The euro is the mirror image of the greenback.
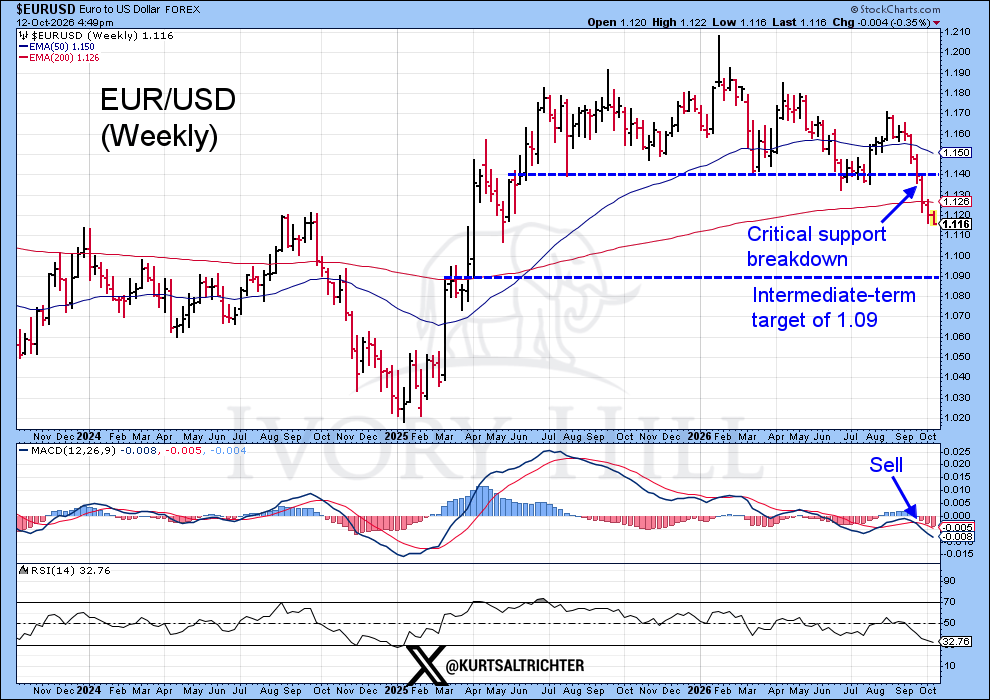
A strong dollar tightens financial conditions for anything that isn’t a cash-rich U.S. mega cap company. Small companies borrow at floating rates and sell mostly at home, so they absorb higher rates with no currency tailwind. Foreign stocks lose value when converted back into dollars. The only group that shrugs all of it off is the one with enormous cash piles, pricing power, and a story investors will pay for at any rate: AI.
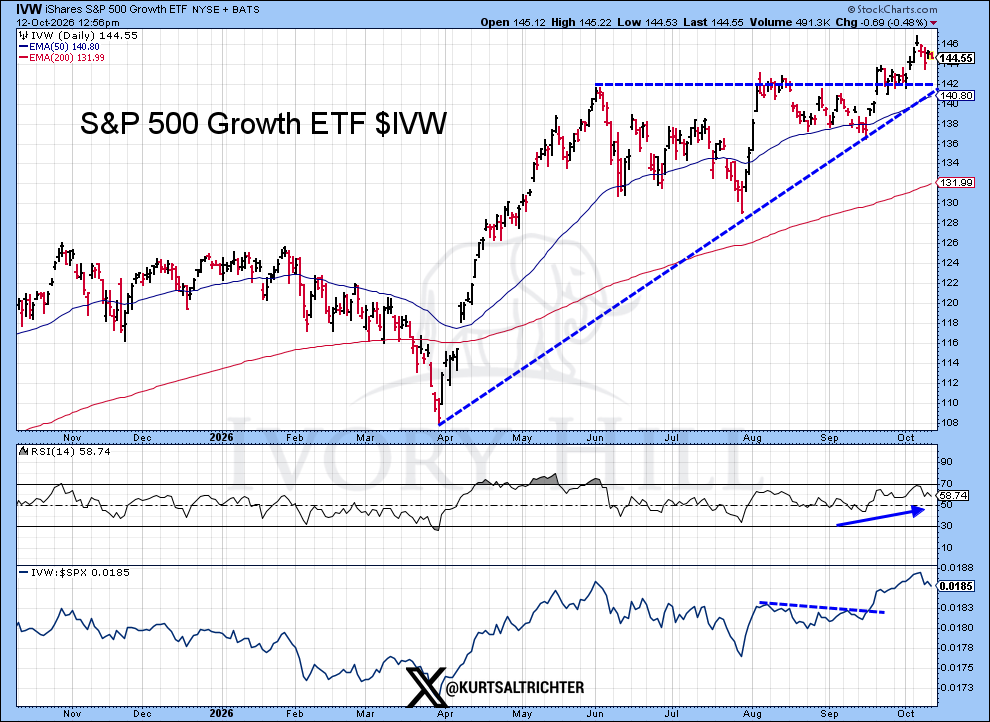
That explains the scoreboard. Growth stocks pulled back last week after a report that OpenAI’s revenue is running below earlier projections, but the chart below shows the S&P 500 Growth ETF (IVW) holding above its June and August highs near $142, and its ratio to the S&P 500 in the bottom panel just made a new 2026 high.
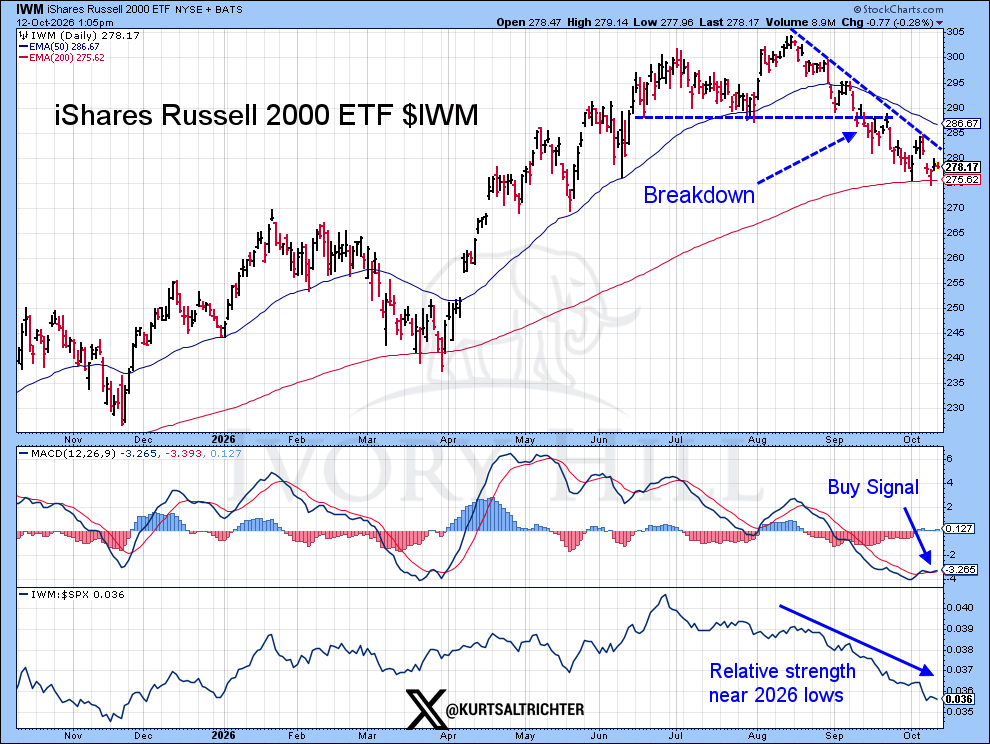
Small caps are the opposite story. They fell last week while the S&P 500 rose 1.15%. The chart below shows the Russell 2000 ETF (IWM) breaking down in September and sliding all the way to its 200-day average near $275, where it sat at $278 last week. The bottom panel is the one to remember: IWM’s performance versus the S&P 500 is near its weakest point of 2026. A MACD buy signal says the selling is slowing, but IWM still has to clear the downtrend line near $283 before small caps are worth owning again.
The same trade is running overseas under a different flag
Emerging markets look like a winner on paper. The broad MSCI Emerging Markets fund (IEMG) is up more than 20%, beating both U.S. stocks and developed international markets.
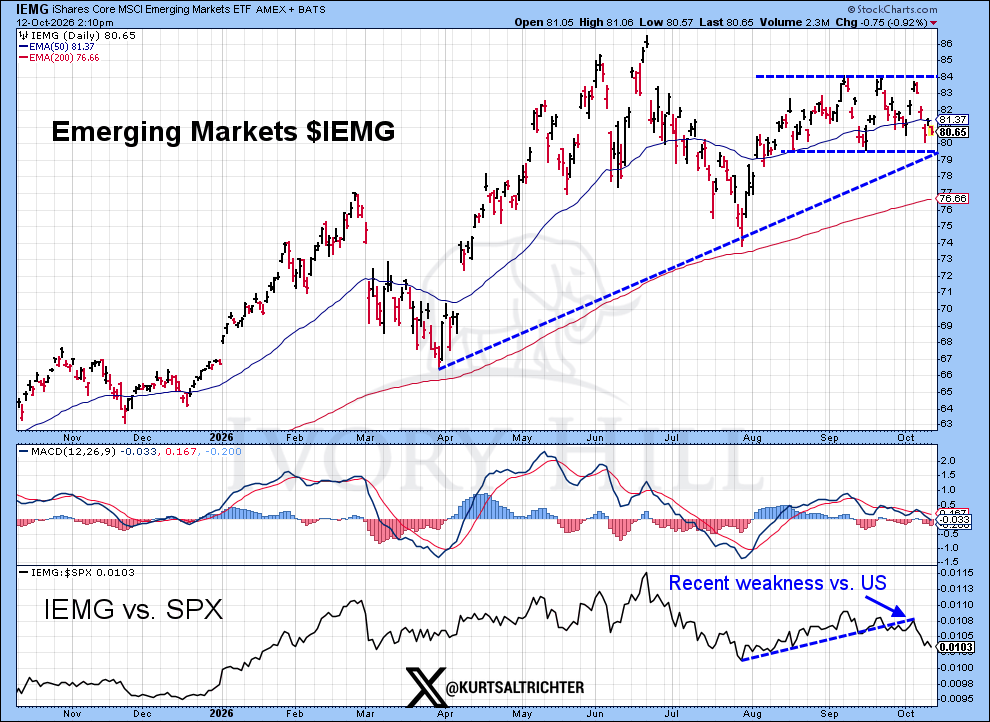
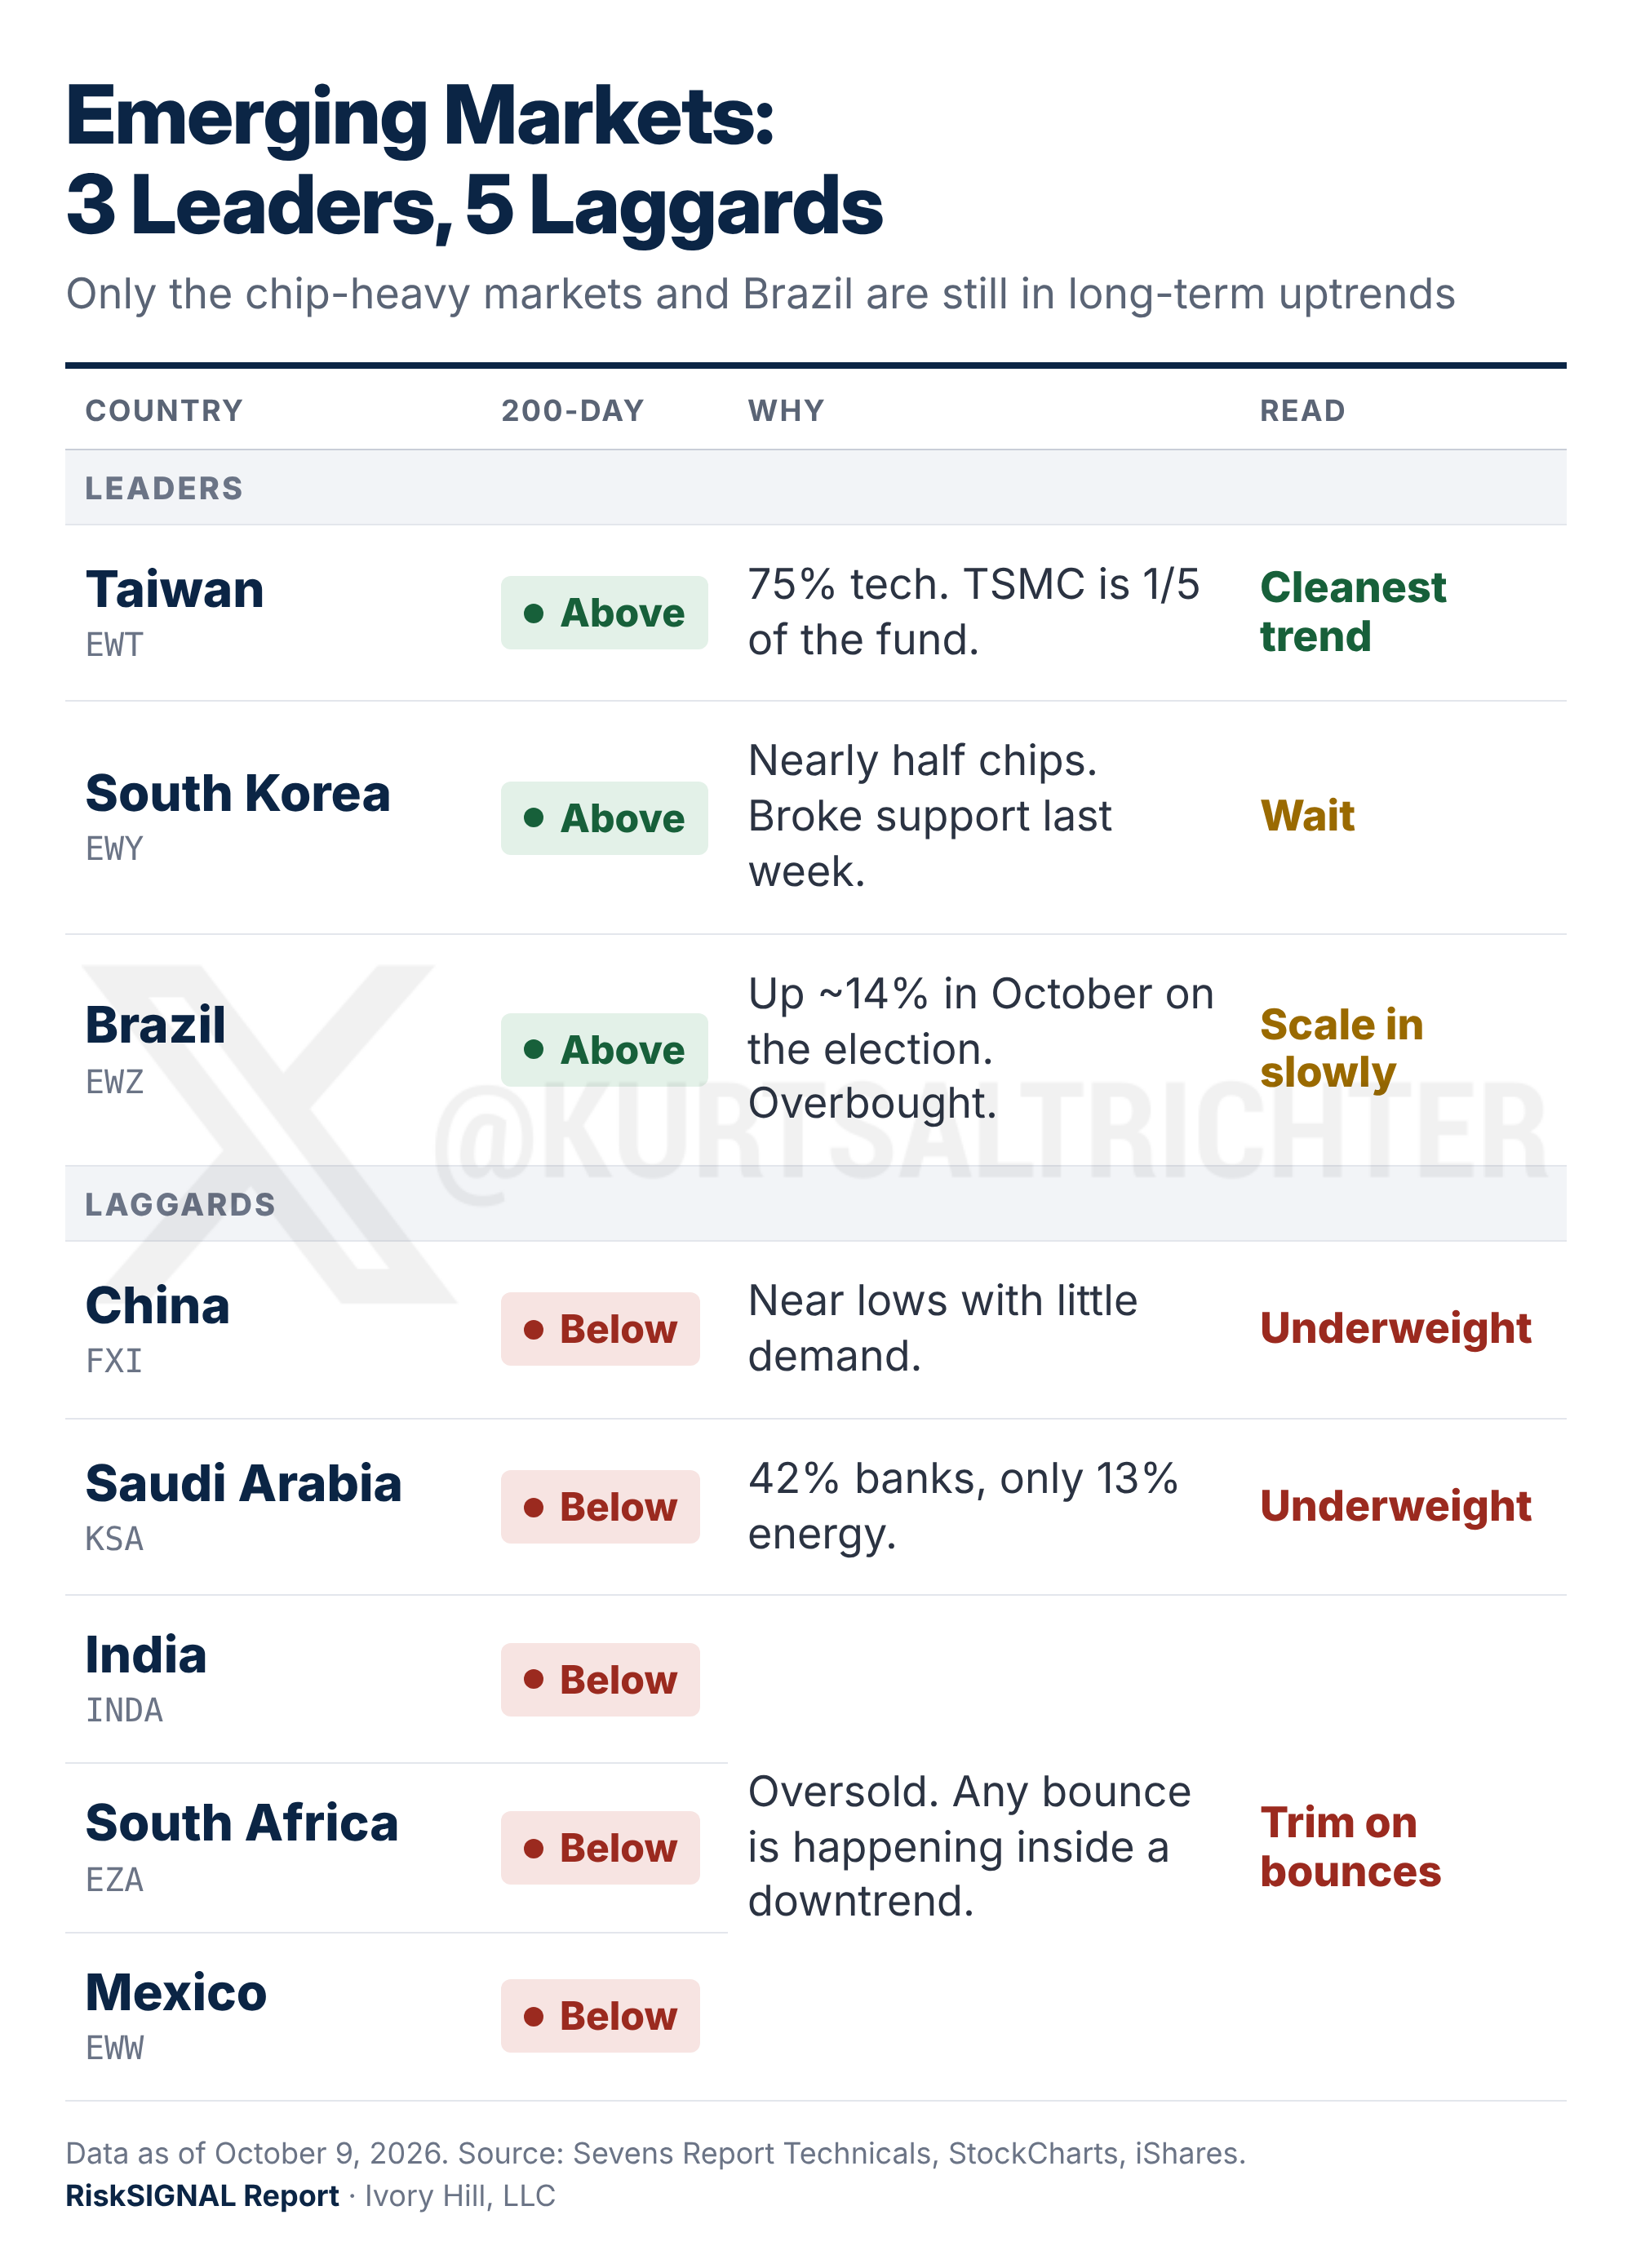
Open the hood, and it’s the AI trade again. Taiwan and South Korea make up roughly half of the index, and both are chip bets. Taiwan Semiconductor alone is about 1/5 of the Taiwan fund, and SK Hynix and Samsung are close to half of the Korea fund. The chart below sorts 8 major emerging-market country funds by trend. Only Taiwan, South Korea, and Brazil trade above their 200-day moving averages. China, India, South Africa, Saudi Arabia, and Mexico are all in downtrends because their markets lean on banks and industrials instead of chips, and a rising dollar drains foreign money out of exactly those kinds of markets.
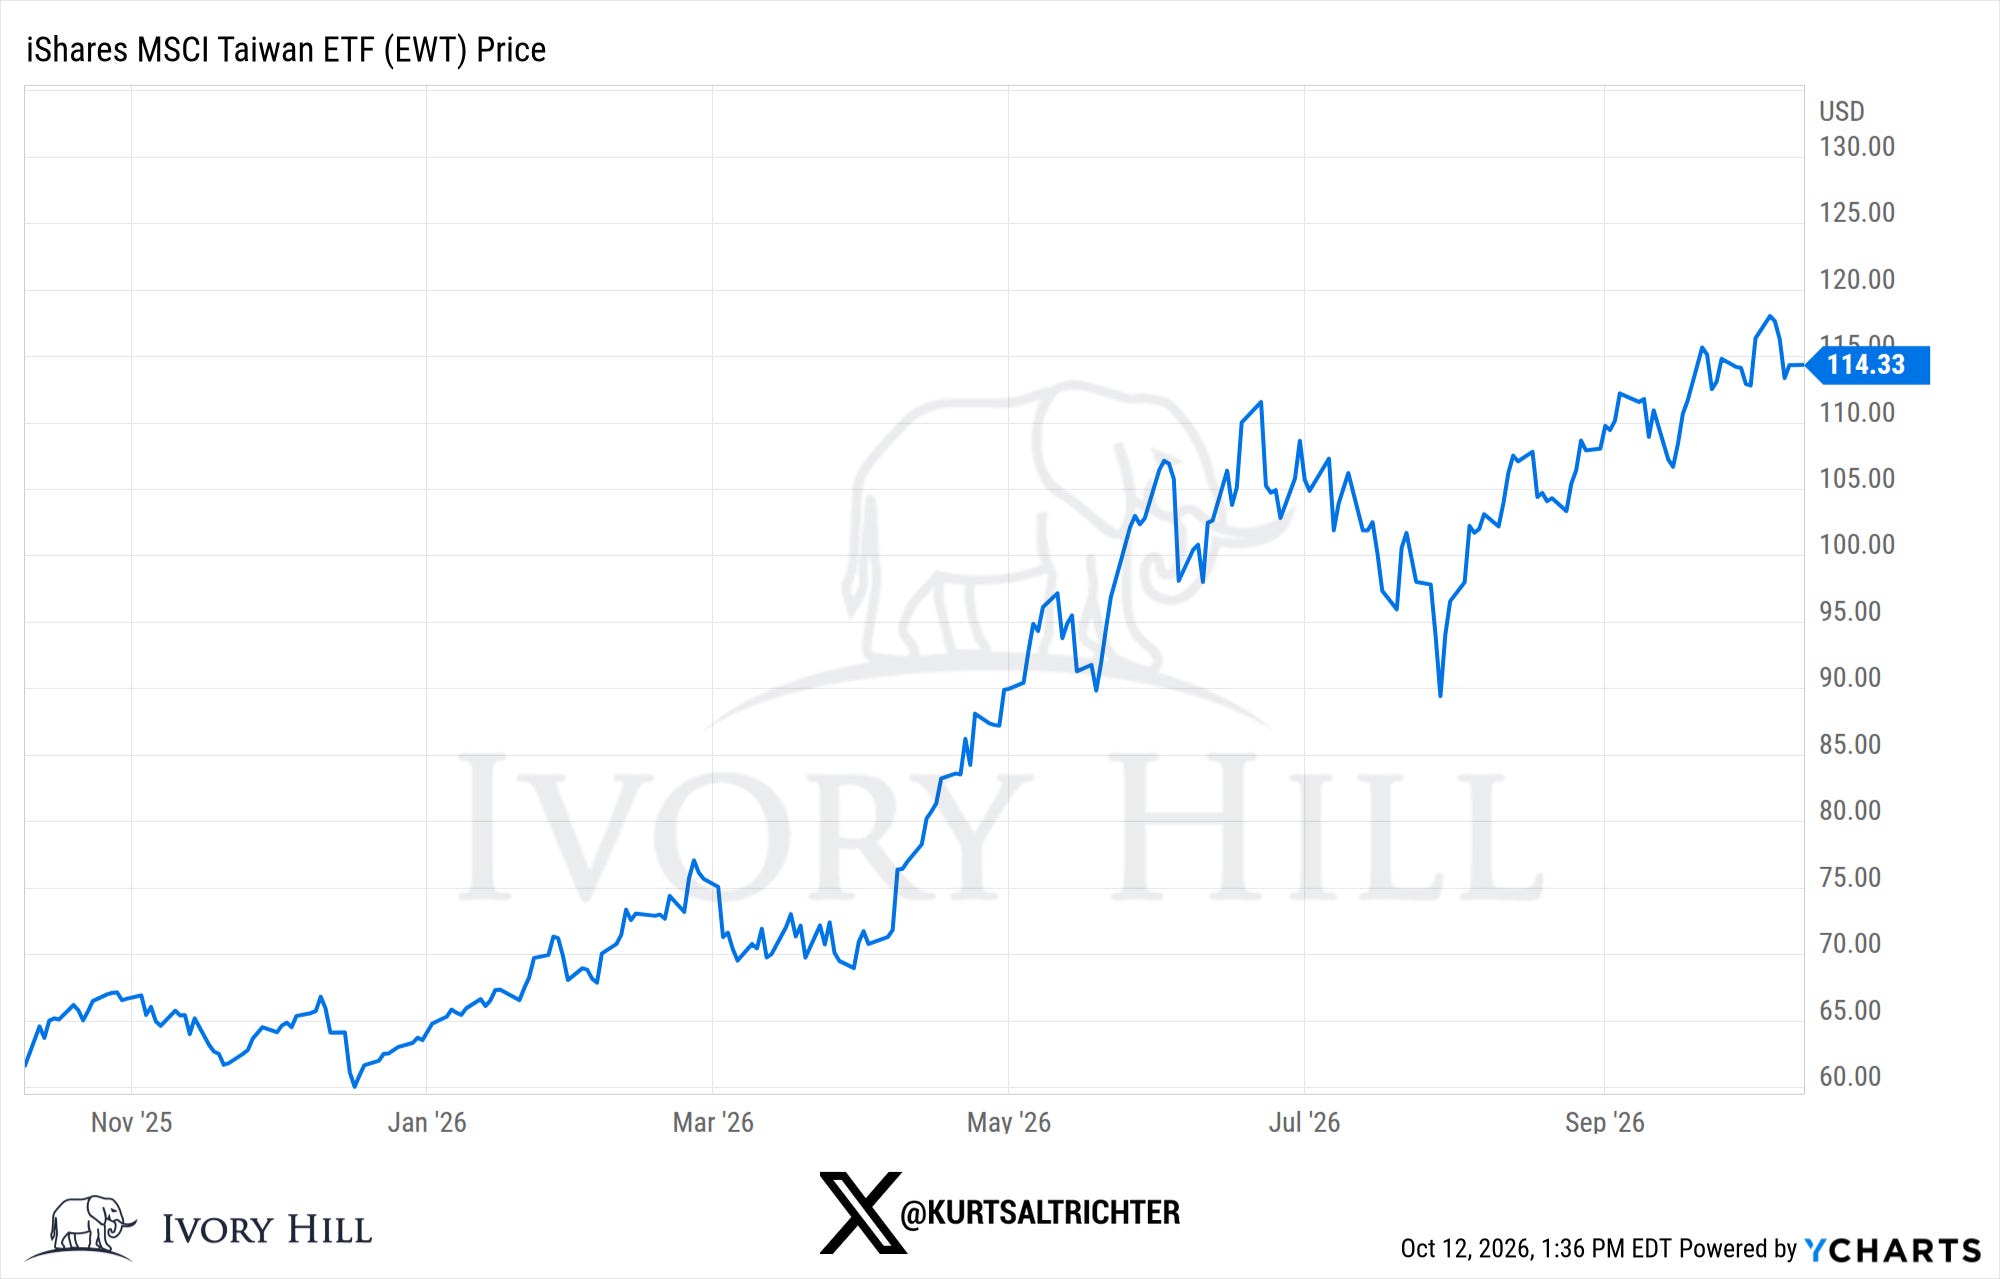
Even the leaders are thinning out. Taiwan is the only one with a clean trend. The chart below shows EWT climbing from about $89 at its August low to $114, a steady run of higher highs and higher lows.
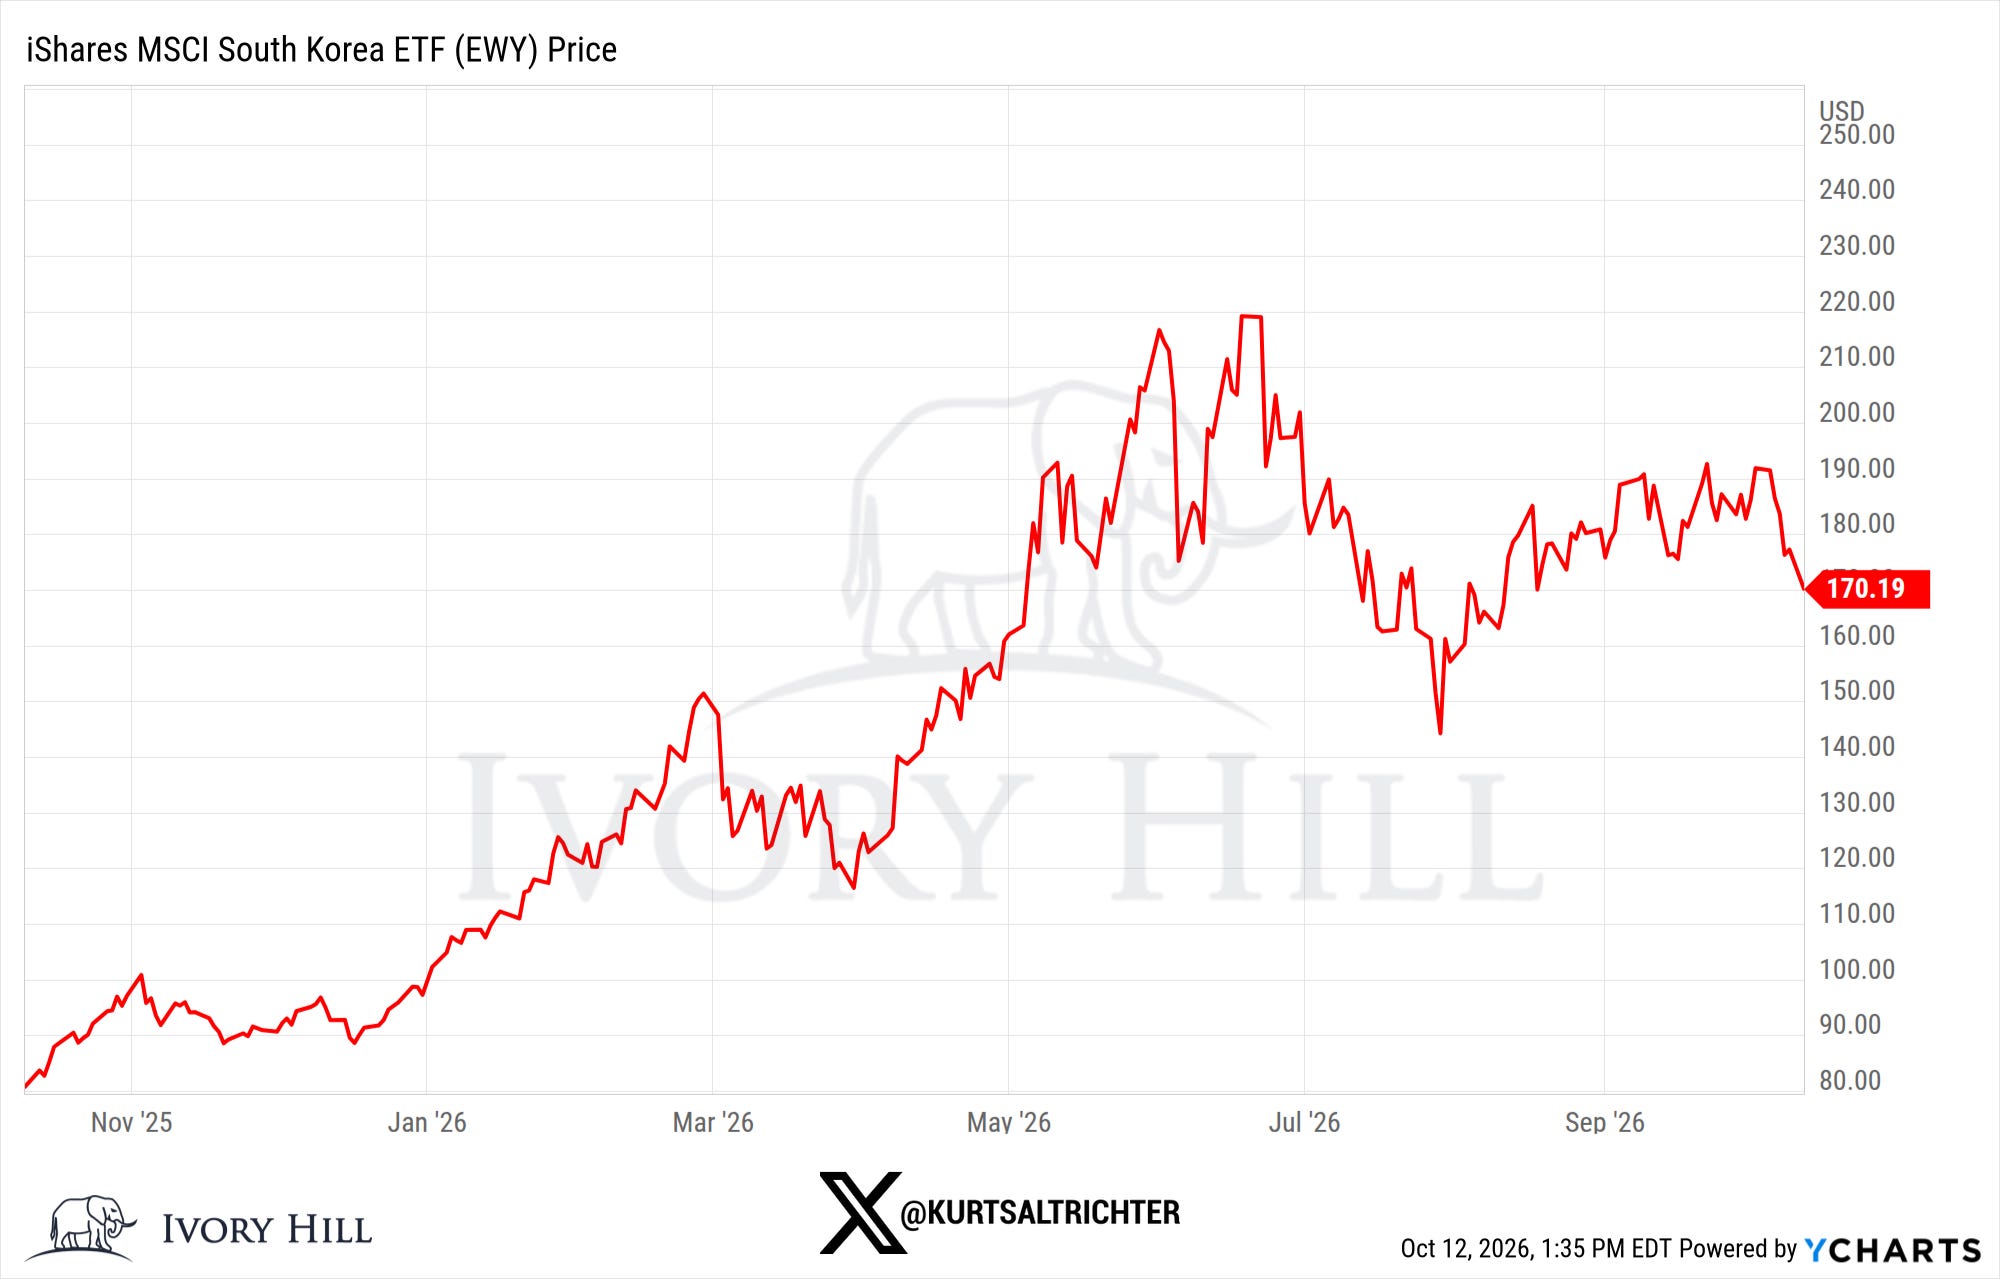
Korea is going the other way. SK Hynix dropped 13% in a single week, and EWY is falling from just above $190 to $170, breaking the support that held through September. That turns the Korea fund from a breakout candidate into a pass for now. Brazil jumped about 14% in October on election results, but a rally built on one headline is hard to trust, and the fund is overbought.
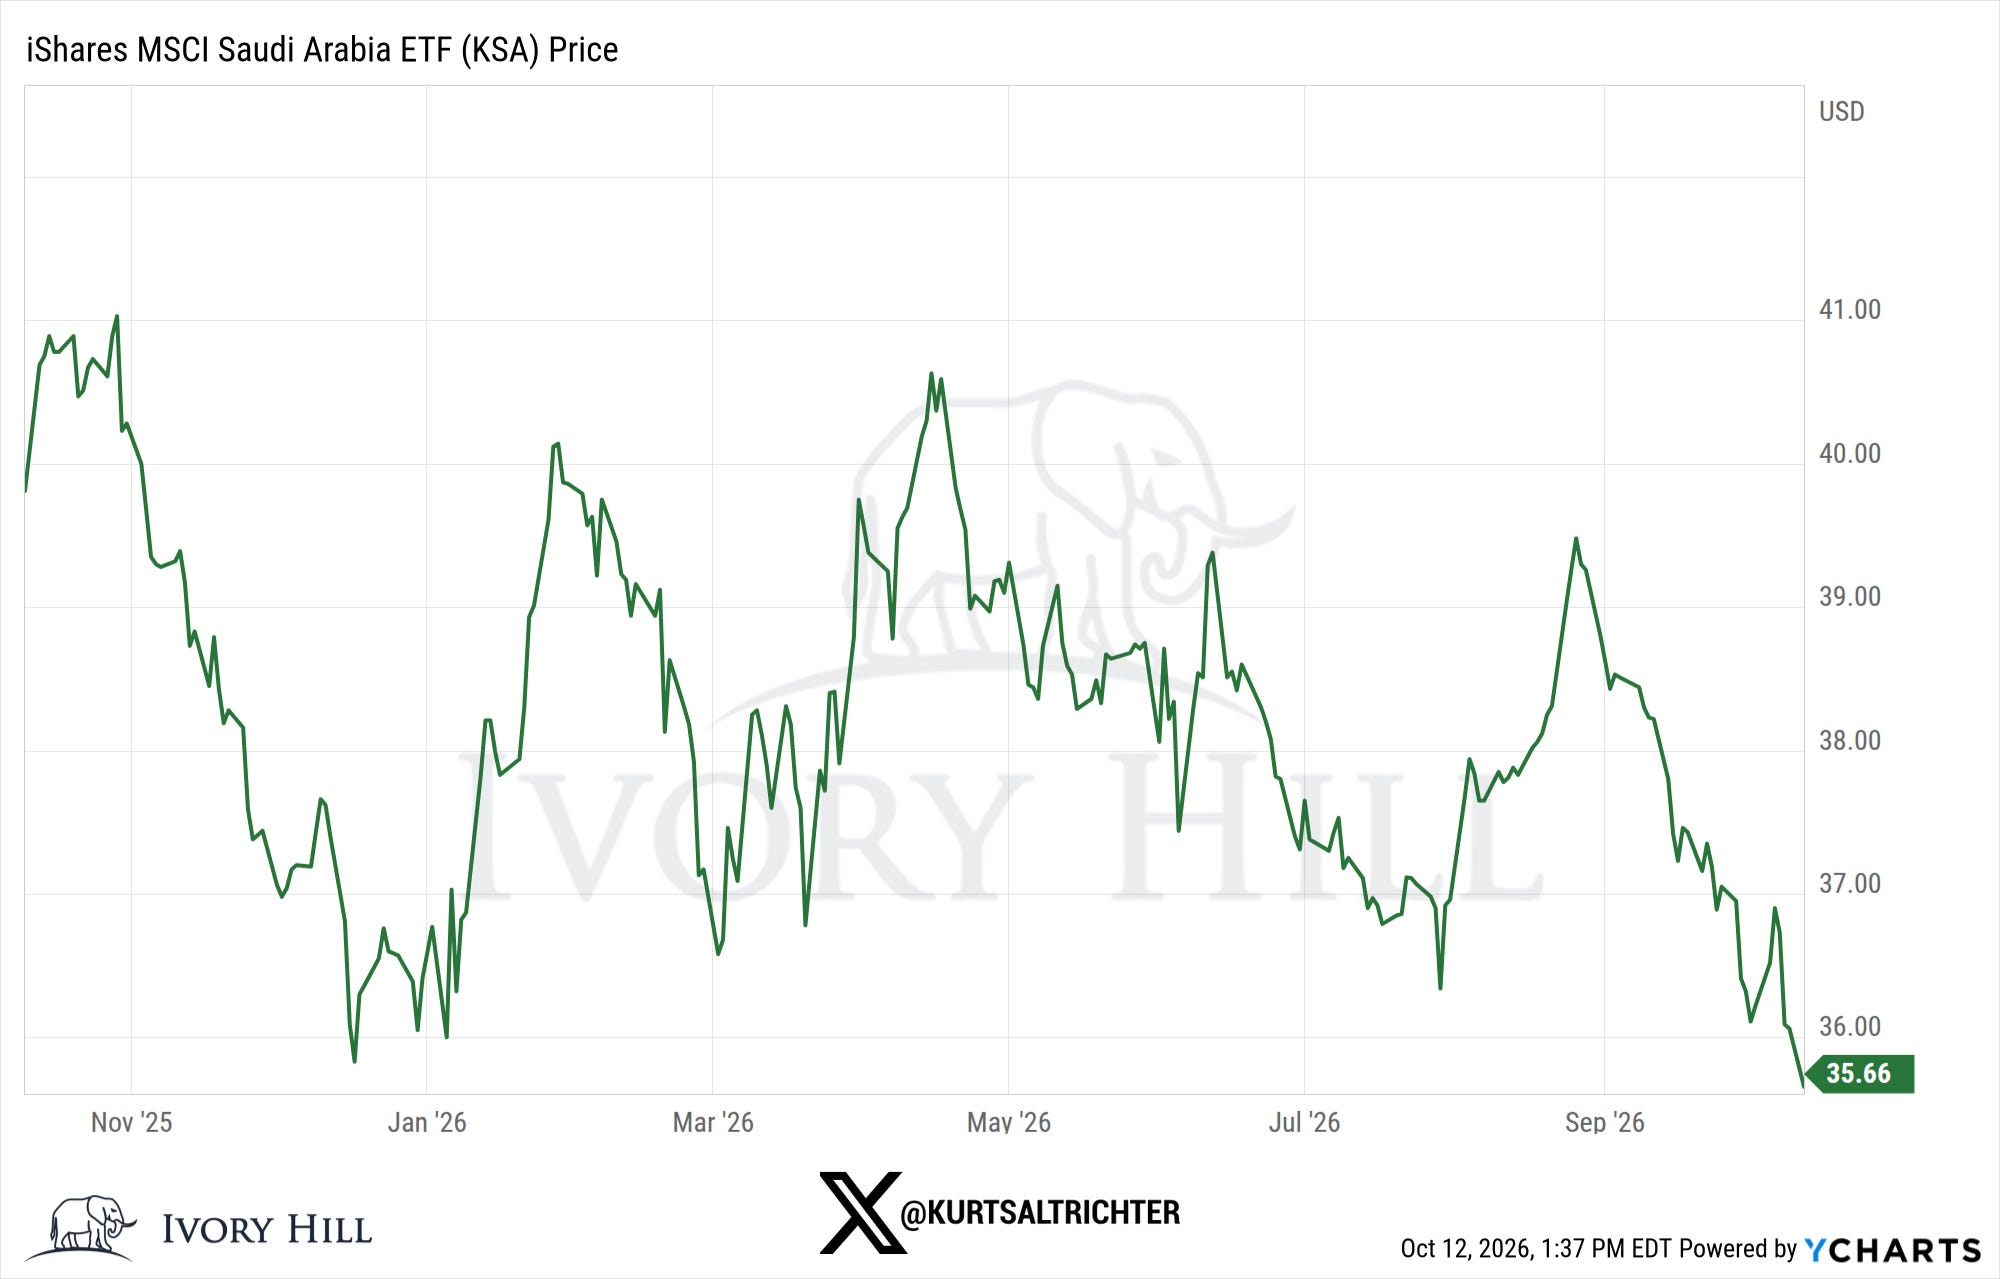
Saudi Arabia is the most useful lesson in the group. You would expect an oil country to rally with energy prices. It hasn’t, because the Saudi fund holds about 42% financials and only about 13% energy, and global financial stocks have lagged all of 2026. KSA is at $35.66, the chart's low. Before you buy any country fund, read its holdings, because the name on the label can put you in the wrong sector entirely.
The one good sign last week, and what it proves
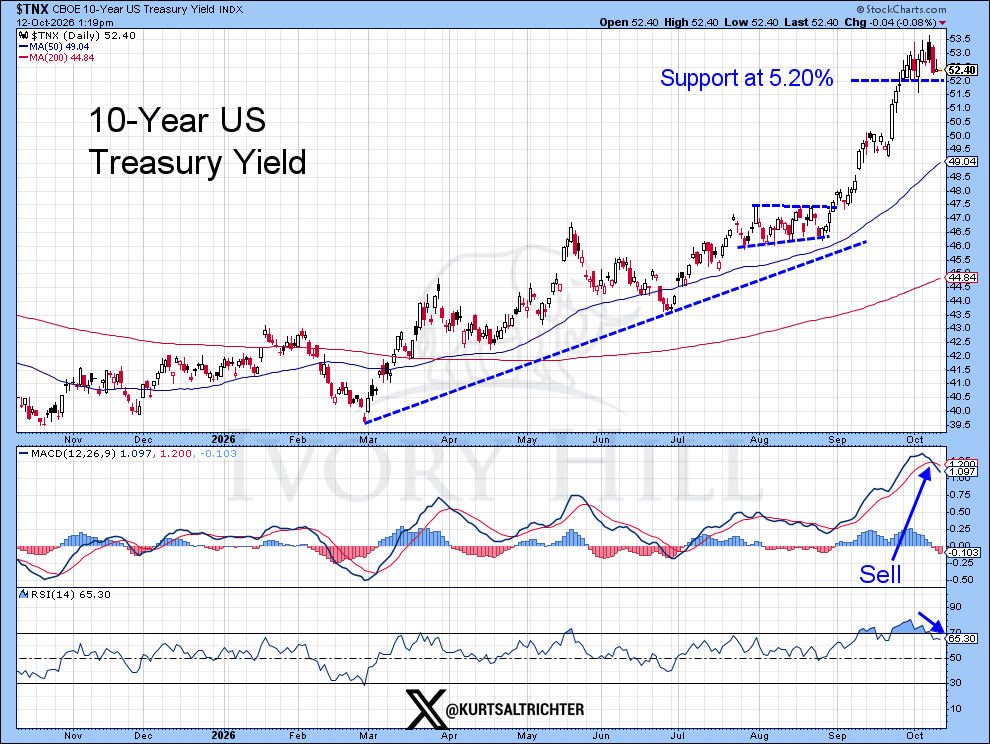
Yields took a breather last week. The 10-year is easing from its 5.34% high to 5.24%, after the MACD in the middle panel flashed a sell and the RSI rolled over from overbought. It’s now sitting just above support at 5.20%.
The stock market’s response was immediate. Utilities and consumer staples, the 2 sectors most sensitive to rates, jumped more than 3.5% for the week. The chart below shows the breadth reaction. The share of NYSE stocks above their 20-day average (bottom panel) doubled off its oversold floor near 20% to almost 42%. The 50-day in the middle panel has barely moved off its lows at 27%, which tells you the bounce is short-term so far.
RSP’s ratio to the S&P 500 is still pinned under its own downtrend line, and a break above it would mean the average stock is finally beating the mega caps instead of just bouncing alongside them.
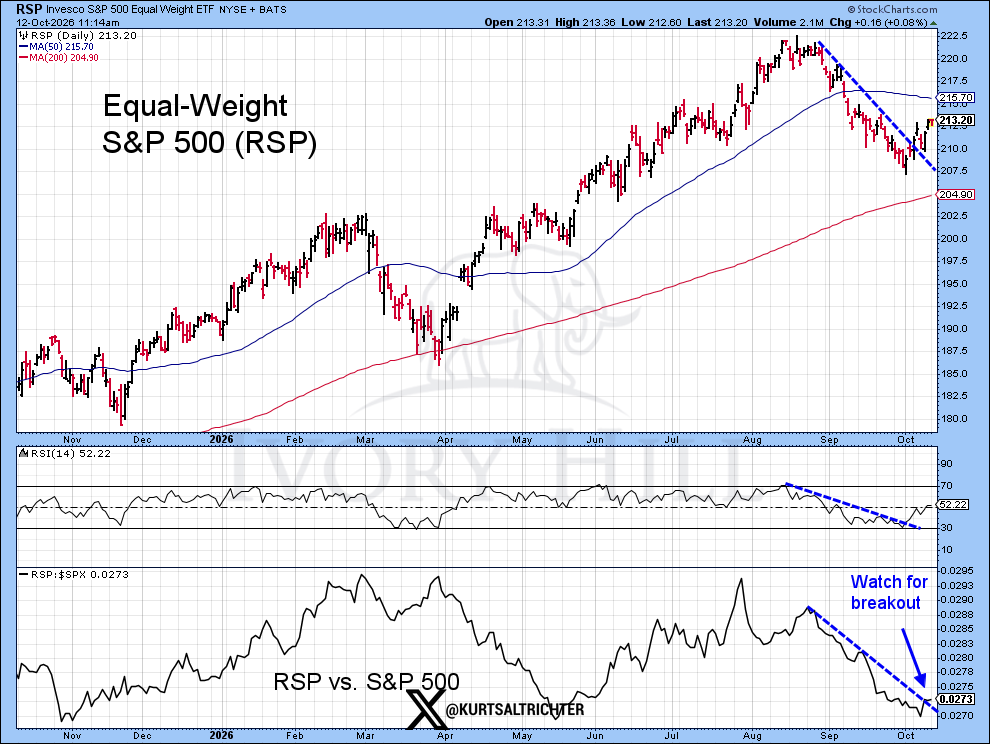
That reaction is the most important data point in this report, because it proves the breadth problem is a rate problem: give the average stock a few days of falling yields and it rallies. The bond market has given no sign this pause will last. The 10-year’s longer-term uptrend is intact, and the gap between the 10-year and 1-year Treasury yields just broke above a downtrend line running back to 2010. That steepening is coming from long-term yields rising while short rates sit still, which is the deficit-driven pressure I covered last week. If the 10-year breaks back above 5.34% and heads toward 5.5%, the breadth rally loses its fuel.
What it means for you
Know how concentrated your index fund is. An S&P 500 index fund is a bet on the AI trade whether you meant to make one or not. Own an S&P 500 fund, a NASDAQ fund, and a tech fund, and you own the same handful of companies 3 times.
Don’t buy emerging markets as one fund. A broad emerging-market fund puts roughly half your money into Taiwanese and Korean chipmakers. If you want the exposure, be selective. Taiwan has the cleanest trend. India, South Africa, and Mexico have hit oversold levels and may bounce, and any bounce is a chance to trim, not add.
Own foreign assets in dollar terms. With the euro breaking down, unhedged European holdings can lose money on the currency alone, and currency-hedged funds remove that drag. Think HEDJ over VGK.
Favor quality over cheap. High-profit-margin companies and low-volatility stocks are beating the market on a risk-adjusted basis right now, because businesses with fat margins can absorb higher borrowing costs without cutting earnings.
Watch 3 levels. The NYSE Advance-Decline Line reclaiming its mid-August high would confirm the rally is broadening. The S&P 500 holding above 7,800 with the share of stocks above their 50-day average climbing out of the 20s would confirm a new leg higher. The 10-year breaking above 5.5% would tell you the breadth rally is over before it started.
Quick hits on the rest of the macro
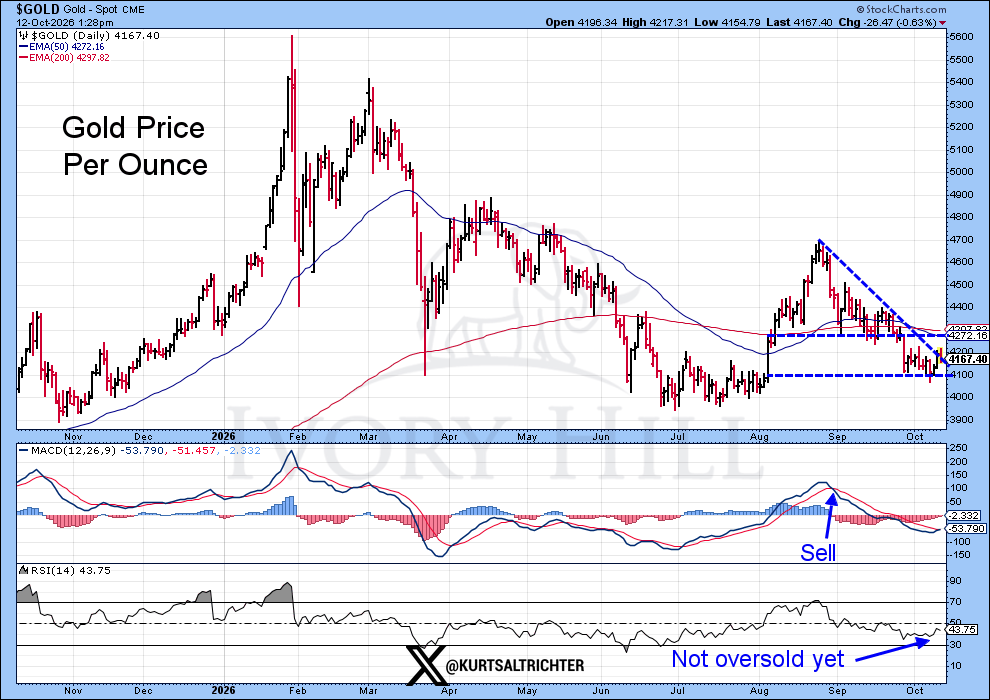
Gold: A rising dollar makes every ounce more expensive for overseas buyers, so gold needs the dollar to cool before it can break its downtrend.
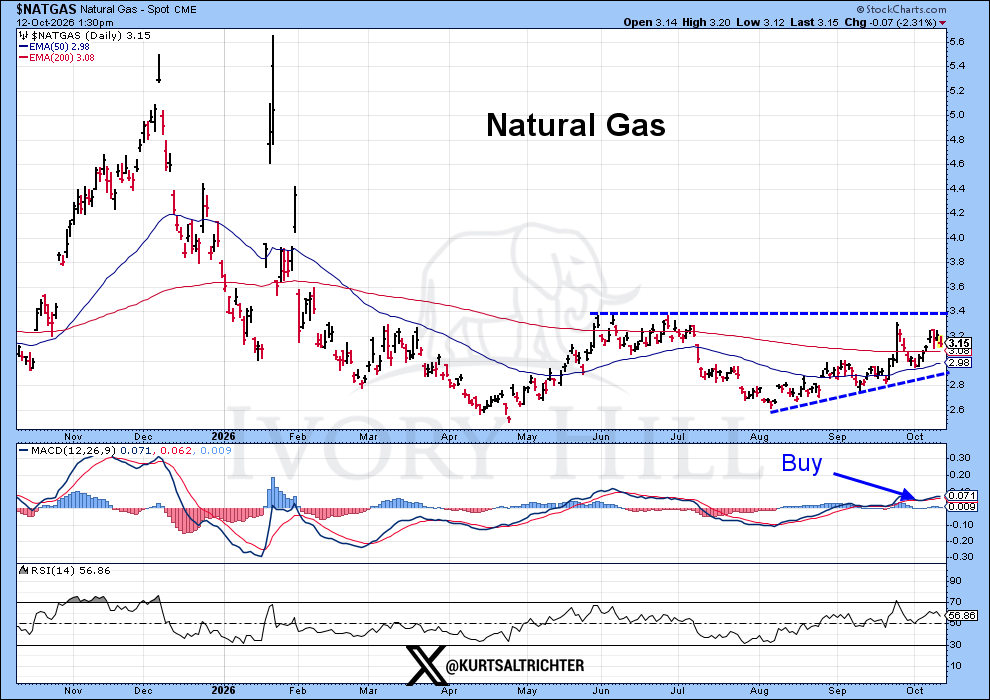
Natural gas: Natural gas has risen in 69% of Octobers over the last 35 years, and it’s trading at $3.15, above both its 50-day and 200-day averages with a fresh MACD buy signal. A push through $3.40 resistance sets up higher heating bills into the winter.
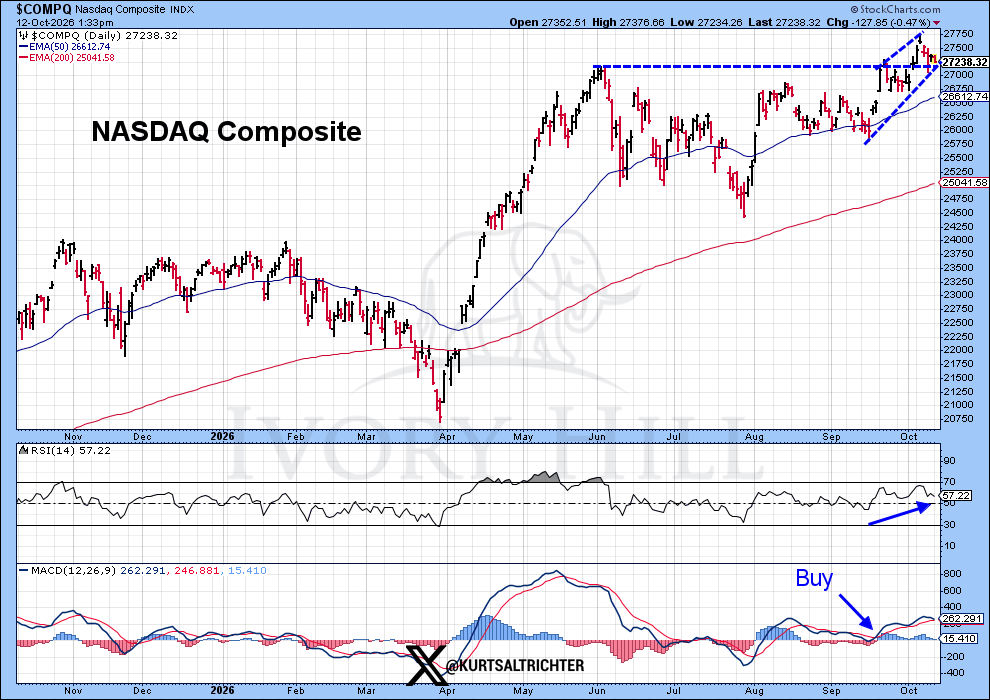
NASDAQ: That old ceiling is now first support, with the 50-day average near 26,600 below it if the AI wobble deepens.
And remember - The one fact pertaining to all conditions is that they will change.
Follow me on X for more updates.
Best regards,
-Kurt
Schedule a call with me by clicking HERE
Kurt S. Altrichter, CRPS®
Fiduciary Advisor | President
Disclosure
The RiskSignal Report is published by Ivory Hill, LLC. All opinions and views expressed in this report reflect our analysis as of the date of publication and are subject to change without notice. The information contained herein is for informational and educational purposes only and should not be considered specific investment advice or a recommendation to buy or sell any security.
The data, models, and tactical allocations discussed in this report are designed to illustrate market structure and positioning trends and may differ from portfolio decisions made by Ivory Hill, LLC or its affiliates. Investing involves risk, including the possible loss of principal. Past performance is not indicative of future results.
Ivory Hill, LLC, and its members, officers, directors, and employees expressly disclaim any and all liability for actions taken based on the information contained in this report.