
The Defensive Trade Is Breaking Down
Reading the tape underneath the tape

The long-term RiskSIGNAL turned green last Wednesday, April 15.
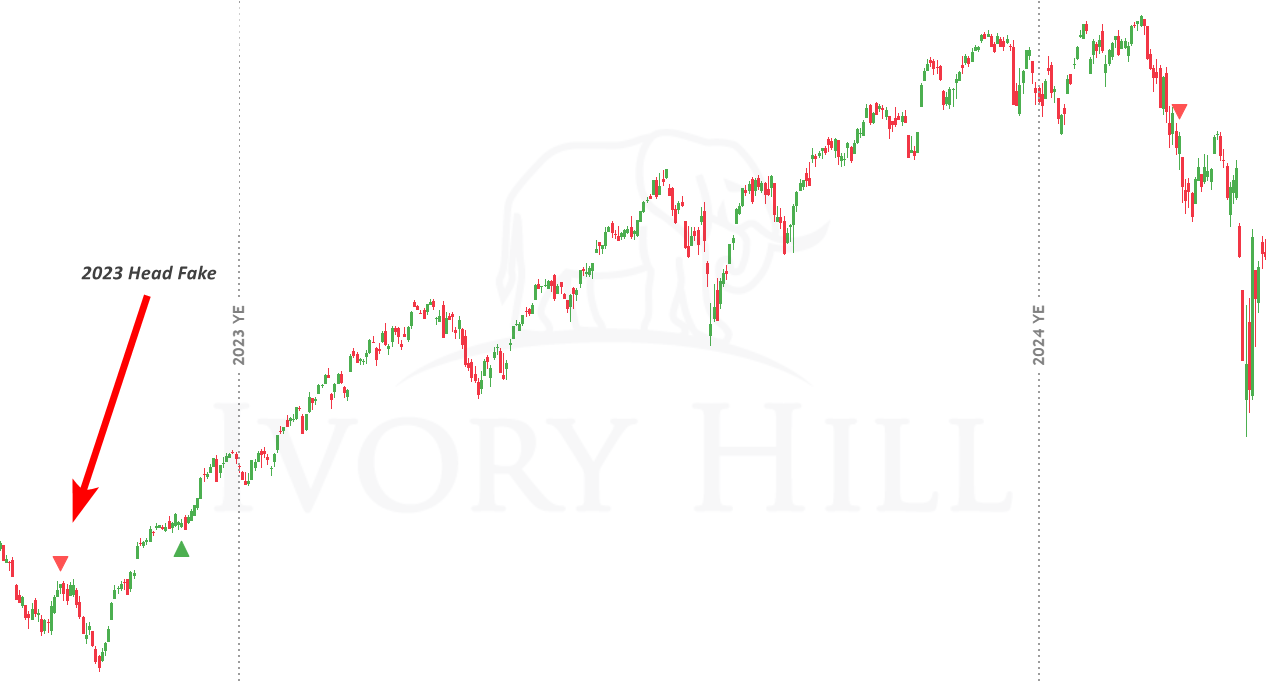
Was the sell signal a head fake? Sure looks like it.
The last head fake was in 2023, when conditions were worse than today. That one got us back in to catch the uptrend.
This is exactly why I do not believe in going to 100% cash.
The market bounces and turns up before you can blink. You get caught completely offsides. I would rather digest some of the drawdown to capture the turn than miss it entirely.
Look, the signal is not going to call every top and every bottom. It is specifically designed not to. False signals are part of rules-based investing. Expect them and do not be surprised when they happen.
The only manager I know who called every top and every bottom perfectly for decades was Bernie Madoff. We all know how that ended.
Here is another nuance worth understanding. If you run money on a risk-on / risk-off signal, meaning you are either 100% invested or 100% cash, you need a plan for what happens when the signal stubs its toe. Our signal always flips green after the bottom is in, so we dial up portfolio beta to catch back up to the market when the signal heads fake, as it just did. Otherwise, you are playing a losing game against time.
If you are using our signal or anything like it on an off-the-shelf passive 60/40, this does not work. What you could do is shift from 100% aggressive to a 60/40 when the signal turns red, then back to 100% equities when it turns green.
The same logic applies to how I think about client portfolio construction in general. Not putting all your eggs in one asset class is obvious. But no investor should put 100% of their capital into a single strategy either. I am a big proponent of blending strategies that offset each other, meaning different strategies that zig when the others zag. Why? Because it is very hard to be wrong when you do it right.
The only major portfolio changes we made from this were in the momentum models. And they are fully invested as of last week.
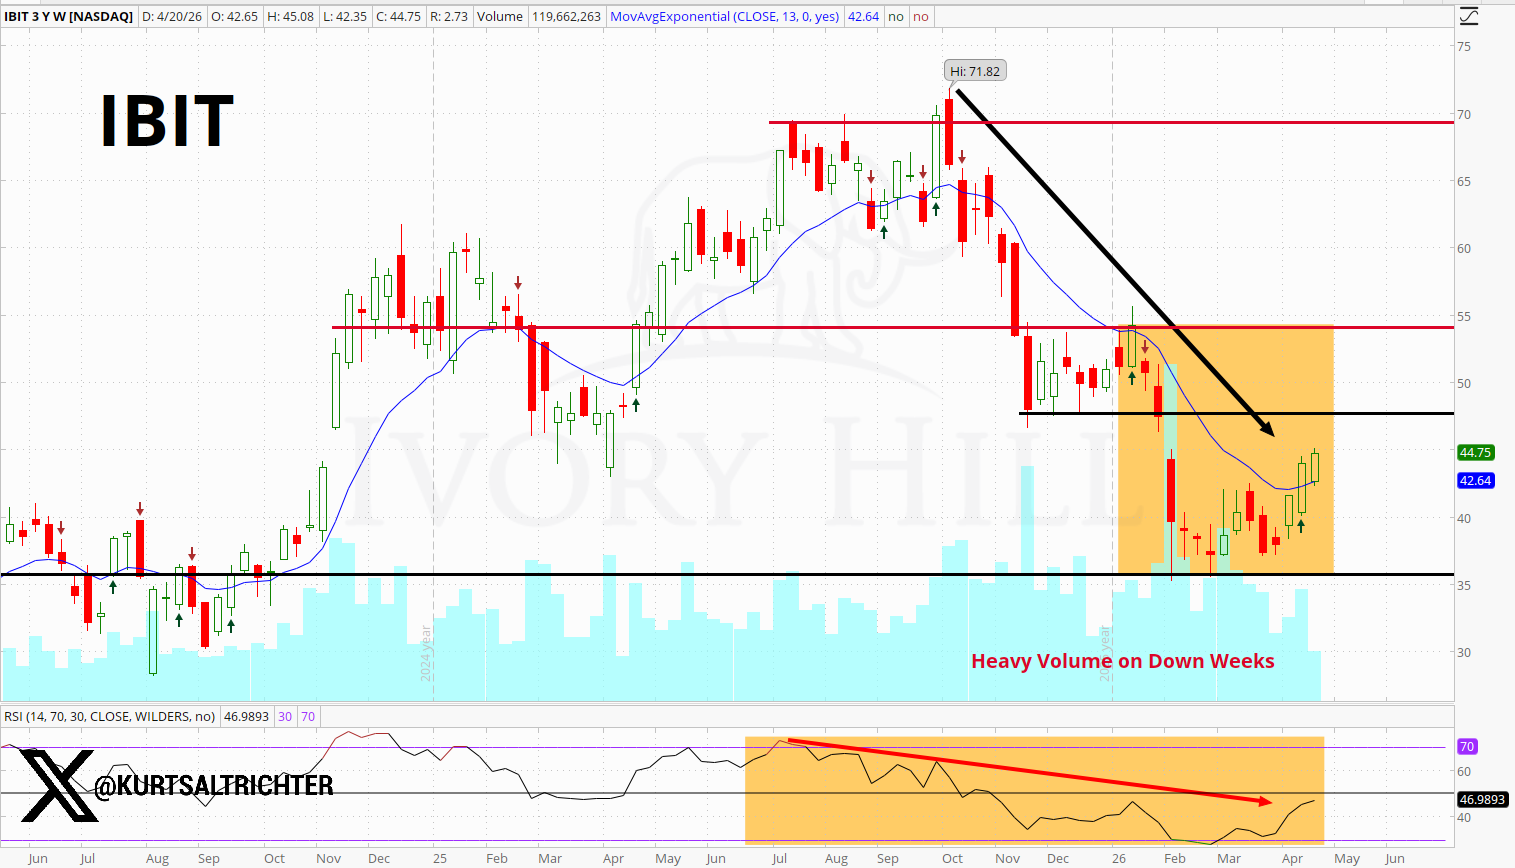
The core equity models are still holding 40-59% in short-term T-Bills. The only real change was adding BTC through IBIT, and that is not a major buy since the models have been holding Ethereum since last month.
The drawdown had little impact on the core equity models because they still carry very little US exposure. Our entire exposure to US stocks is 3-6% in RSP, 3-6% in SMH, and 3-6% in XLB. Total US equity exposure 9%-18%. That’s it.
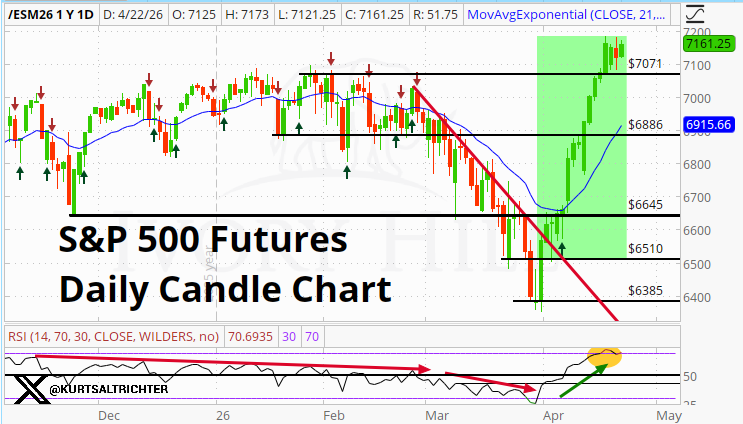
The market has now recovered 100% of the drawdown from the Iran War and is sitting at new all-time highs.
Versus the S&P 500, Utility stocks are handily underperforming.
Utilities are historically the most “bond-like” sector of the US equity market, and there's a structural reason for it. Utes are regulated monopolies. State public utility commissions set the rates they can charge, which locks in a predictable allowed return on equity. Demand for electricity and gas is also inelastic, meaning people pay their power bill in recessions and bull markets alike. That combination produces earnings streams that look less like a cyclical business and more like a coupon payment, which is why the sector trades on duration and rates rather than on growth.
Fun fact: Back in the 1920s, utility stocks were the dominant growth story of the equity market. They were basically what the Mag 7 is today before Washington broke up the holding company pyramids and handed rate-setting authority to state regulators in 1935. That single piece of legislation is what turned utilities from the growth darlings of their era into the bond proxy they are now.
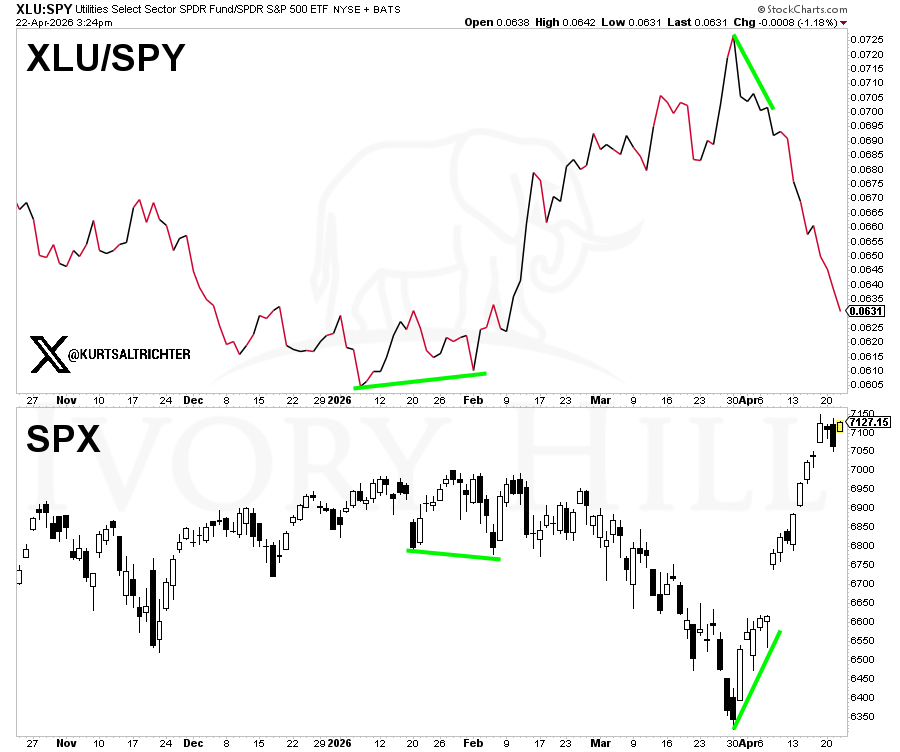
When the XLU/SPY ratio rises, utilities outperform the broader market, suggesting traders are getting defensive under the surface and that we can expect short-term volatility. When the ratio is falling as it is today, traders are moving from defense to offense. This suggests lower volatility in the short term, which is a good sign for stocks.
The useful part of this ratio is that it typically leads the tape (with a lag), so you can front-run volatility by watching where utes are trading before the S&P 500 confirms the move.
And remember - The one fact pertaining to all conditions is that they will change.
Follow me on X for more updates.
Best regards,
-Kurt
Schedule a call with me by clicking HERE
Kurt S. Altrichter, CRPS®
Fiduciary Advisor | President
Disclosure
The RiskSignal Report is published by Ivory Hill, LLC. All opinions and views expressed in this report reflect our analysis as of the date of publication and are subject to change without notice. The information contained herein is for informational and educational purposes only and should not be considered specific investment advice or a recommendation to buy or sell any security.
The data, models, and tactical allocations discussed in this report are designed to illustrate market structure and positioning trends and may differ from portfolio decisions made by Ivory Hill, LLC or its affiliates. Investing involves risk, including the possible loss of principal. Past performance is not indicative of future results.
Ivory Hil, LLC, and its members, officers, directors, and employees expressly disclaim any and all liability for actions taken based on the information contained in this report.
On the 14th you said oil and bonds aren't buying this rally. Are they buying it now?