
The Next Move Will Be Fast
Dealers are hedging, CTAs are chasing, and hedge funds are still short.

Hedge funds are short. CTAs are mechanically long. Volatility is compressed. That’s not a recipe for strength—it’s fuel for fragility. The Ivory Hill RiskSIGNAL™ remains red, and we’re sitting on 40% cash.
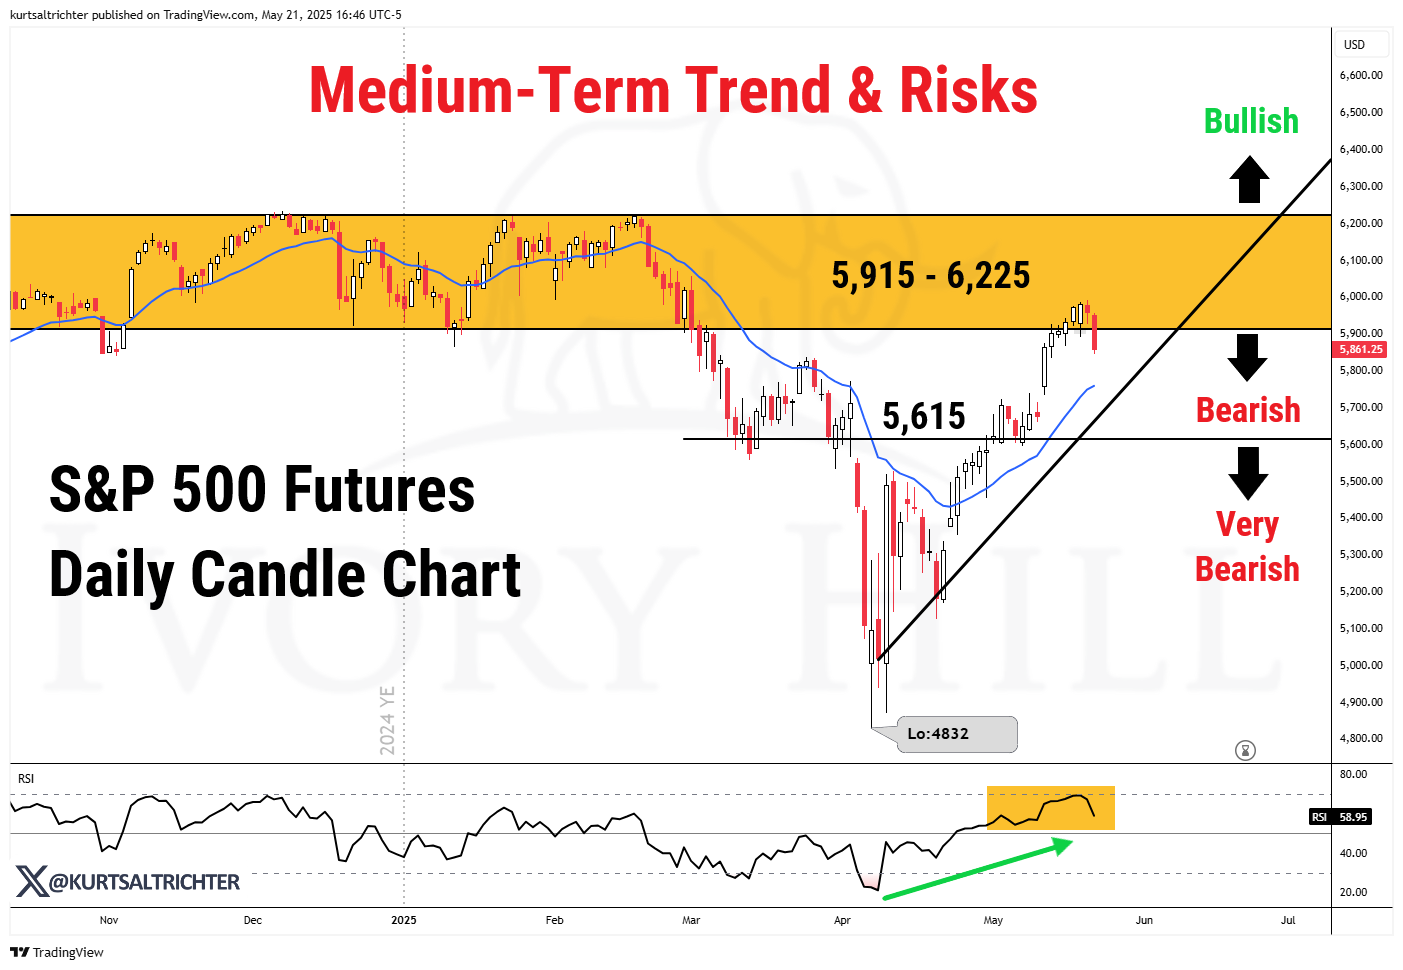
Resistance Zone: 5,915-6,225
Following the sharp recovery off the April lows, S&P 500 futures have pushed into a key supply zone between 5,915 and 6,225—an area that previously marked the early 2025 highs. This range now acts as major technical resistance, and while the uptrend remains intact, the market is showing signs of exhaustion.
The price action is testing the steep trendline that has guided the rally, while RSI has begun to roll over from near-overbought—signaling slowing momentum. A decisive break below 5,615 would mark a trend change and open the door to deeper downside risk. Until then, the benefit of the doubt remains with the bulls.
The Moving Average “Magnet”
If the RiskSIGNAL™ is right and we do see more downside from here, a clear sign that we are going to raise more cash is if we see the S&P 500 dive below the 200-day moving average. However, the 50-day EMA, 100-day EMA, and 200-day EMA have converged between 5,660.05 and 5,708.39, which will be a magnetic technical level if we see a further pullback in the broader equity markets.
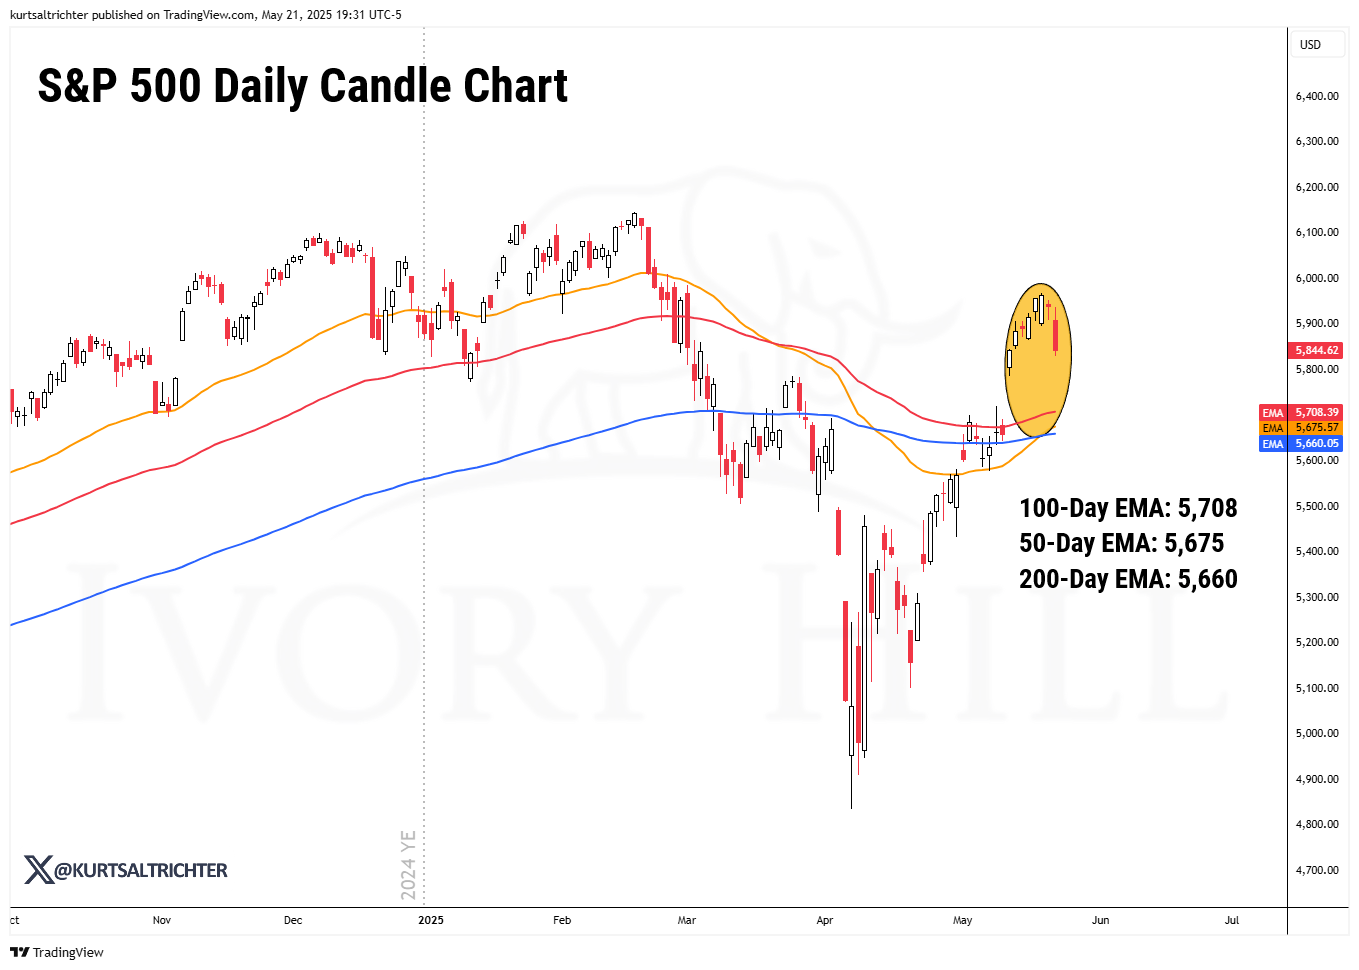
Be careful buying below the 200DEMA. Historically, when the S&P 500 loses the 200DEMA, it drops another ~17%–20% on average. That’s not a selloff worth chasing without confirmation.
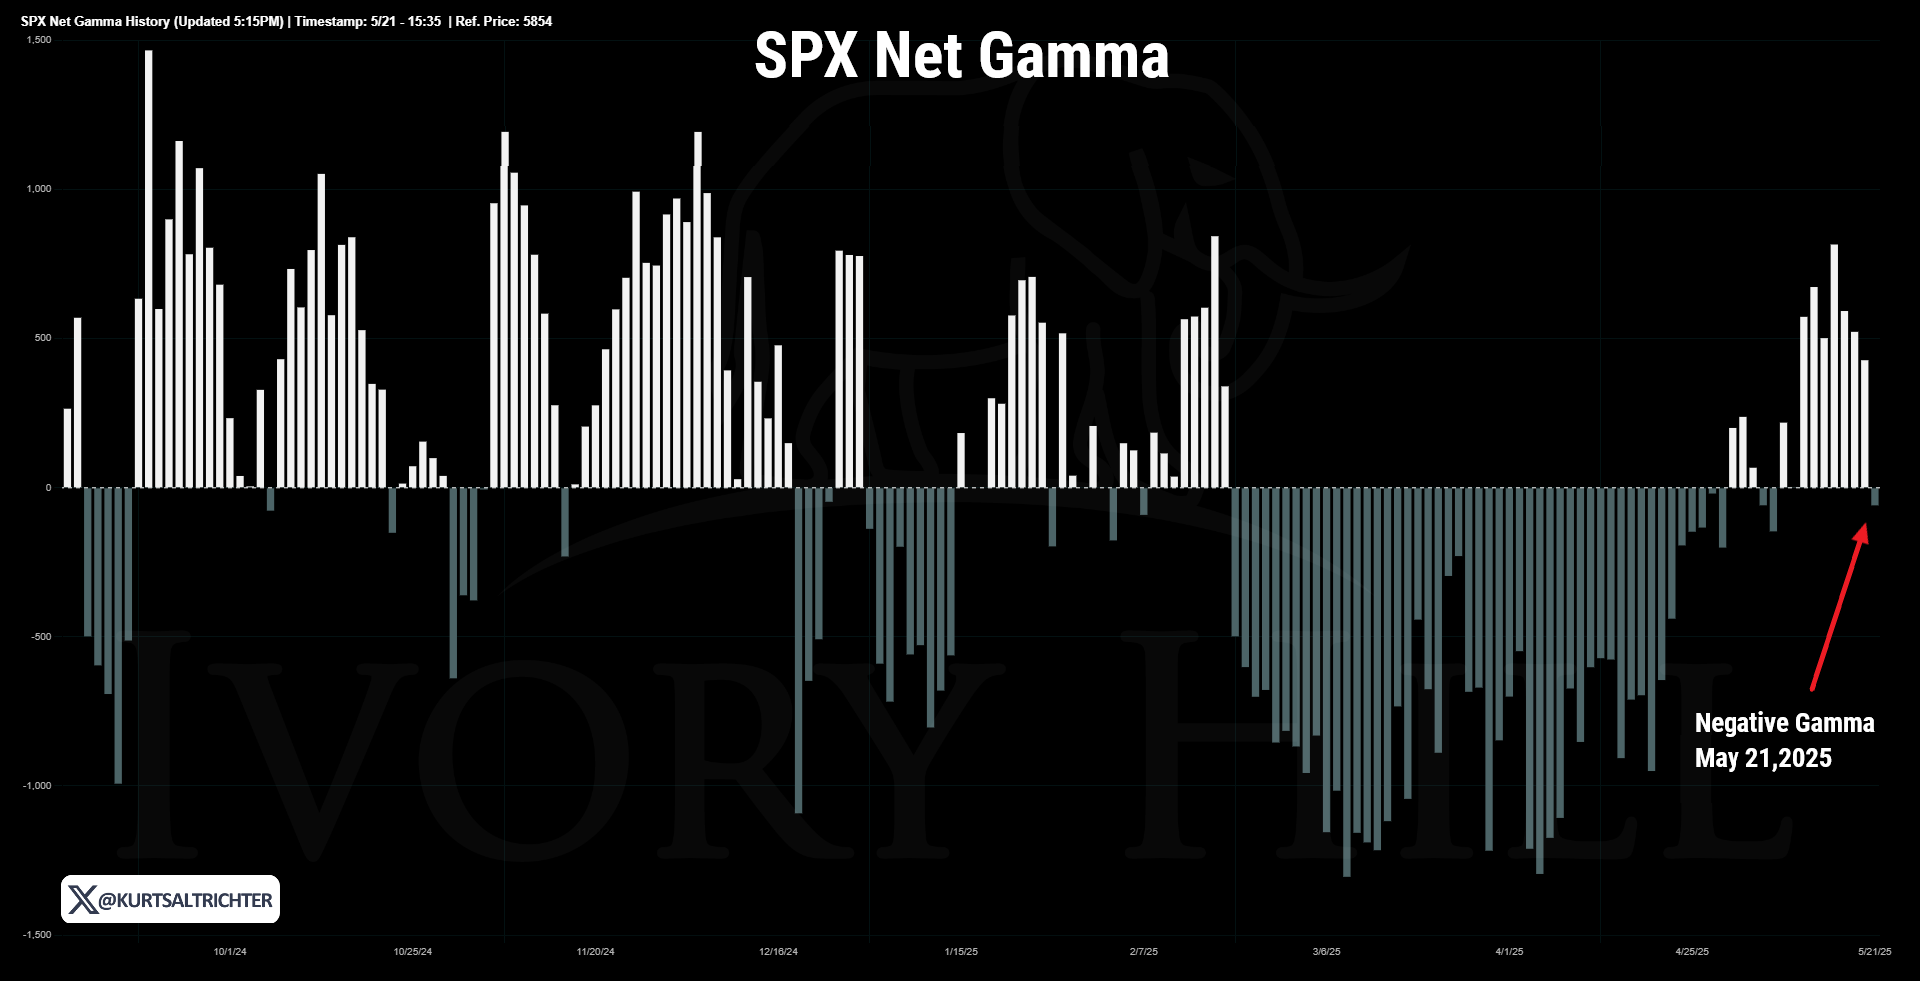
Dealer Gamma Exposure
Today, the market closed back in negative gamma territory. In this regime, dealers are forced to sell into declines and buy into rallies to stay delta neutral, amplifying volatility rather than suppressing it. This tends to fuel sharper intraday swings and can magnify otherwise minor catalysts. With SPX just 0.26% below the gamma flip line, positioning is effectively neutral, but leaning bearish.
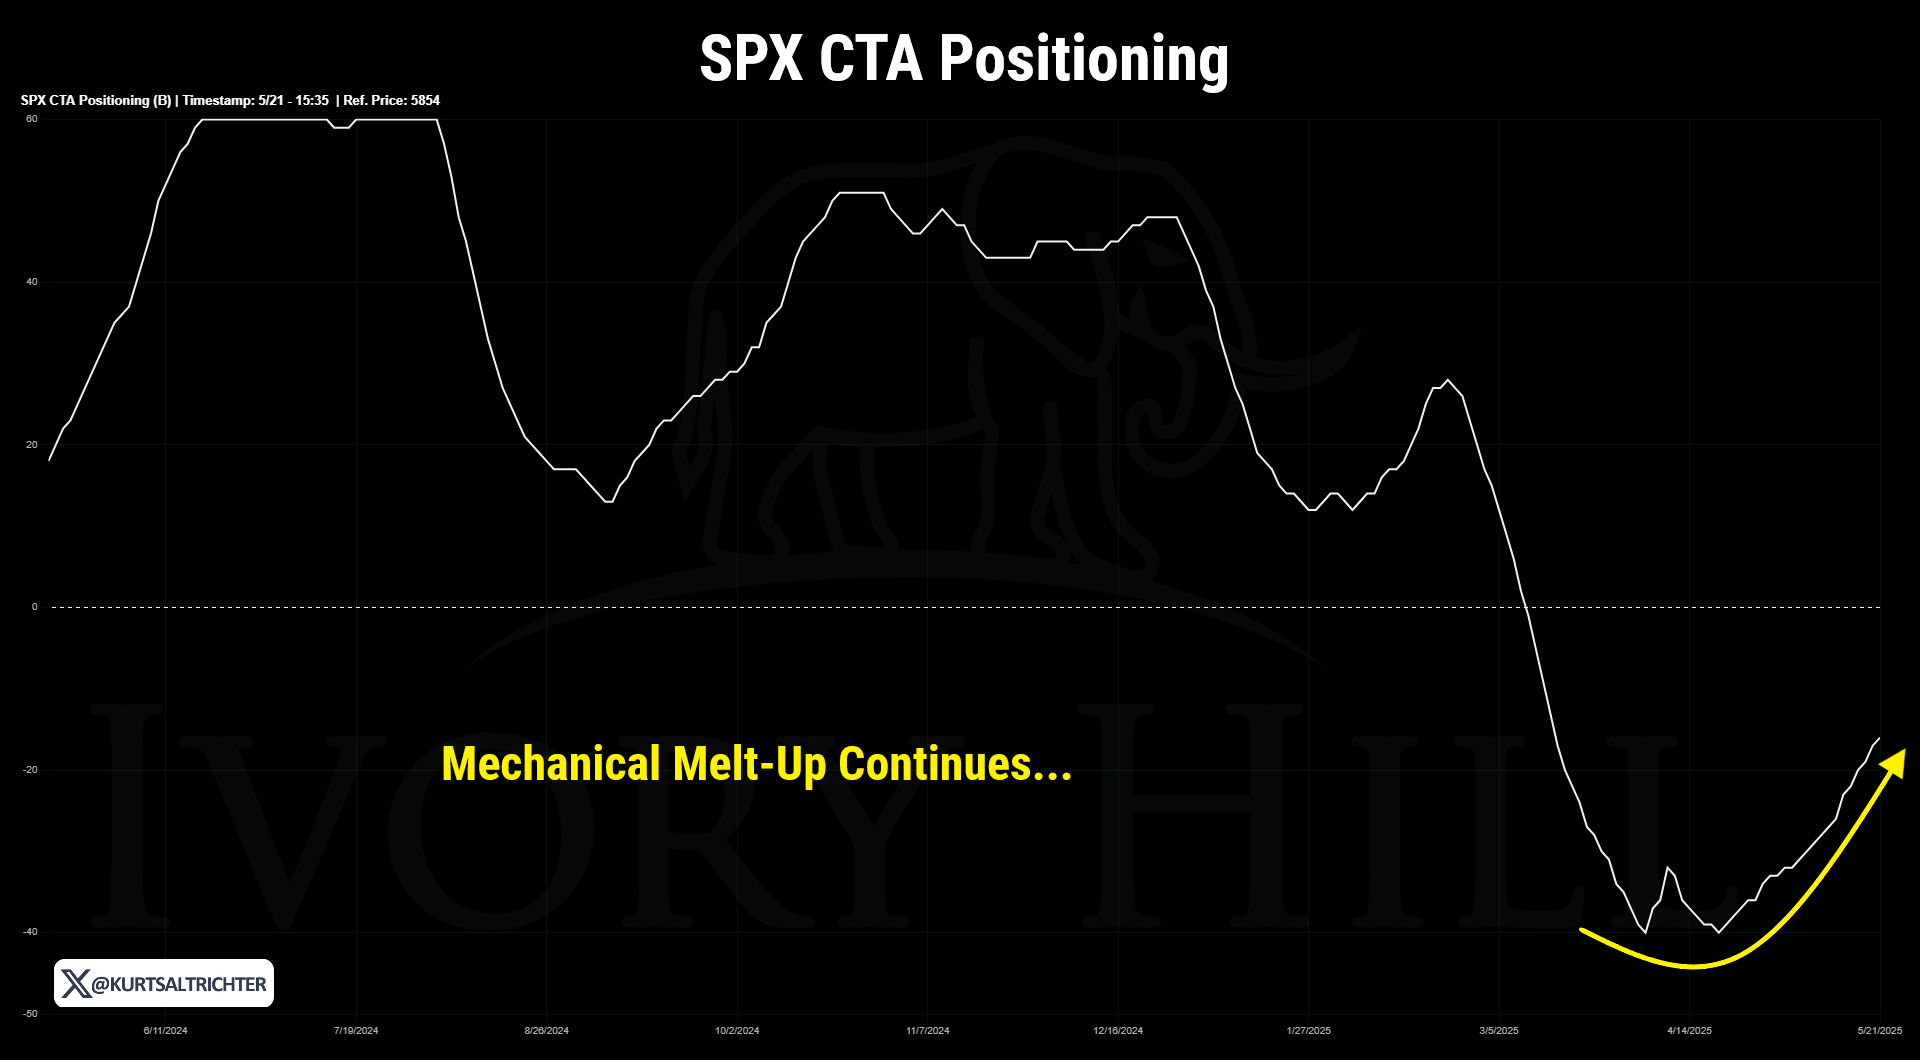
Systematic Positioning: CTAs & VolControl
Systematic funds—including Vol Control, and CTA strategies—use algorithms and quantitative models to adjust portfolio exposure based on volatility. Volatility acts as a “toggle”: when it rises, these strategies mechanically reduce equity exposure to control risk; when it falls, they increase exposure. These adjustments are made with no regard for fundamentals, economic data, sentiment, or even price—just volatility.
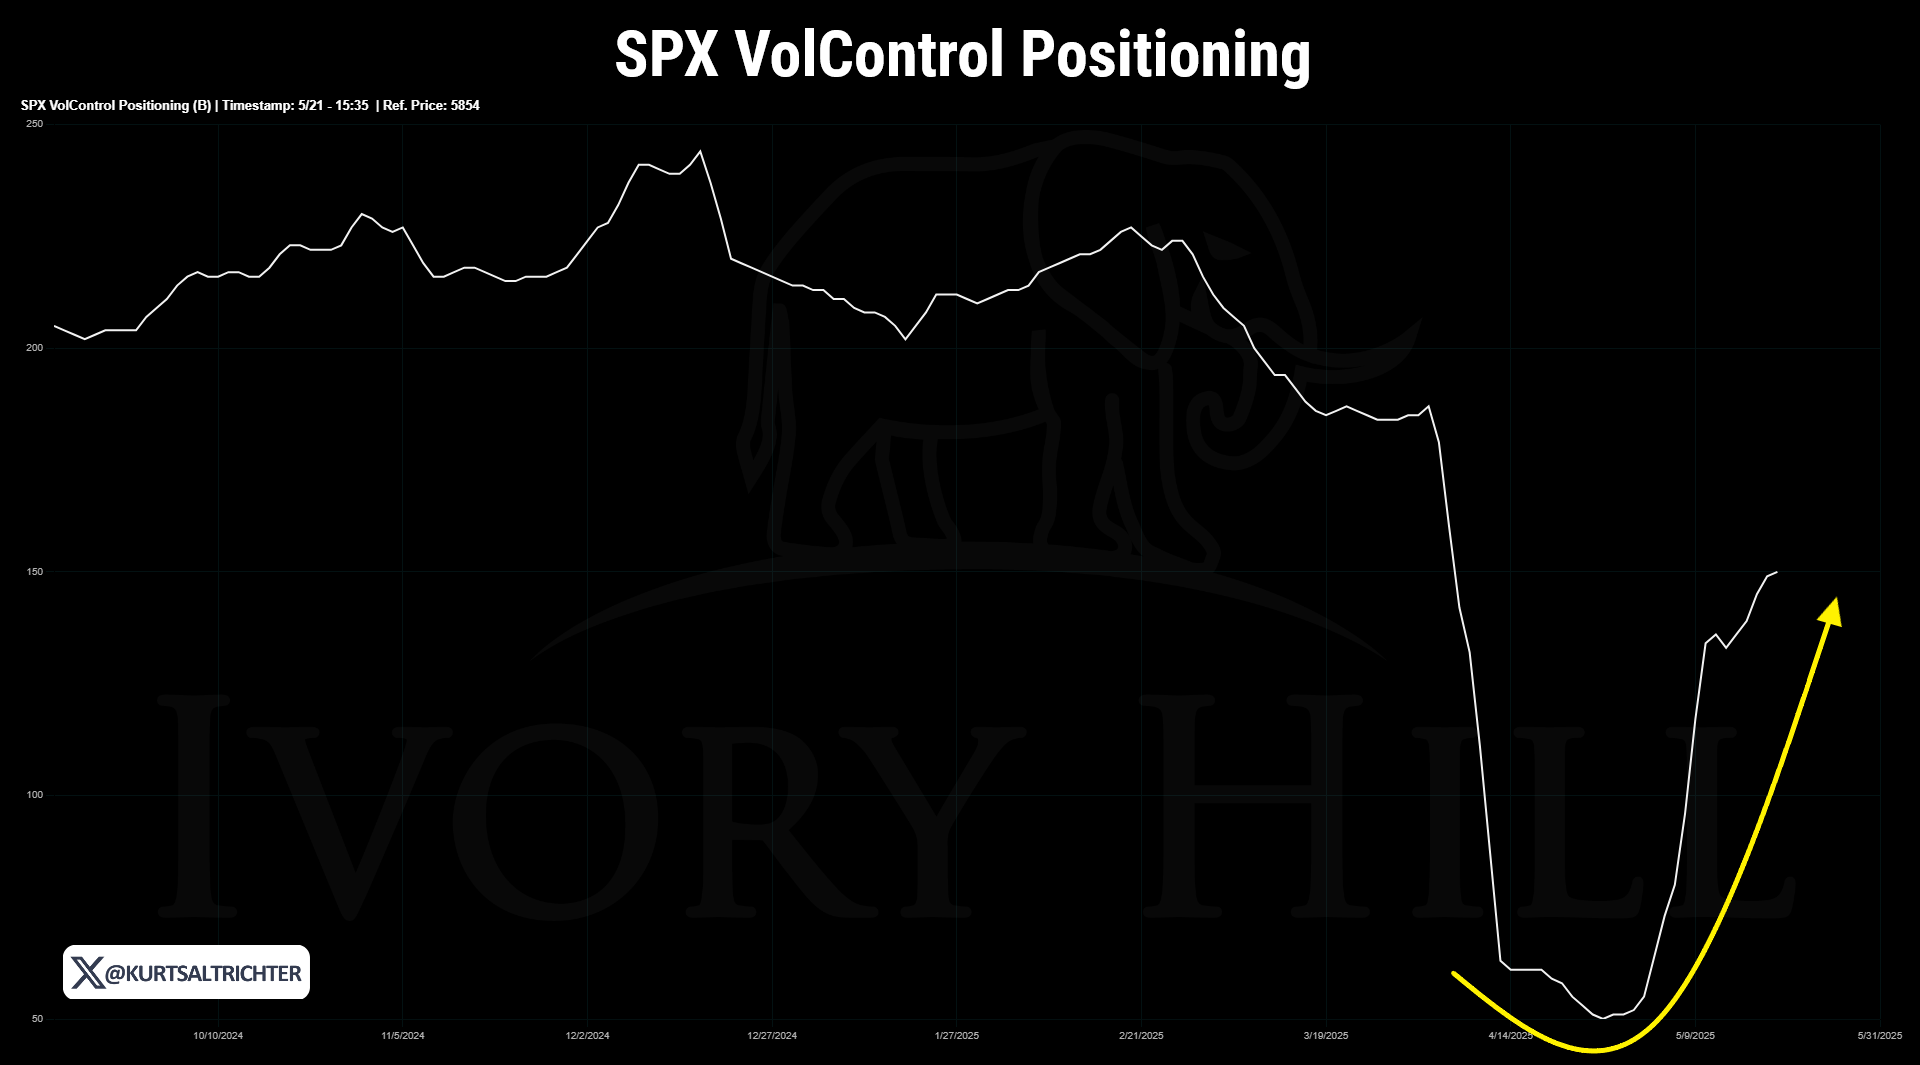
What This Tells Us
If volatility drops and markets are trending up, these strategies buy.
If volatility spikes or trend signals weaken, they sell.
How to Use It as a Tool
If they’re down to near-zero exposure (like in mid-April) and volatility is compressing, expect forced buying on any upside continuation like we have seen.
Today’s Interpretation
Systematic flows have flipped from a headwind to a tailwind. This rally has been mechanically driven, not fundamentally driven, meaning:
Volatility is compressed, triggering re-leveraging from VolControl funds.
Trend signals are positive, prompting CTAs to buy stocks.
What That Tells Us
Price strength is being amplified by forced buying, not discretionary investors.
Chasing this move has worked in the short term, but you're riding a wave of machine-driven demand.
If volatility spikes or the trend breaks, the same flows could unwind even faster than they turned up.
OpEx Volatility Trigger
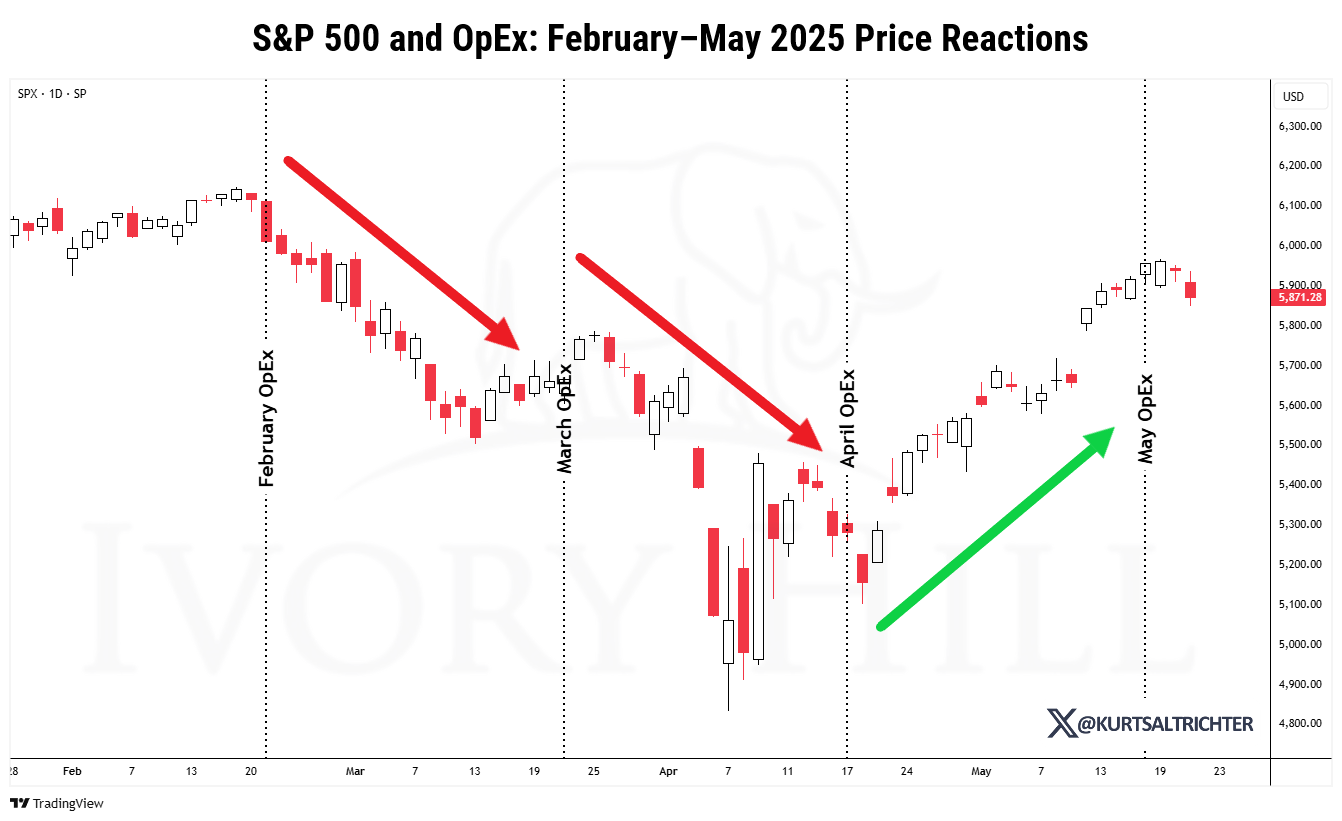
The chart above reinforces that options expiration (OpEx) plays a key role in short-term market turning points. Here’s how it ties into the broader narrative:
Structured Products & Derivative Income Funds
These funds often sell 25-delta puts and calls, leaving dealers long gamma going into OpEx. That suppresses volatility into the expiration date.
Post-OpEx Volatility Clusters
Once OpEx passes, that positive gamma exposure resets. Dealers reduce their hedges, which opens the door to directional volatility, often to the downside if macro pressure is present, which it is.
What the Chart Shows
February and March both saw selloffs immediately following OpEx.
April OpEx marked a turning point, setting up a V-shaped bottom, which is typical when the gamma overhang unwinds and macro sentiment shifts.
May OpEx shows a minor stall (so far), but the post-April rally aligns with the reset of dealer positioning and CTAs chasing upside momentum.
Takeaway
Every selloff this year has started the day after OpEx. Why? Because derivative-based strategies reset. Dealers unwind hedges, volatility comes back, and price dislocates. April was the cleanest example—bottom the week of OpEx, and +14% rally followed.
Now, with May OpEx behind us and the index consolidating just below 5,900, the next key move will likely be shaped by how CTAs, vol-control funds, and dealer gamma exposures evolve in the coming days. If volatility stays contained and macro data remains stable, these flows could support a continued push higher. But the risk of a reversal remains. Earlier in the year, each post-OpEx window brought weakness—suggesting this rally may be fragile if it's built on temporary positioning support. Any upside surprise in inflation (I believe CPI has bottomed) or rates could destabilize that foundation. With June OpEx approaching, the market could be setting up for another volatility event or short-term correction before a more durable trend emerges.
Hedge Fund Positioning: Still Net Short
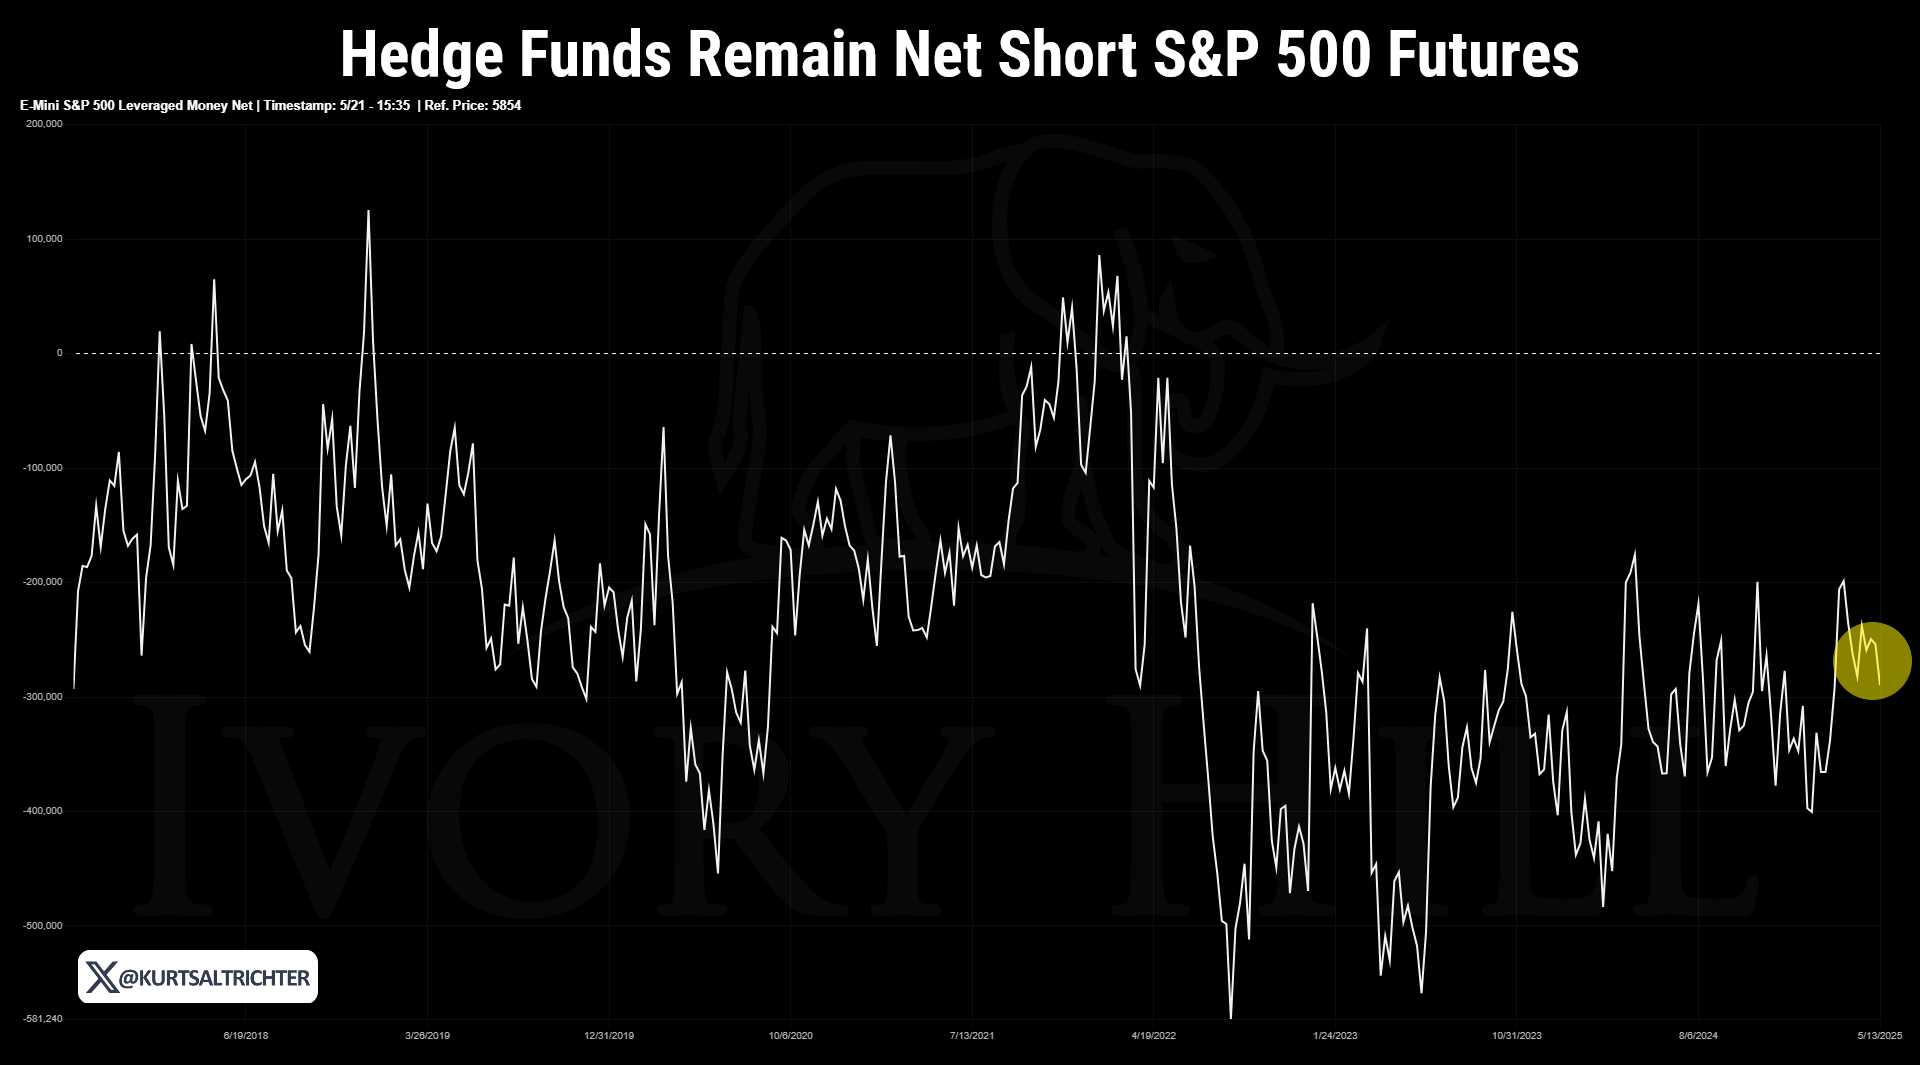
Finally, this chart showing Hedge fund net positioning in E-mini S&P 500 futures reveals a critical contradiction: while the index trades near all-time highs, hedge funds remain heavily net short. This isn’t cautious or neutral—it’s a clear bet against the sustainability of the rally.
This divergence signals two key risks: first, that the rally may be running on dealer flows and systematic positioning rather than true discretionary conviction; and second, that if volatility returns, these funds are already positioned to press downside momentum. On the flip side, if the market grinds higher, the pain trade is still up—forcing the fast money to cover, which would squeeze this rally a lot higher. Either path reinforces that we’re entering a high-stakes stretch of the cycle where positioning is far from settled, and OpEx windows, macro data, and volatility regime shifts will define the next move.
Bottom line: The RiskSIGNAL™ remains red. Inflation has likely bottomed, earnings are vulnerable, and the S&P 500 is trading above 21x forward earnings—an expensive multiple in a slowing, uncertain environment. I’m not bearish, I’m staying patient. If we see a breakdown, I’ll be a buyer in the 5,300–5,500 range, where I believe the “Trump put” kicks in. Until then, our cash levels will remain unchanged until our long-term signal brings us back into the market.
And remember - The one fact pertaining to all conditions is that they will change.
Feel free to use me as a sounding board.
Best regards,
-Kurt
Schedule a call with me by clicking HERE
Kurt S. Altrichter, CRPS®
Fiduciary Advisor | President
Email: kurt@ivoryhill.com | ivoryhill.com