
When Fear Takes Over
A Tactical Approach to Market Uncertainty

The Ivory Hill RiskSIGNAL™ turned red on Friday, March 7, and the cash build up continues, we further reduced exposure to risk assets, putting us at roughly 62% cash and short-term bond and 20% Treasuries.
We just saw the fifth fastest 10% correction in the S&P 500 in 75 years, meaning that selloffs like this tend to be a big overreaction. While this entire correction is attributed to fear from tariff policy whipsaws, this has now turned into a technical correction and a lot of damage has been done.

Fear is making its way back into the markets, and the signs are everywhere. Sentiment is turning bearish, the VIX is on the rise, and Treasury yields are sliding.
The real question is—do investors even know how to navigate fear? History suggests they don’t. Some are convinced this is just the beginning of something much worse.
Look at this chart—it lays it out clearly: major U.S. equity indices are slipping further from their highs.

The S&P 500 has dipped just 8% from its peak, while the Nasdaq has officially entered correction territory, down more than 10%. For the S&P, this is nothing more than a routine pullback.
History tells us that 5% declines in the S&P 500 happen three to four times a year, and even 10% corrections are a normal occurrence every couple of years. So far, there’s nothing unusual about this move.
I am waiting for our short-term signals to bring us back into this market.
Differentiating Short-Term vs. Long-Term Market Perspectives
The unpredictable execution of trade and tariff policies from the White House has weighed on consumer and business sentiment. This impact is now surfacing in corporate financials, as seen on Tuesday when companies such as Delta, Dick’s Sporting Goods, Kohl’s, and CSX either lowered their earnings forecasts or indicated that business conditions were weaker than expected. These developments provide clear evidence that policy instability from Washington presents a real risk to the market.

From a practical standpoint, this uncertainty is concerning because it threatens the projected S&P 500 earnings per share (EPS) of $270. A downward revision would further inflate valuations—at 5,600 and $270 EPS, the index is trading at 20.7 times earnings; if earnings drop to $260, that multiple rises to 21.5.
The ongoing policy swings have significantly clouded the short-term market outlook. Until investors gain clarity on the administration’s broader objectives regarding trade strategy, any short-term rally is unlikely to sustain momentum—more of an opportunity to reduce exposure than a sign of stability. The primary issue isn’t just the tariffs themselves; it’s the inconsistent way they are imposed, revoked, partially reinstated, or merely threatened. This unpredictability is what keeps markets uneasy. Until that changes, the best-case scenario may be for the market to hold within the current 5,600–5,900 range.
That said, while the near-term picture is uncertain, it would be premature to assume that this short-term turbulence will translate into a prolonged downturn. Here’s why:
Potential Policy Tailwinds – Future tax policy adjustments are expected, including possible extensions and increases in tax cuts, which could provide a boost to consumer spending.
Regulatory Environment – Deregulation efforts remain ongoing, which, as Jefferies strategist David Zervos has pointed out, can be one of the most effective pro-business strategies an administration can implement.
The Federal Reserve’s Role – The “Fed Put” remains intact. While it may not fully counteract trade policy uncertainty, it continues to support equities and risk assets.
Economic Experience in Leadership – Many senior figures in the administration have deep experience in markets and the broader economy. It is highly improbable that they would willingly pursue policies designed to harm the U.S. economy. While we may not yet have reached a point that necessitates direct intervention through a “Trump Put,” decisions are not being made by individuals unfamiliar with economic fundamentals.
To stabilize, the market needs clearer and more predictable policy direction. Until investors believe they can interpret the administration’s trade stance—particularly regarding Mexico and Canada—any market rebounds are unlikely to hold for long. However, while short-term negativity has increased, it is important not to assume that this will persist indefinitely. Beyond the current trade noise, future economic policies have the potential to provide meaningful support, offering some reassurance even in the face of recent volatility.
Is This Stock Market Selloff Justified?

Reviewing where market fundamentals stand is a good way to cut through the noise and focus on what is actually driving the market.
Stock Declines Justified: The recent pullback in equities is fundamentally driven and has brought the S&P 500 closer to fair value, marking the most reasonable valuation levels in months.
Market Drivers Shift: The primary market influences have narrowed to three key factors—Tariff Threats/Policy Chaos, Economic Growth, and Fed Policy Expectations—down from five in February. AI enthusiasm and the 10-year Treasury yield are no longer significant movers.
Current Valuation Range: The market multiple has adjusted to 20X-21X, down from 21X, indicating that while the pullback may not be over, fundamentals remain stable relative to sentiment.
Potential Market Trajectory: If policy uncertainty eases and economic data remains steady, a recovery toward 6,000 in the S&P 500 is plausible. On the other hand, if tariffs escalate and economic data weakens, a drop below 5,000 is a risk.
Market Conditions & Outlook
Current Situation:
Policy Uncertainty & Economic Growth: Tariff and policy instability continue to generate uncertainty, leading to concerns about economic growth. While some economic data, particularly consumer spending, has softened, overall fundamentals remain intact.
Fed Positioning: The Federal Reserve appears more open to rate cuts, contingent on policy developments, adding a stabilizing factor amid market volatility.
Fair Value Assessment: The S&P 500 has entered a valuation range supported by market fundamentals rather than sentiment-driven extremes.
Bullish Scenario – Market Improves If:
Policy Clarity Emerges: The administration rolls back tariffs or provides clear policy guidance, reducing uncertainty.
Economic Growth Holds: Key indicators such as PMIs, job reports, and consumer data remain resilient, easing slowdown fears.
The Fed Signals Rate Cuts: A clear indication of rate reductions in June could support risk assets and drive a market rebound.
Outcome: A reduction in uncertainty could drive the S&P 500 toward 6,000 in the coming months.
Bearish Scenario – Market Worsens If:
Tariff Escalation Continues: Additional tariffs or policy unpredictability could weigh heavily on sentiment and growth.
Economic Data Deteriorates: Weakness in leading indicators (PMIs, jobless claims, employment figures) would reinforce growth concerns.
The Fed Stays on Hold: If tariff uncertainty prevents the Fed from cutting rates, market support may weaken.
Outcome: A stagflationary environment could force a market re-rating, potentially pushing the S&P 500 below 5,000.
Conclusion:
While tariff-driven policy uncertainty and mixed economic data have pressured equities, fundamentals remain more stable than sentiment suggests. If market-moving headlines stabilize, the S&P 500 now trades within a fair value range, making it more attractive for long-term investors willing to navigate near-term volatility.
Junk Debt
I'm keeping a close eye on junk debt right now—one of the few intermarket indicators clearly signaling more downside.
High-yield bonds sit lower on the capital structure, making them among the first to crack when financial conditions tighten. They typically trade in line with equities when liquidity is abundant. But when junk debt starts selling off aggressively, it signals declining risk appetite and a shift toward safety—often a precursor to broader equity weakness.
JNK just broke its uptrend. It’s early, but this could be the start of a much larger unwind.

Junk bond yields just broke above the 2025 peak of 7.43%, signaling escalating risk in corporate credit. It’s too early to call a full-blown collapse, but this is a clear risk-off signal—money is rotating out of corporates.

Is President Trump Engineering a Recession?
A narrative is emerging that the Trump administration is intentionally pushing the U.S. toward a recession. While calling the following "research" might be a stretch, it's worth considering from a speculative standpoint—there could be real substance to it. In hindsight, we might look back and say, "The U.S. Treasury Secretary was signaling a market crash as a strategy to refinance U.S. debt."
Here is the rhetoric:
It becomes our economy 6-12 months out - Trump
There’s going to be a little (near-term) disturbance, but we’re OK with that - Trump
I would agree that it really becomes our economy 6-12 months from now - Bessent
We're seeing the hangover from the excess spending in the Biden 4 years (govt spending masking underlying private sector fragility). In 6 to 12 months, it becomes Trump's economy - Bessent
Our goal is to re-privatize the economy …. as we bring down government spending & get the private sector going that may not be a 1:1 ratio or match up exactly timewise - Bessent
The Market and the economy have just become hooked, and we’ve become addicted to this government spending … There’s going to be a Detox period - Bessent
Weakness following an administration transition can reasonably be attributed to the previous administration.
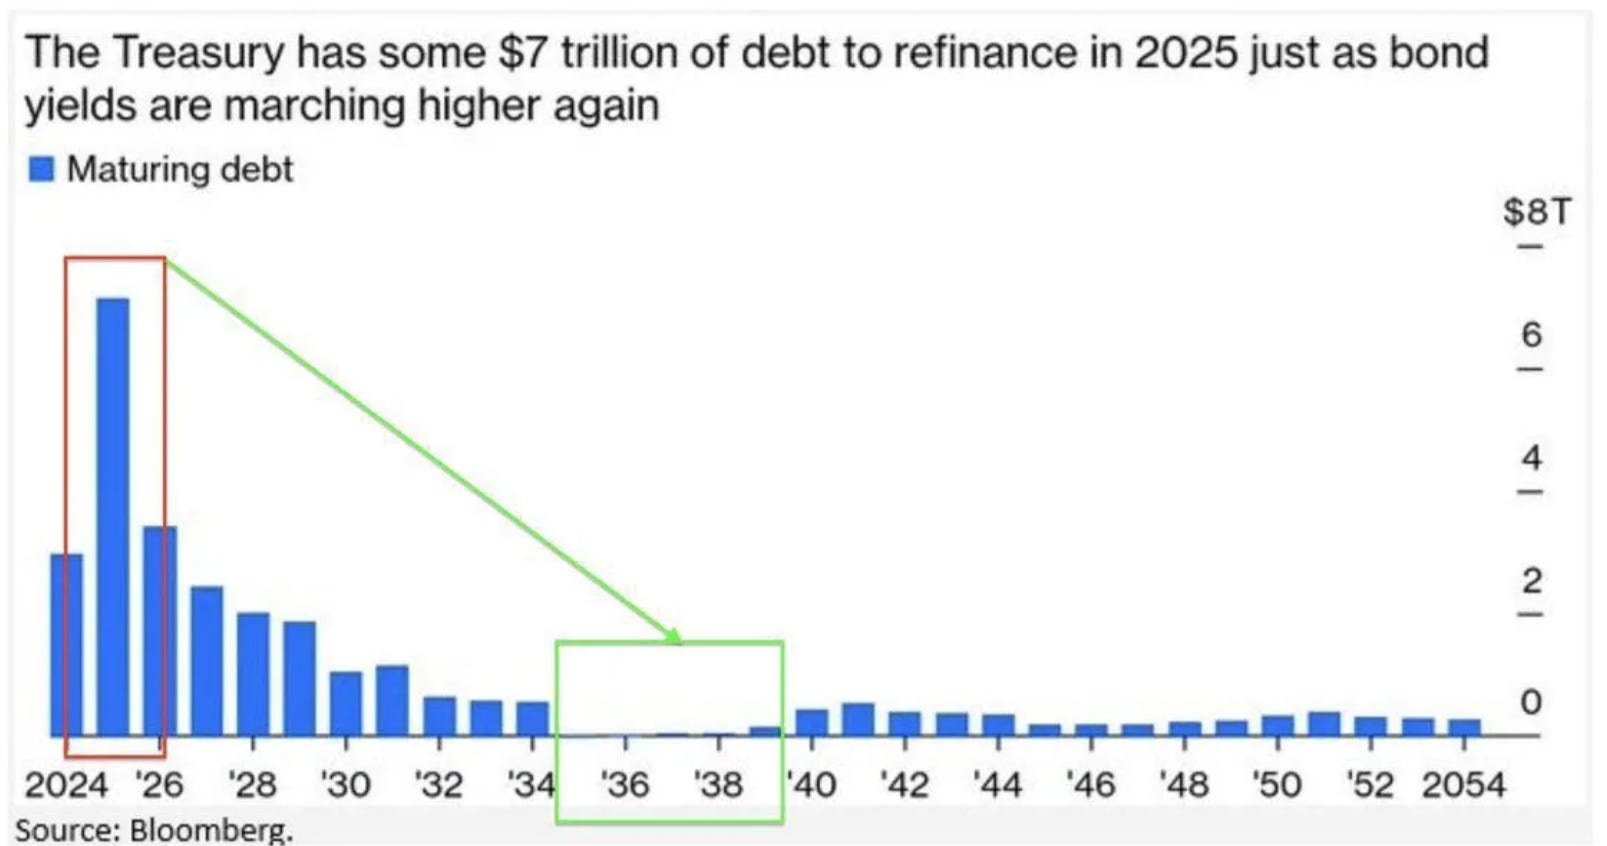
The theory is simple: break the market to force capital into Treasuries, driving down yields and reducing borrowing costs on $7 trillion in maturing U.S. debt in 2025.
How This Could Play Out
Debt Refinancing & Yield Suppression
The U.S. has $7 trillion in maturing debt that needs to be refinanced at sustainable rates.
High Treasury yields (4.2–4.5%) make borrowing expensive.
A market crash would trigger a “flight to safety trade” forcing investors into bonds, driving down yields and easing debt costs.
Equity-Treasury Relationship
The S&P 500 has already lost $4 trillion from its February 2025 peak.
As equities sell off, capital moves into Treasuries, strengthening the dollar and suppressing borrowing costs.
Manufacturing & Inflation Strategy
Tariffs drive short-term volatility but push long-term capital toward domestic production.
Market deflation resets cost structures, favoring U.S. manufacturing over cheap imports.
Credit Markets & Small Caps
Decades of government-driven distortions have broken price discovery.
By forcing a reset, small caps—stagnant since 2021—could finally have a real market again.
Portfolio Positioning: Aligned for the Shift
If this unfolds, long-term investors will be on the right side of history. The restructuring of financial markets will:
✔ Solve the U.S. debt maturing problem.
✔ Fix inflation.
✔ Restore a real stock market, free from artificial government support.
If this unfolds, consider it a necessary reset—an aggressive but essential treatment (chemotherapy) to undo 25 years of economic distortion.
We are already positioned exactly where we need to be: overweight U.S. Treasuries, underweight U.S. equities.

To be clear, this is purely speculation with no concrete proof. I could be entirely wrong. But there’s reason to believe it holds weight. During Trump’s first term, he made it a point to let everyone know the S&P 500 was the benchmark for his presidency.
Now, 54 days in, he’s been noticeably silent on the market.
Only time will tell.
And remember - The one fact pertaining to all conditions is that they will change.
Feel free to use me as a sounding board.
Best regards,
-Kurt
Schedule a call with me by clicking HERE
Kurt S. Altrichter, CRPS®
Fiduciary Advisor | President
Email: kurt@ivoryhill.com | ivoryhill.com
Awesome read
Markets definitely need a reset