
2025 Year-End Technical Targets, Will It Be Santa or the Grinch?
The make-or-break levels that will tell us which holiday path the market chooses.

The Ivory Hill RiskSIGNAL™ has weakened but remains green, and all pullbacks should be considered buyable. There are only about 18 trading days left in 2025, and I still think the S&P 500 will close above 7,000.

Before we dive into the technicals, I want to touch on the Fed chair announcement and why Kevin Hassett as Fed chair is not automatically bullish for stocks.
Stocks have ripped higher over the past two weeks, almost entirely because markets convinced themselves the Fed is shifting in a more dovish direction. That started with Williams hinting at a softer policy, followed by weak labor data and cooling inflation prints. The odds for a December cut went from barely above 50% to nearly a sure thing in a matter of days.
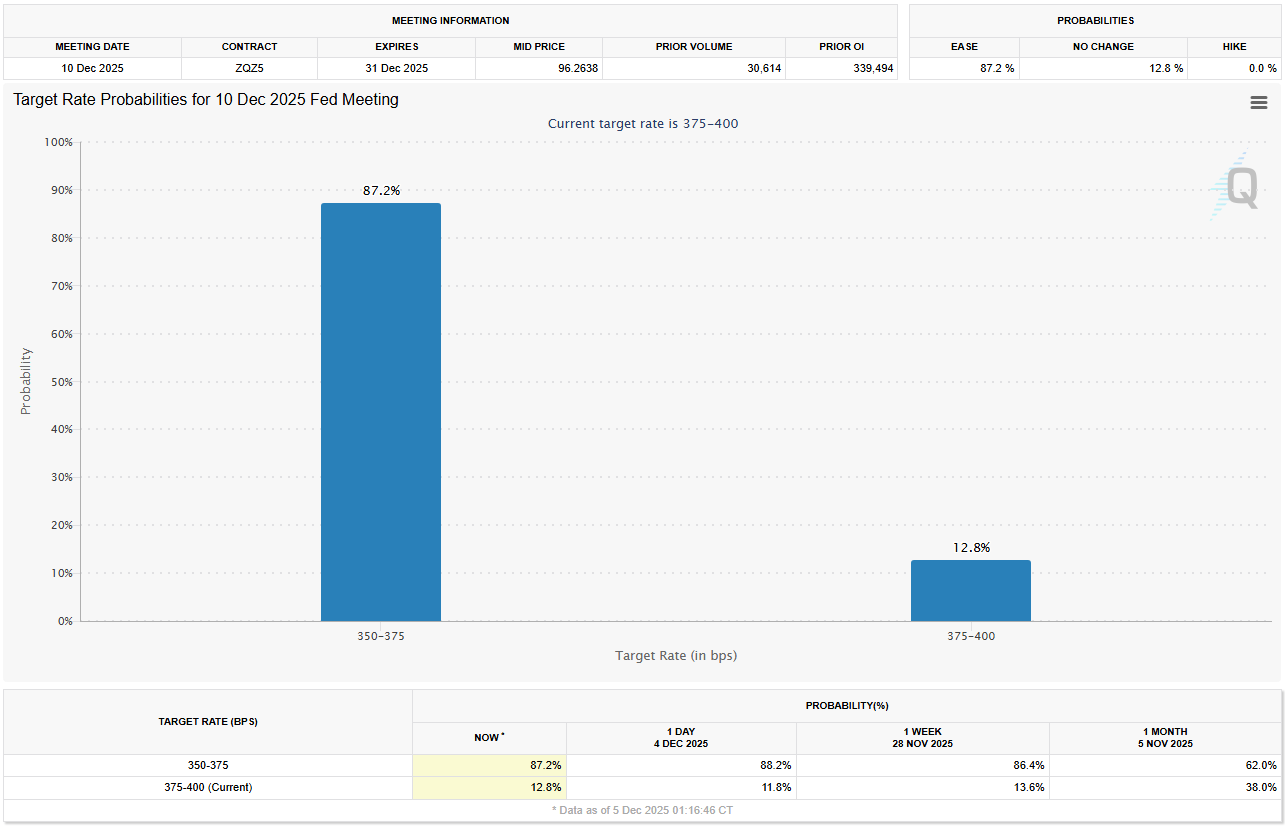
But there’s another layer driving this move that most investors are glossing over, and it has nothing to do with the December meeting. It’s the expectation that Kevin Hassett will be the next Fed Chair. Trump has basically telegraphed that he intends to nominate him in early 2026, and among the finalists, Hassett is seen as the clear dove. Markets are already pricing in a friendlier Fed once he replaces Powell in mid-2026.
Here’s the problem, and this is where things get messy. Stocks might love the idea of a more accommodative Fed, but bonds sure don’t. The 10-year yield jumped 10 basis points late last week and into this week, partly because of hawkish BOJ chatter but also because bond markets are nervous that Hassett could end up too dovish. If we get a chair who misreads the economy, caves to political pressure, or simply leans too hard on easy policy, then inflation could and likely will re-accelerate. That was the entire Arthur Burns saga in the 1970s, and nobody wants to replay that movie.
Hassett isn’t automatically a bad pick, but there’s one non-negotiable: whoever runs the Fed cannot appear compromised. Independence is the whole ballgame. If investors think the Fed is bending to politics, yields will shoot higher and erase any benefit from slightly lower Fed funds. That’s what the bond market is sniffing out right now.
As we head into 2026, that’s the bigger swing factor for stocks, not whether the Fed lands at 3.625% or 2.875%. Stability and credibility matter more than a quarter-point.
Where the Technical Targets Point Next, Santa or the Grinch?
The S&P 500 has fought its way back from the November washout and is now pressing right up against the same ceiling that stopped every rally attempt since late October. We’re basically back at the doorstep of the highs, which means the next meaningful move isn’t going to be small. When markets coil like this, they usually resolve with force, and the path they choose sets the tone for the year-end.
Using the updated charts, here’s where things actually stand now.
Key Support and Resistance
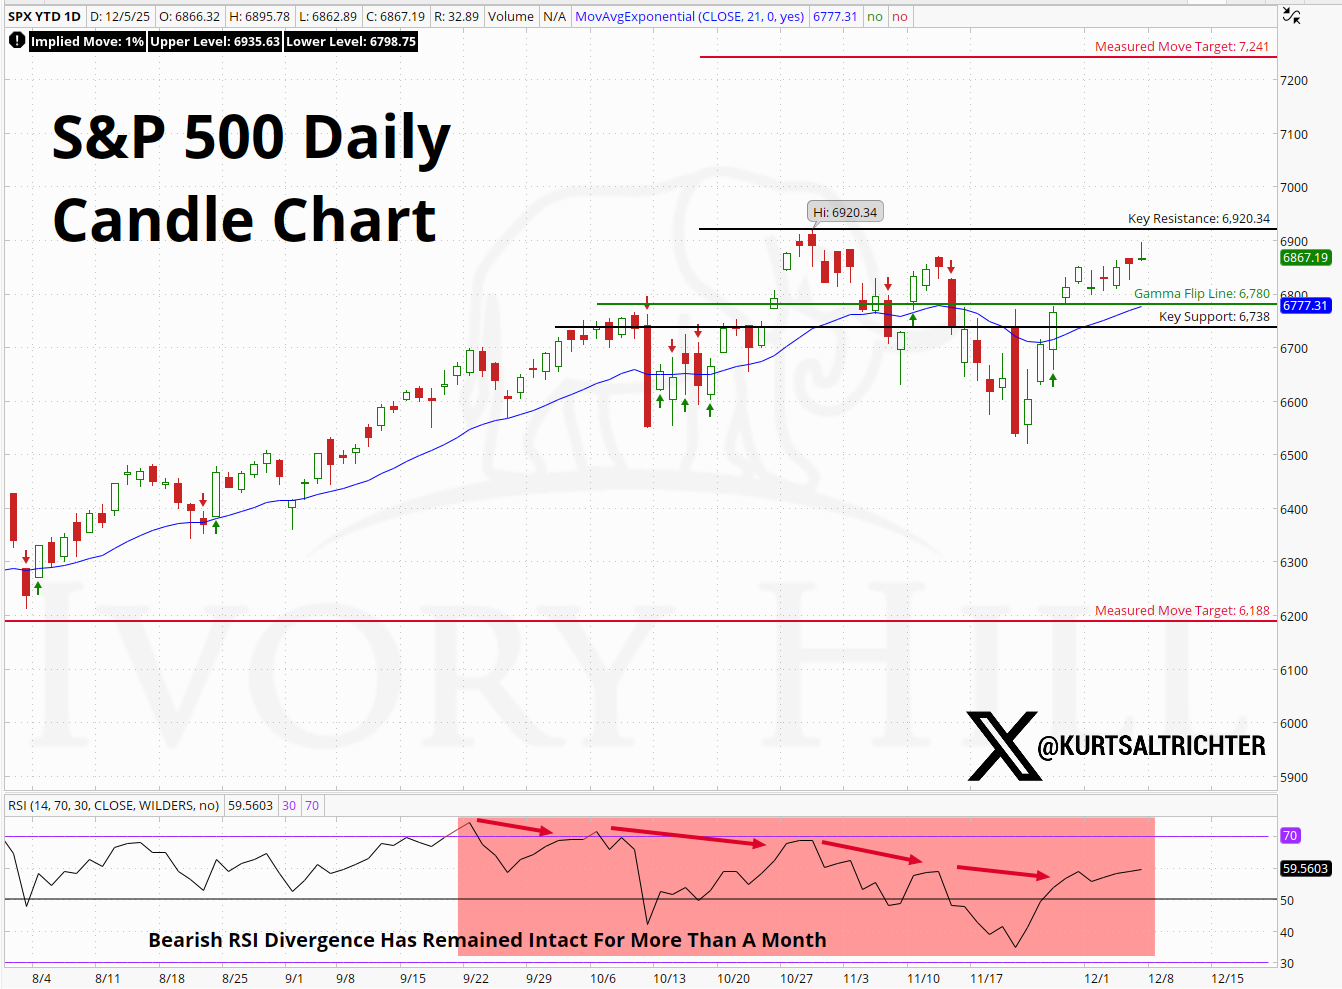
Initial resistance sits right at 6,920, the intraday high from October. This has been the line that keeps rejecting price, and we’re right underneath it again. If the market wants a Santa Rally, this is the door it has to kick in.
Above that, nothing technically meaningful stands in the way until the measured move target at 7,241.
Support is cleaner now.
The Gamma Flip Line comes in around 6,780, and the price has been respecting that level on every pullback. A break below it doesn’t end the trend, but it changes the tone quickly.
Below that, the key support sits around 6,738. This is the pivot level from the mid-November reversal and the first spot where buyers stepped back in after the washout.
If that level fails, the picture gets more defensive. The October trendline is already broken and retested, so the market no longer gets the benefit of the doubt on trend support.
Measured Move Framework
With price boxed in between well-defined levels, the measured move targets matter more now.
Upside trigger: A close above 6,920 activates the upside target at 7,241. That’s your year-end melt-up scenario.
Downside trigger: A close below 6,188 re-opens the downside measured move zone. That level remains the floor of the broader structure.
These levels don’t require prediction, just awareness. Once the market picks a side, it tends to follow through.
Fibonacci Landscape
The Fibonacci retracement chart reinforces the same message: if the market slips into a meaningful pullback, there are obvious levels beneath the surface where buyers should show up.
From the April lows to the October highs, the key downside Fib levels are:
23.6%: ~6,428
38.2%: ~6,123
50%: ~5,877
61.8%: ~5,631
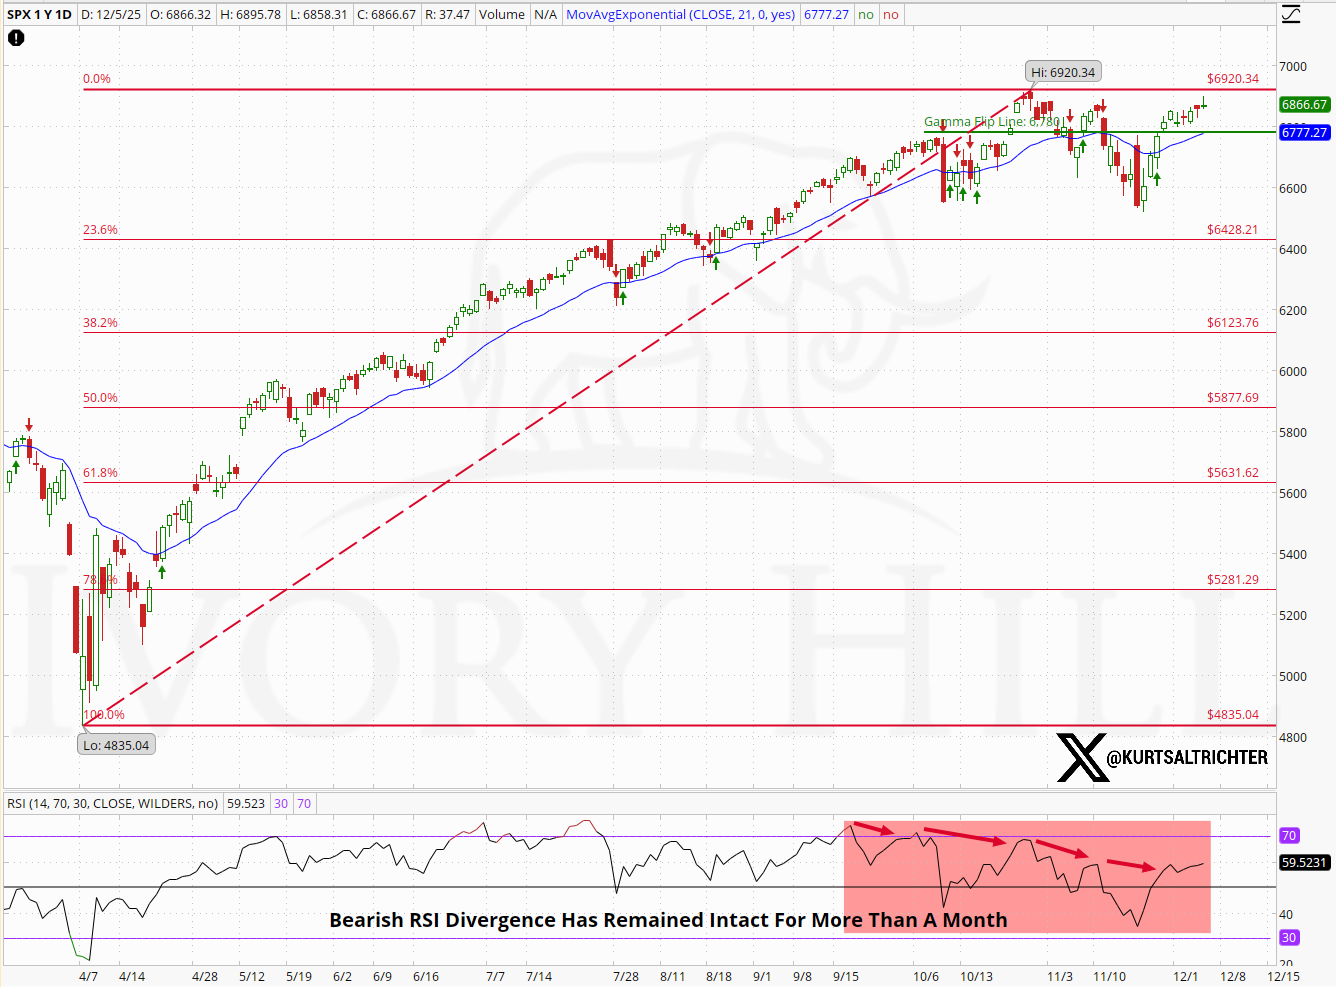
Anything deeper than the 23.6% retracement becomes increasingly unlikely unless macro or liquidity conditions deteriorate quickly. But it’s still helpful to know where price tends to re-anchor if momentum finally gives way.
One More Thing: RSI
The bearish RSI divergence highlighted in your chart is still intact and has been for more than a month. That doesn’t guarantee a top, but it does tell us momentum is slowing even as price pushes toward the highs. Divergences don’t matter until they suddenly do, and they typically resolve with either a short burst higher to “blow it off,” or a quick air-pocket lower.
We’re now at the point where either outcome is entirely on the table.
Bottom Line
The market has worked itself back to a critical decision point. A clean breakout above 6,920, and we likely get a year-end melt-up. A failure here, paired with that persistent RSI divergence, and the next real test becomes 6,780, then 6,738.
We don’t need to guess which way it goes. We need to be ready when the tape finally commits.
And remember - The one fact pertaining to all conditions is that they will change.
Follow me on X for more updates.
Best regards,
-Kurt
Schedule a call with me by clicking HERE
Kurt S. Altrichter, CRPS®
Fiduciary Advisor | President
Disclosure
The RiskSignal Report is published by Ivory Hill, LLC. All opinions and views expressed in this report reflect our analysis as of the date of publication and are subject to change without notice. The information contained herein is for informational and educational purposes only and should not be considered specific investment advice or a recommendation to buy or sell any security.
The data, models, and tactical allocations discussed in this report are designed to illustrate market structure and positioning trends and may differ from portfolio decisions made by Ivory Hill, LLC or its affiliates. Investing involves risk, including the possible loss of principal. Past performance is not indicative of future results.
Ivory Hil, LLC, and its members, officers, directors, and employees expressly disclaim any and all liability for actions taken based on the information contained in this report.