

Welcome back to The Gamma Report.
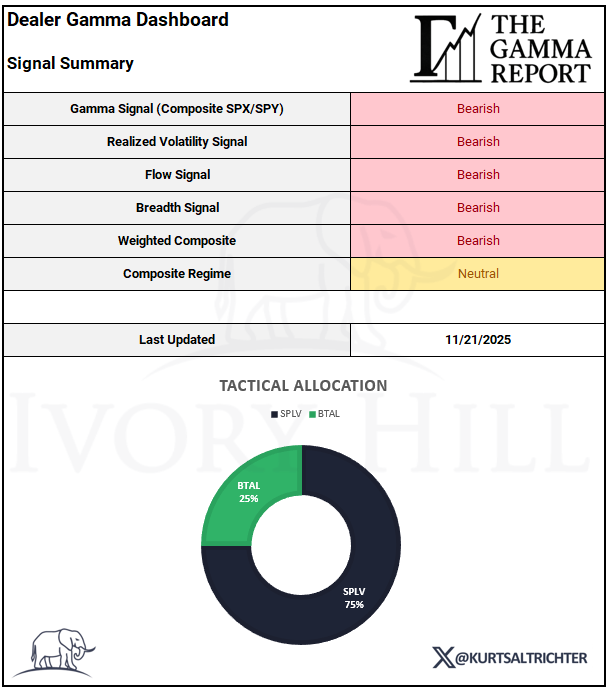
Signal Summary
Under the surface, the structure cracked further. Dealer gamma pushed deeper into negative territory, realized volatility kept firming, breadth slipped again, and systematic support from CTAs and vol control faded. The composite regime finished the week Neutral, but every component signal registered Bearish. This is what a fragile tape looks like.

Your tactical allocation for the week ending 11/21 is SPLV 75% and BTAL 25%.
Gamma Signal
Dealer positioning spent the entire week on the wrong side of the flip line. Net SPX/SPY gamma moved from shallow negative territory into a more pronounced negative pocket by Friday.
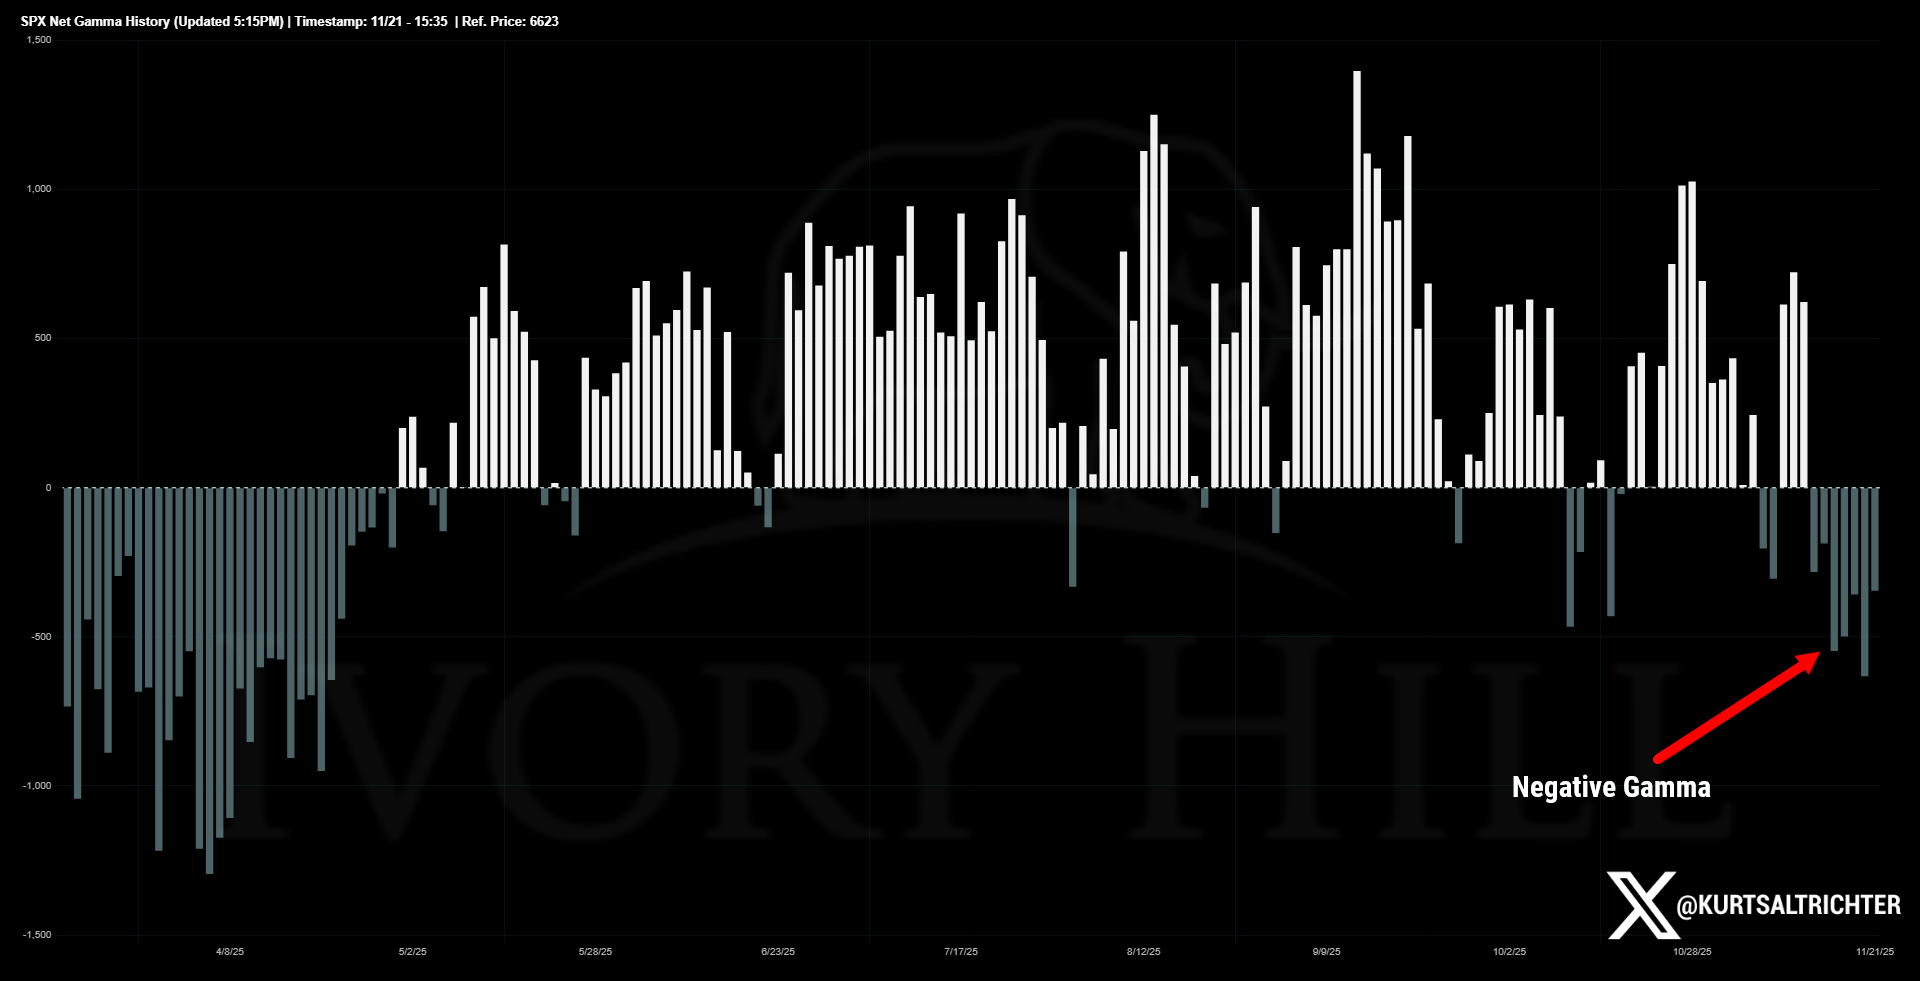
In positive gamma, dealers lean against moves and suppress intraday swings. In negative gamma, that force flips. Dealers hedge with the trend, which can turn shallow dips into sharper slides and squeeze rallies higher when they get caught leaning the wrong way.
With SPX stuck below the flip line, the tape is now more sensitive to incremental volatility, headlines, and flows. Until price can reclaim the flip line and hold it, traders should expect choppy sessions where moves extend further than they “should.”
Realized Volatility Signal
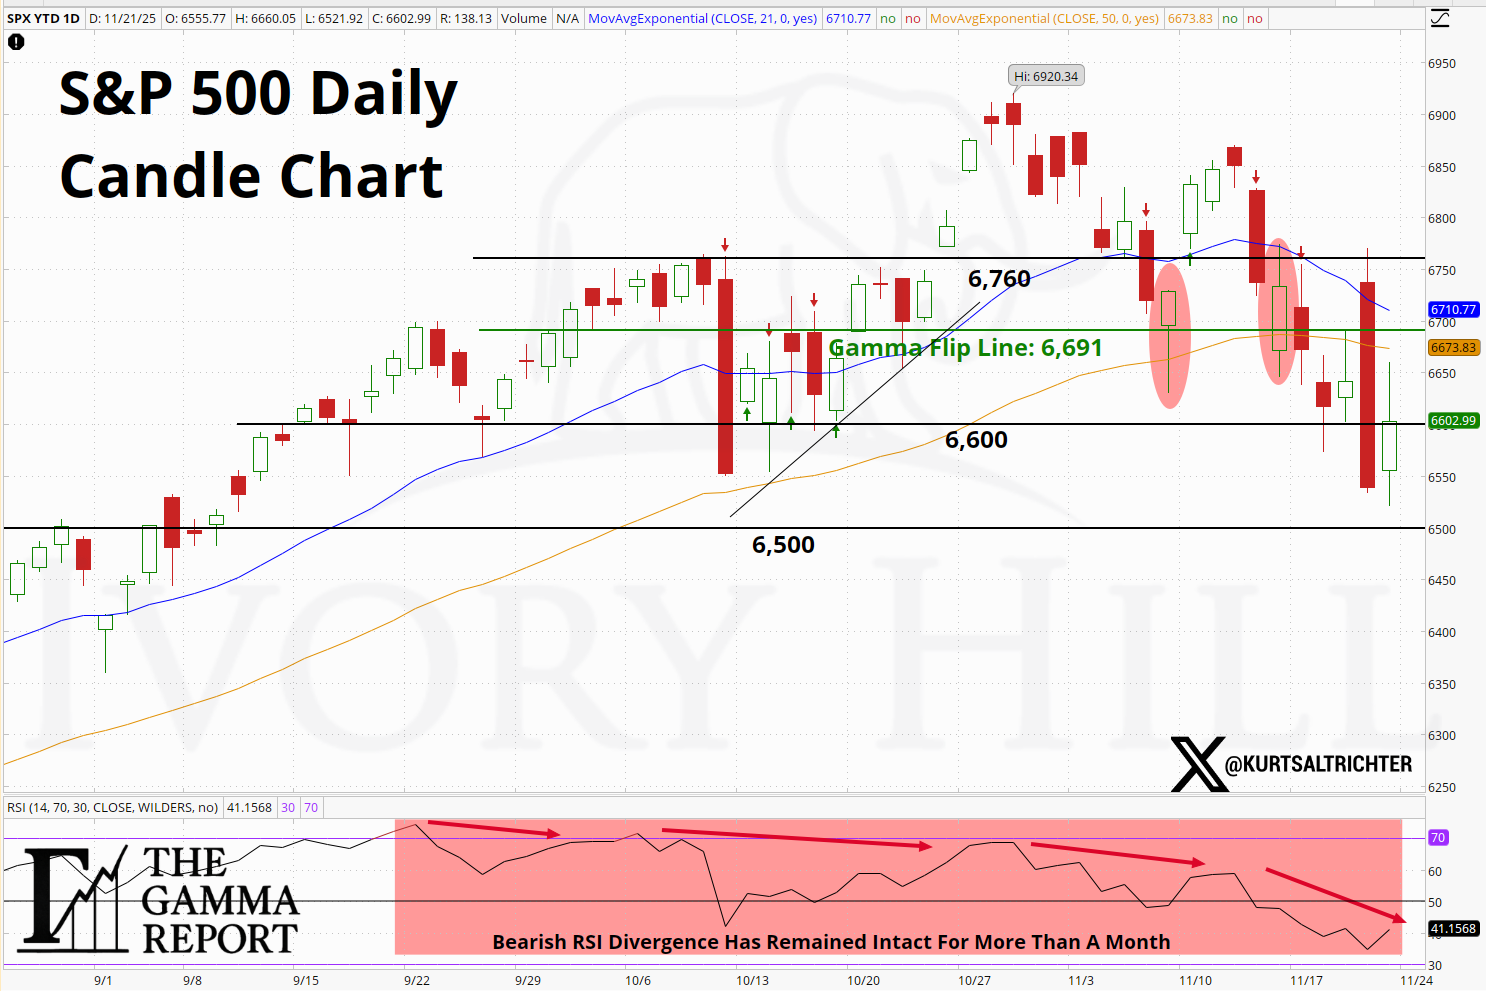
Last week, the price found support near the 6,600 level, with the next key level near 6,500. The gamma flip line now sits at 6,691, just above Friday’s close, which keeps spot in the unstable zone.
The bearish RSI divergence, which has been in place for more than a month, remains intact. Each rally attempt has produced lower highs in RSI, even as price retested prior peaks. That pattern usually points to tired momentum and rising risk that pullbacks carry more bite.
On the volatility side, 30-day realized volatility ended the week at 13.89, up from 12.55 the prior week. 90-day realized volatility finished at 11.78, slightly higher than 11.40. The message is simple: realized vol is grinding higher, not rolling over.
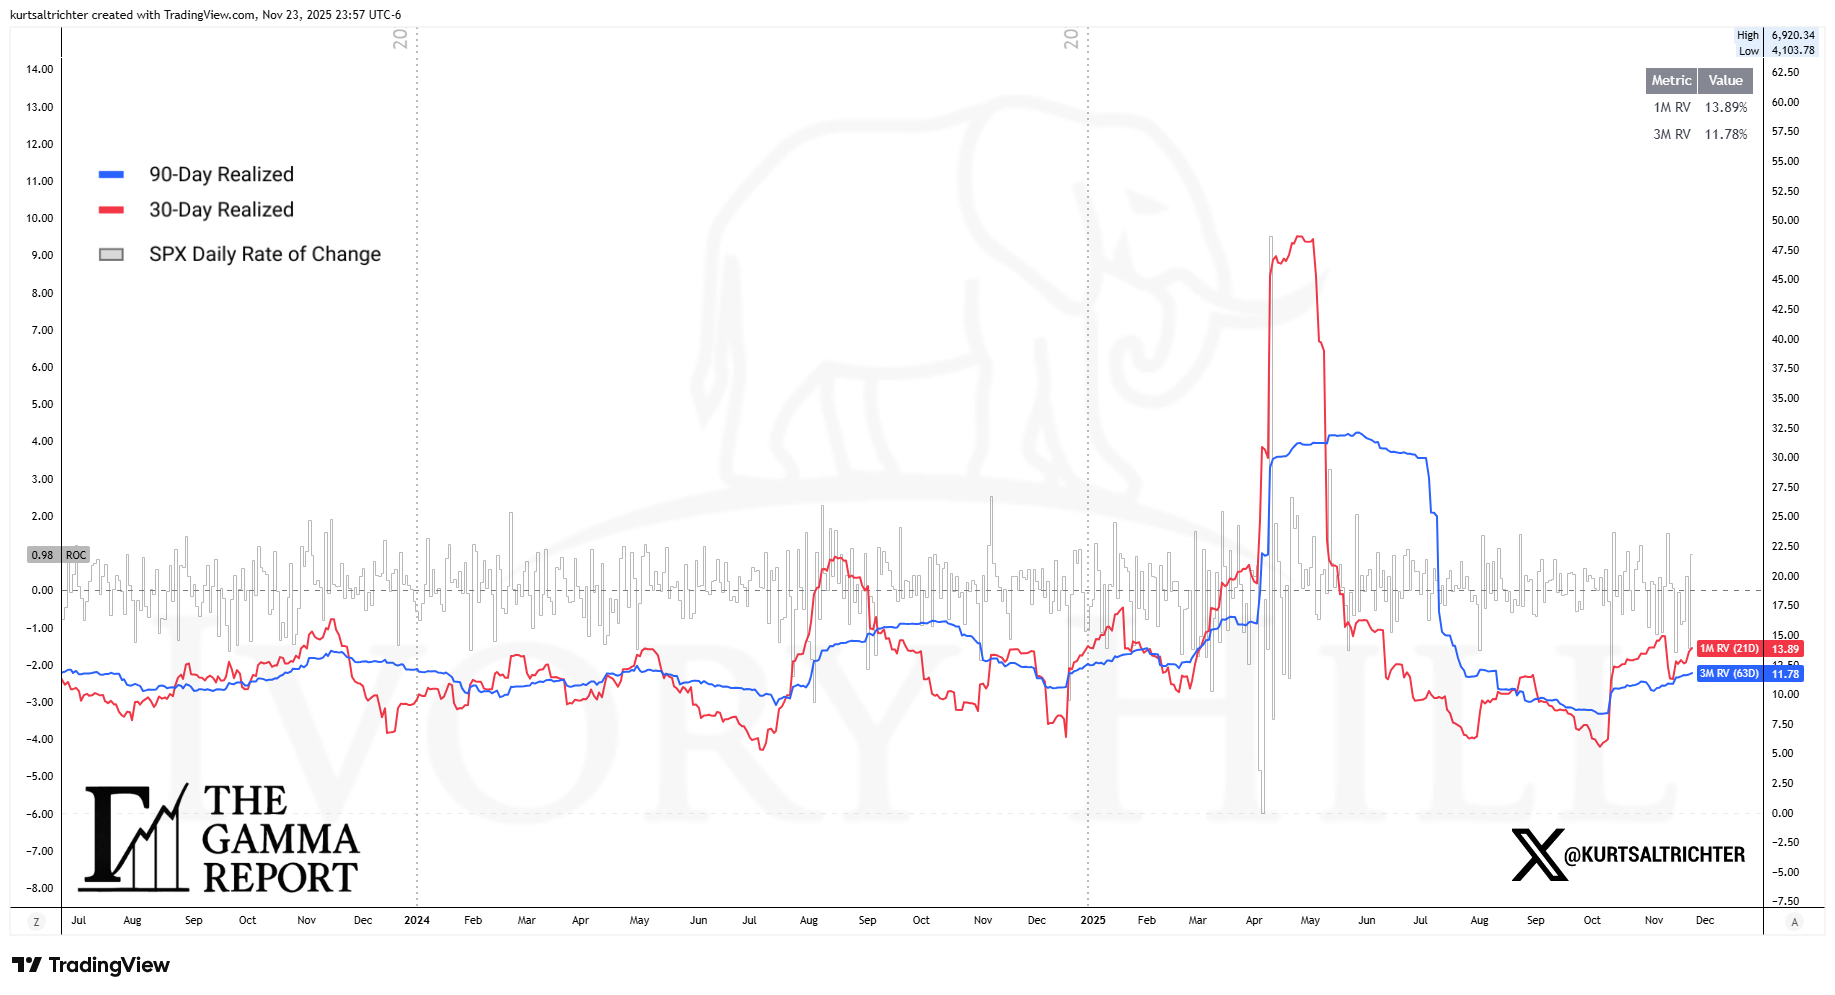
The signal now scores Bearish. Realized vol is still low in an absolute sense, but the direction of travel has turned firmly higher. Markets trade on changes, not absolute levels. As long as short-term realized vol keeps ticking up while price trades below the major moving averages and the gamma flip line, the burden of proof lies with the bulls.
Flow Signal
Systematic flows weakened again last week.
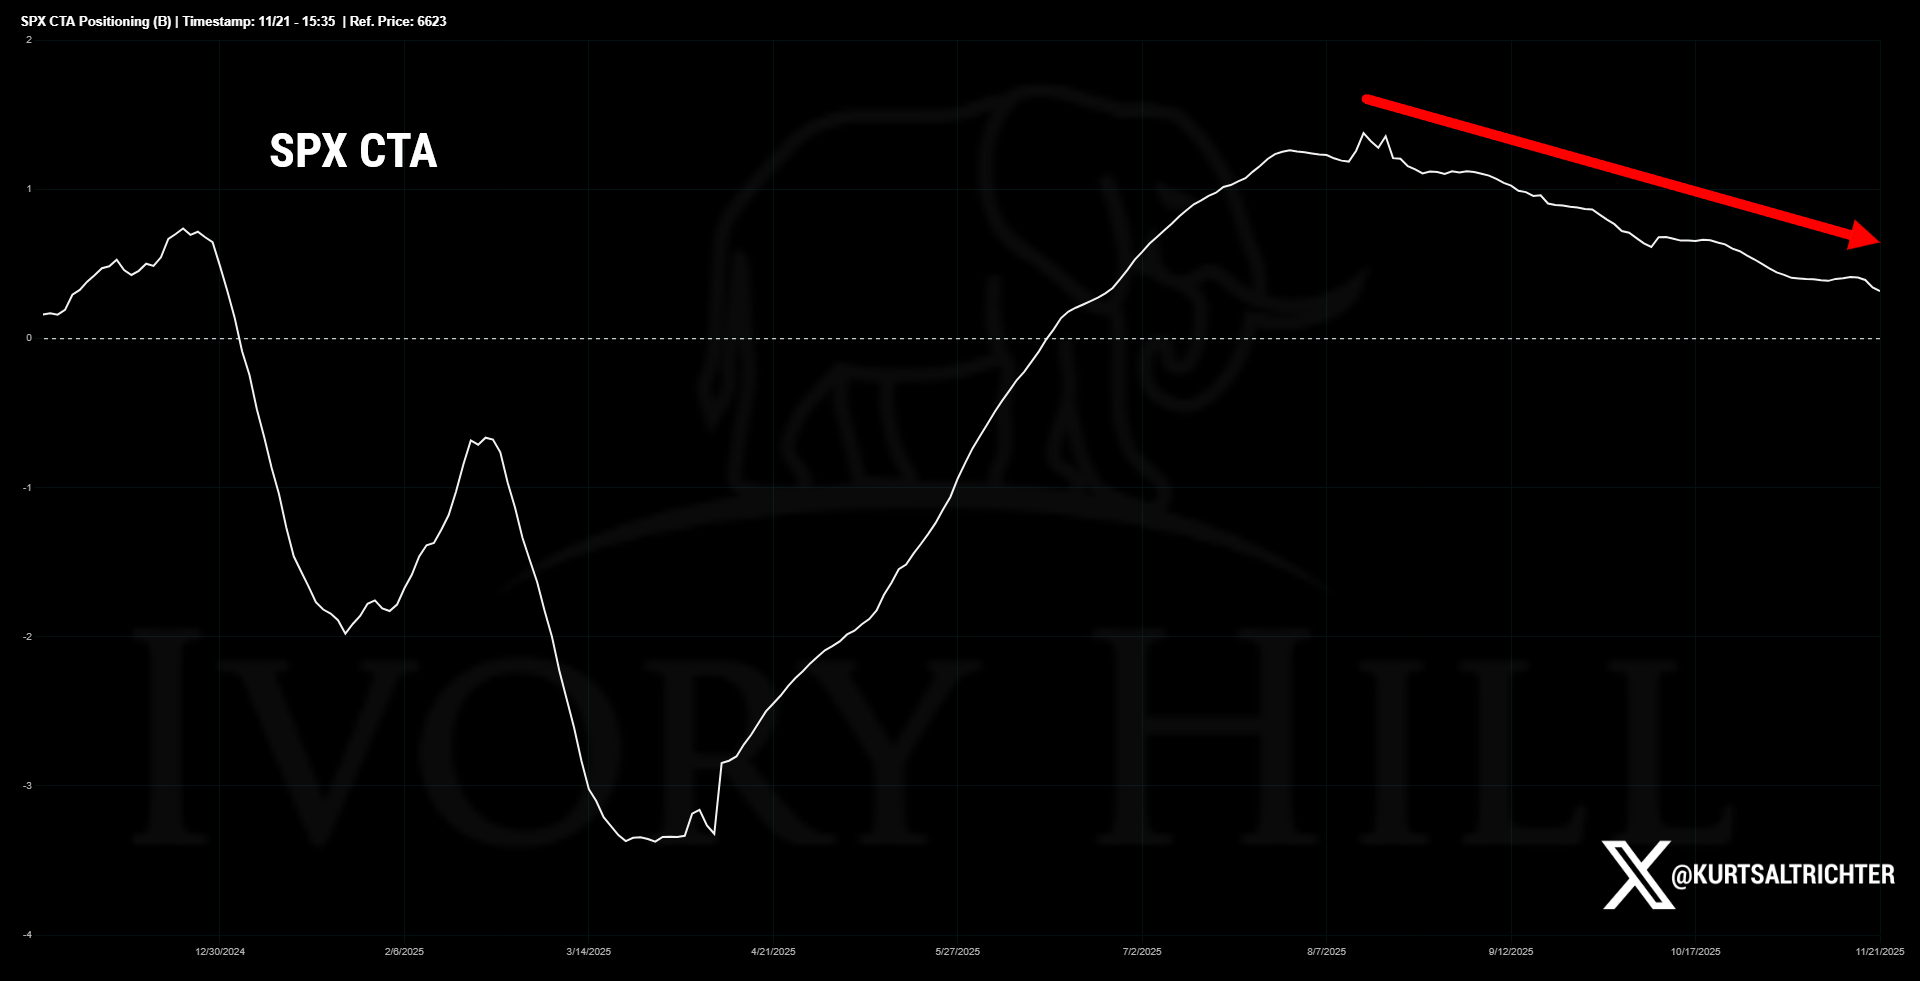
CTA positioning in SPX has been bleeding lower from strong net long for weeks. They are still long, but their exposure has drifted down toward the middle of the historical range. That removes one of the big incremental buyers that helped push the market to the recent all-time-highs.
Vol control strategies have also started to back away. After ramping exposure through most of the autumn, their notional exposure has rolled over from the highs and continues to trend lower as realized vol firms.
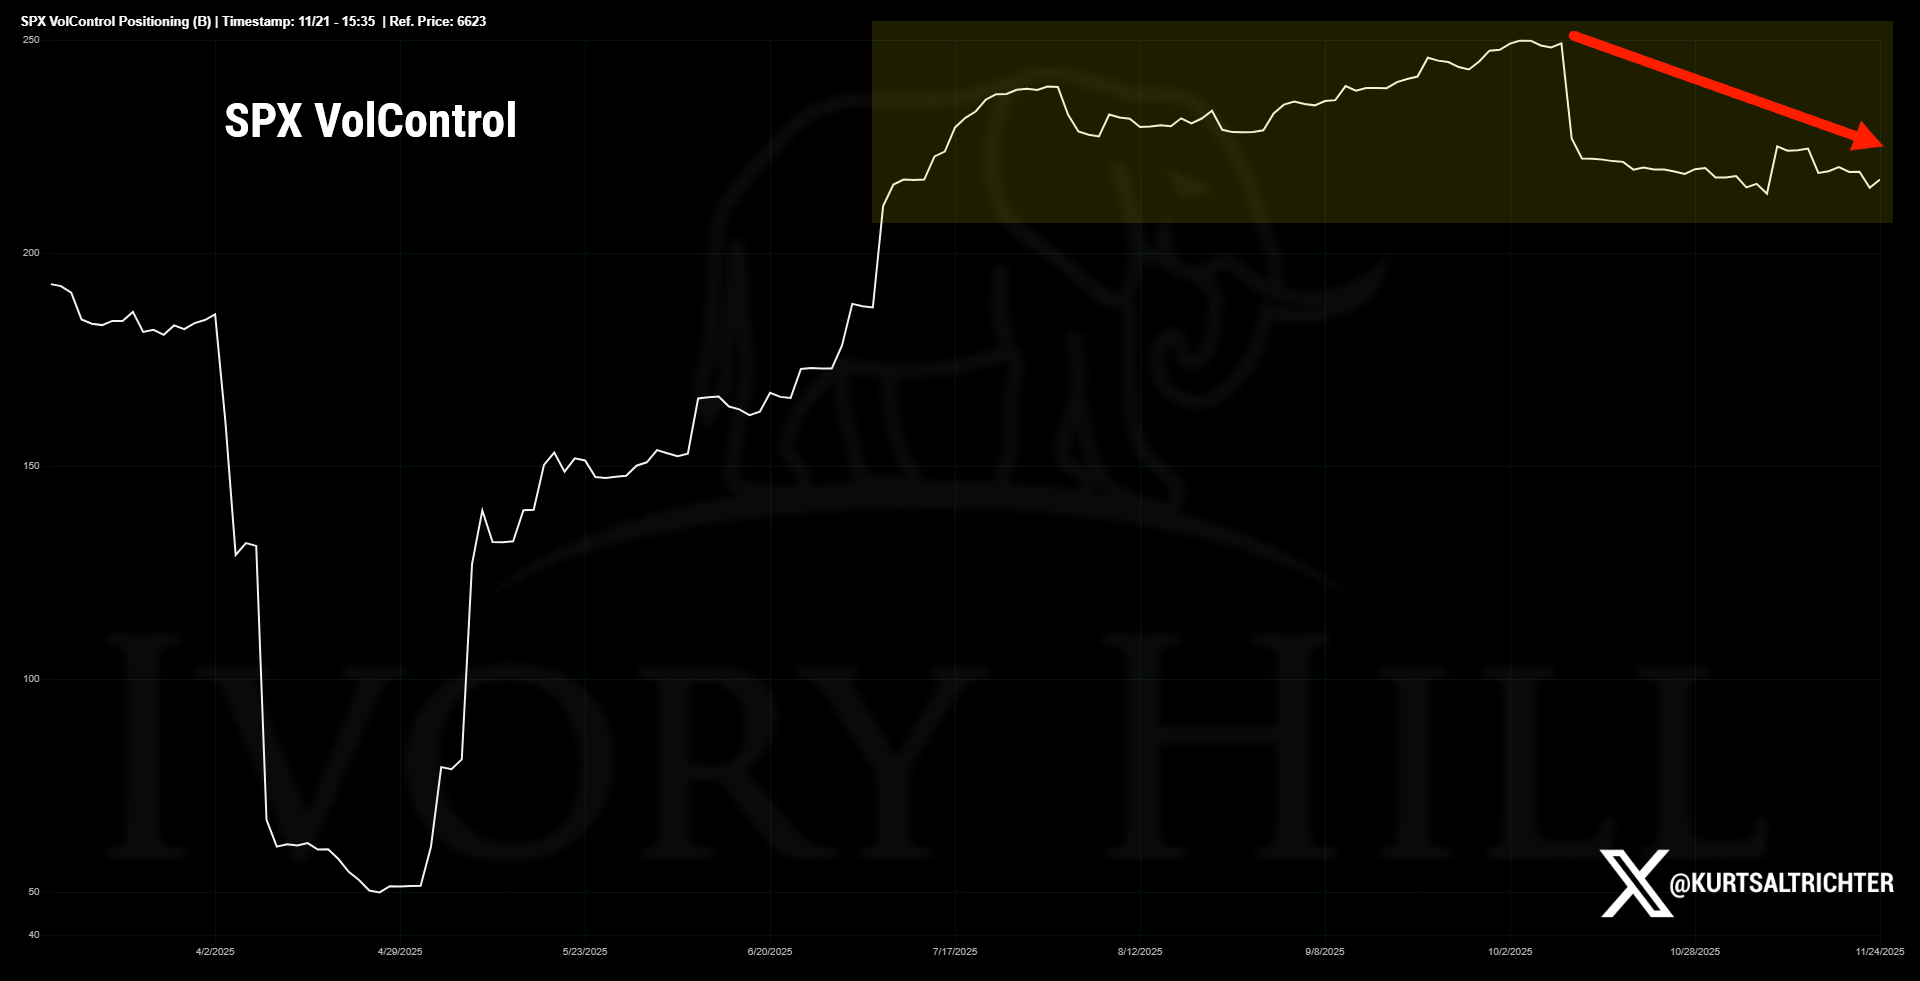
Both groups still provide some support, but far less than they did earlier in the quarter. When CTAs are trimming and vol control is stepping back, the tape becomes more dependent on discretionary flows and dealer hedging. With dealers now in negative gamma, that setup leans bearish. The flow signal moves from Neutral to Bearish. Remember, negative gamma doesn’t mean we'll automatically get a down market. It means volatility gets more ferocious on both the upside and the downside.
Breadth Signal
Breadth deteriorated for another week.
Roughly 53% of S&P 500 members now trade above their 200-day moving average, down from about 58% a couple of weeks ago. The weighted breadth signal printed negative readings across the board, reflecting persistent weakness under the surface.
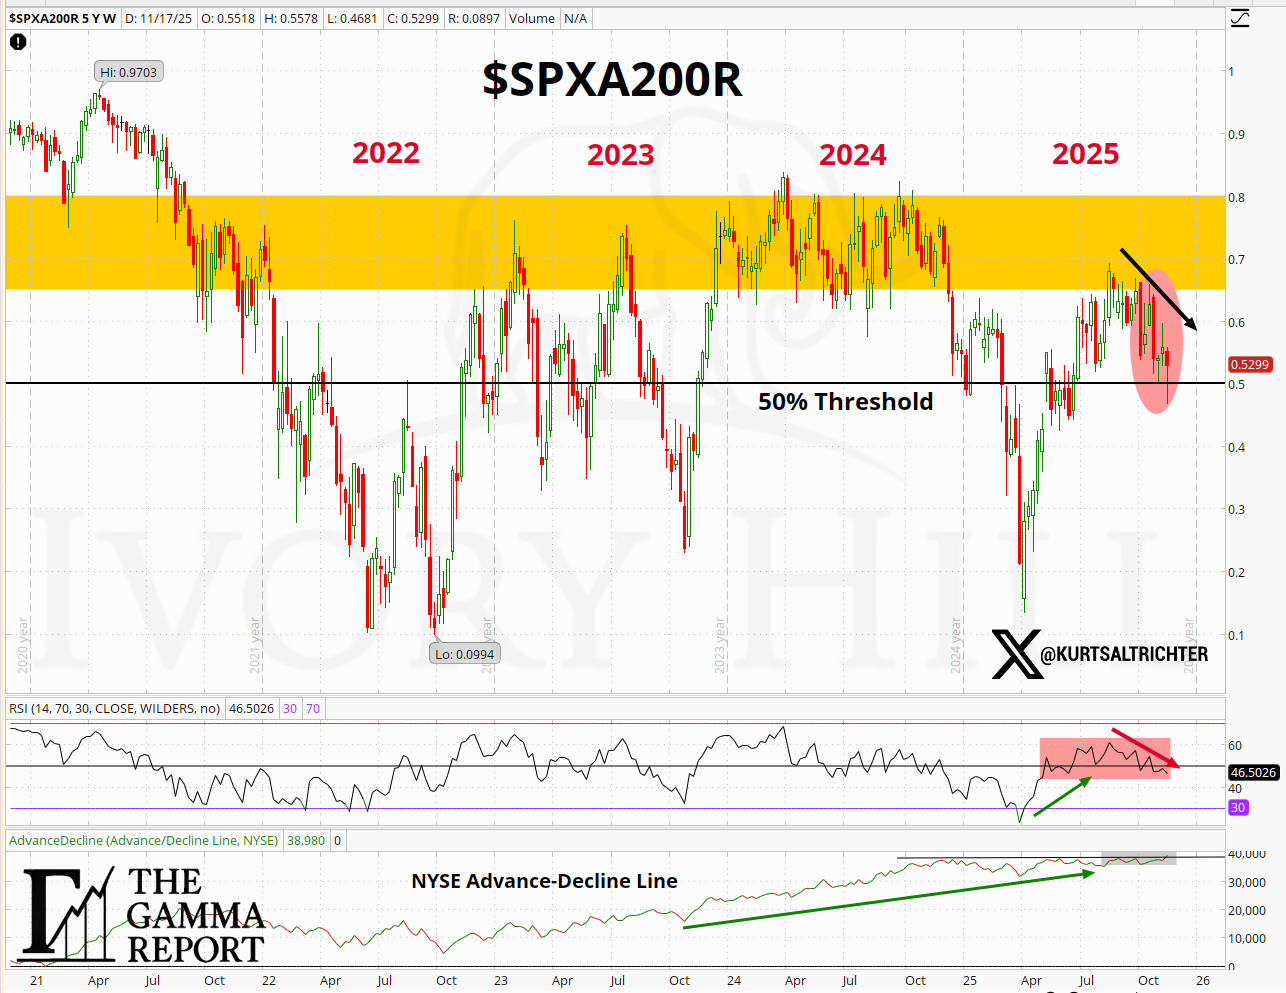
The SPXA200R gauge failed again in the same congestion zone that has capped advances since 2022. RSI for the breadth index rolled over from overbought and now sits in the mid-40s, while the NYSE advance-decline line is flattening inside a tight range. When the index hovers near new highs but fewer names participate, the market becomes top-heavy. That is the environment where negative gamma and rising realized vol matter more.
Weighted Composite & Regime
The weighted composite, which blends gamma, realized vol, flows, and breadth, shifted from Neutral to Bearish last week. The composite regime itself finished Neutral, but that label masks how much the underlying structure has weakened.
The daily regimes tell the story:
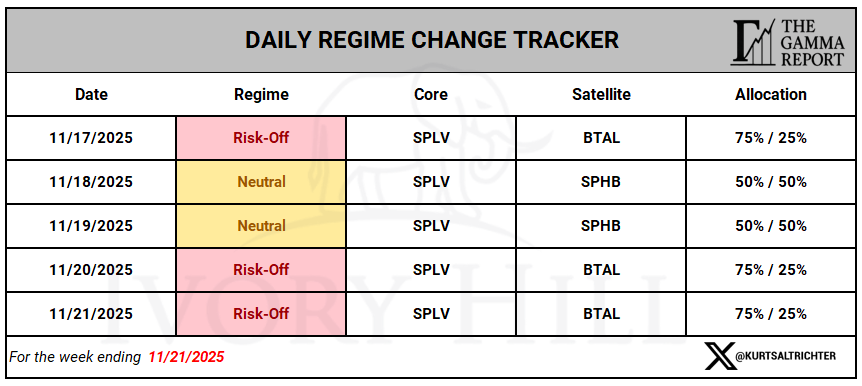
The regime shifted back to Risk Off by the end of the week, which aligns with the deepening negative gamma, rising realized volatility, and softer systematic support.
Weekly Performance
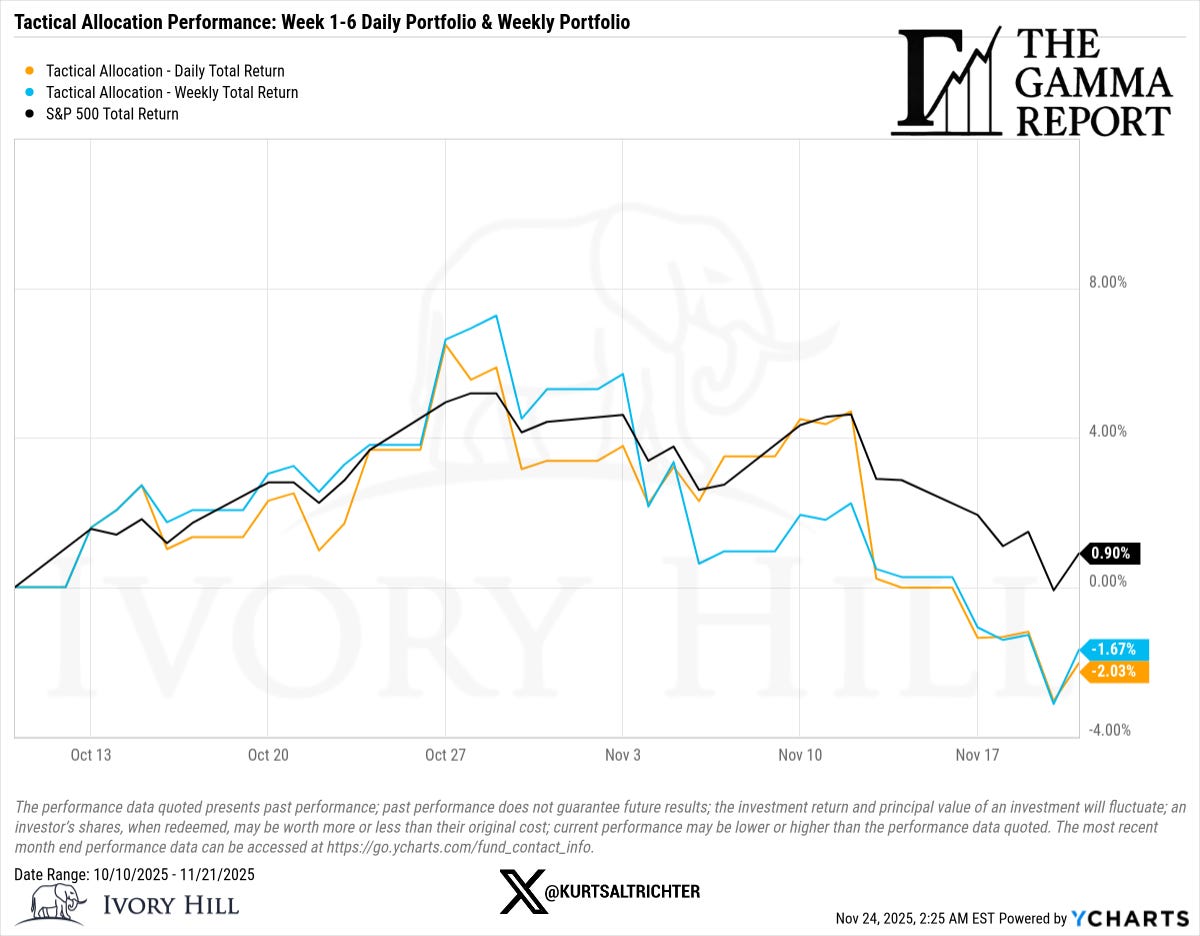
Since the start of the tactical allocation series on October 10, the S&P 500 is up about 0.90%. The weekly rebalanced tactical portfolio is down roughly 1.67%, while the daily version is down about 2.03%.
The gap last week came from the late week slide into Risk Off. The model moved into SPLV and BTAL as spot bounced off intraday lows. That is the cost of a rules-based process in a volatile environment. You will not catch every intraday swing, but you will keep risk aligned with the regime instead of trading off gut feel and headlines.
Bottom Line
Last week was not a crash. It was another step in a transition from a supportive structure to a fragile one.
Dealers dug deeper into negative gamma.
Realized volatility kept grinding higher.
Breadth weakened.
CTAs and vol control trimmed support.
Daily regimes slid back into Risk Off.
None of these signals alone is enough to make a directional call. Together, they tell you something important: the tape is fragile, and the next move will likely be driven by positioning rather than narrative.
And remember - The one fact pertaining to all conditions is that they will change.
Follow me on X for more updates.
Best regards,
-Kurt
Schedule a call with me by clicking HERE
Kurt S. Altrichter, CRPS®
Fiduciary Advisor | President
Disclosure
The Gamma Report is published by Ivory Hill, LLC. All opinions and views expressed in this report reflect our analysis as of the date of publication and are subject to change without notice. The information contained herein is for informational and educational purposes only and should not be considered specific investment advice or a recommendation to buy or sell any security.
The data, models, and tactical allocations discussed in this report are designed to illustrate market structure and positioning trends and may differ from portfolio decisions made by Ivory Hill, LLC or its affiliates. Investing involves risk, including the possible loss of principal. Past performance is not indicative of future results.
Ivory Hil, LLC, and its members, officers, directors, and employees expressly disclaim any and all liability for actions taken based on the information contained in this report.