

Announcement: Due to repeated requests for daily signals, I have started posting them for X subscribers. If you want the daily dashboard, tactical allocation updates, short and medium-term quant signals, investment ideas, and real-time positioning, you can subscribe to my X account.
Last week was the kind of week that reminds you why process beats prediction. The structure strengthened again. Gamma stayed positive. Realized volatility cooled. Systematic flows stopped bleeding and even started to stabilize. Breadth remained stuck. The composite score pushed into Bullish territory, yet the regime label stayed Neutral. That combination says the tape wants higher prices, but it will not reward reckless behavior.
The job does not change. Measure the regime, size the risk, and let the model remove the emotion.
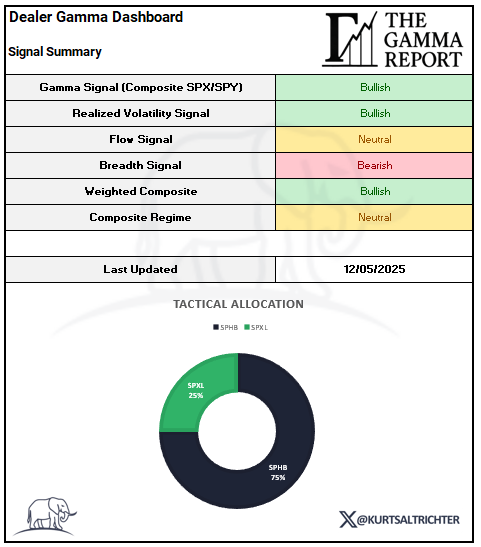
As of the close on 12/5/2025:
Gamma Signal: Bullish
Realized Volatility: Bullish
Flow Signal: Neutral
Breadth Signal: Bearish
Weighted Composite: Bullish
Composite Regime: Neutral
Weekly Allocation: SPHB 75% and SPXL 25%
Gamma Signal: Bullish
This is the biggest structural improvement in the market. SPX held above the gamma flip line near 6780 for the entire week. As long as the price stays above that level, dealers sit in positive gamma and suppress volatility. Pullbacks get bought. Upside gets suppressed. Volatility compresses. Liquidity improves.
You can see it clearly in the net gamma history. The cluster of positive readings that emerged after Thanksgiving is intact and widening. This is a critical difference from the negative gamma pocket that dominated October and early November. The tape is no longer unstable. It is balanced.
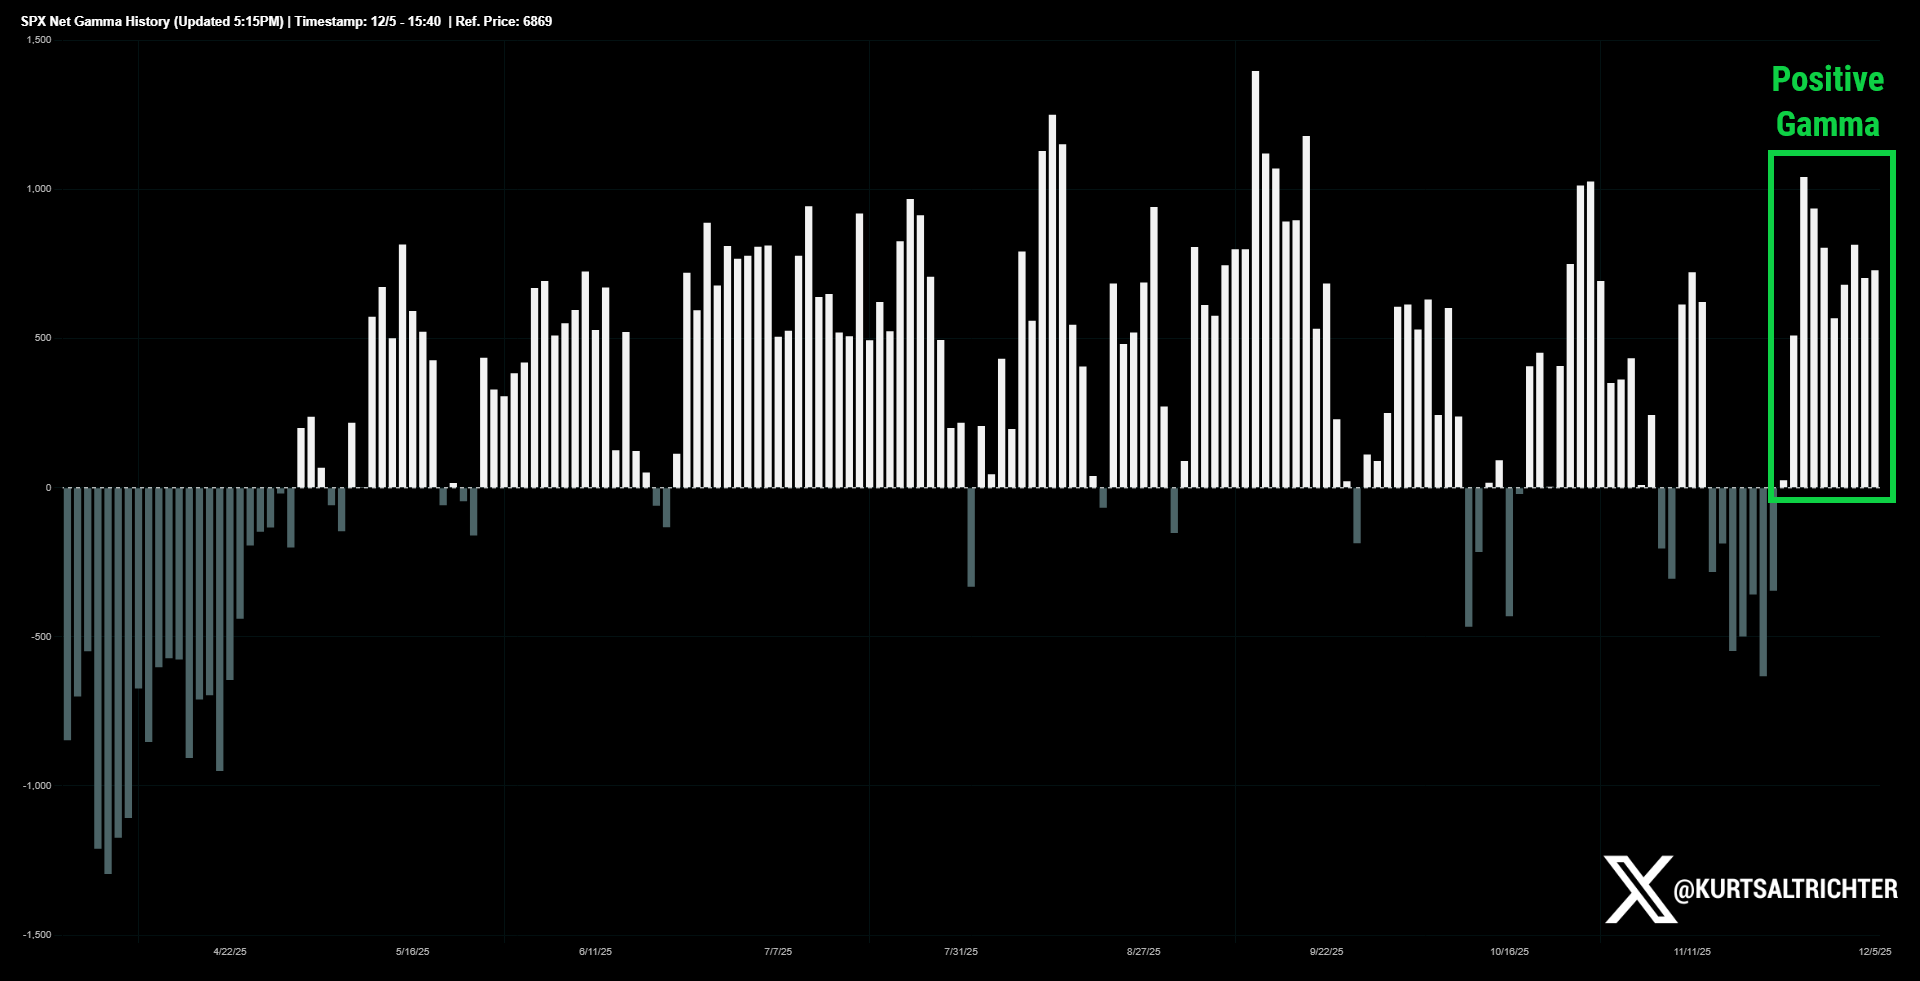
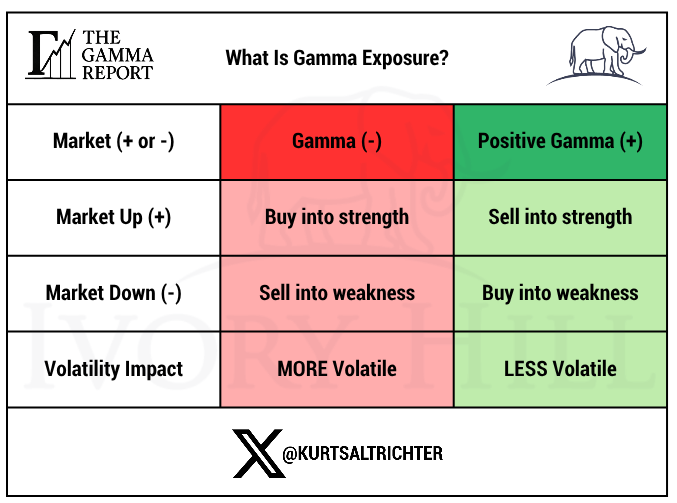
Remember, positive gamma does not guarantee upside. It means the volatility moves will be less aggressive. What it does is force sellers to work harder. Any real decline has to be driven by dealer demand. Last week, the tape respected that dynamic perfectly.
Realized Volatility Signal: Bullish
30-day realized volatility (RV) drifted down to about 13.8. 90-day sits near 12.1. The rate of change cooled for the first time since late October. That matters far more than the absolute level. The level does not matter; the RV’s direction is what matters because that is what triggers Vol Control buying and selling. Seeing short-dated RV (red line) drop below long-dated RV (blue line) would be bullish.
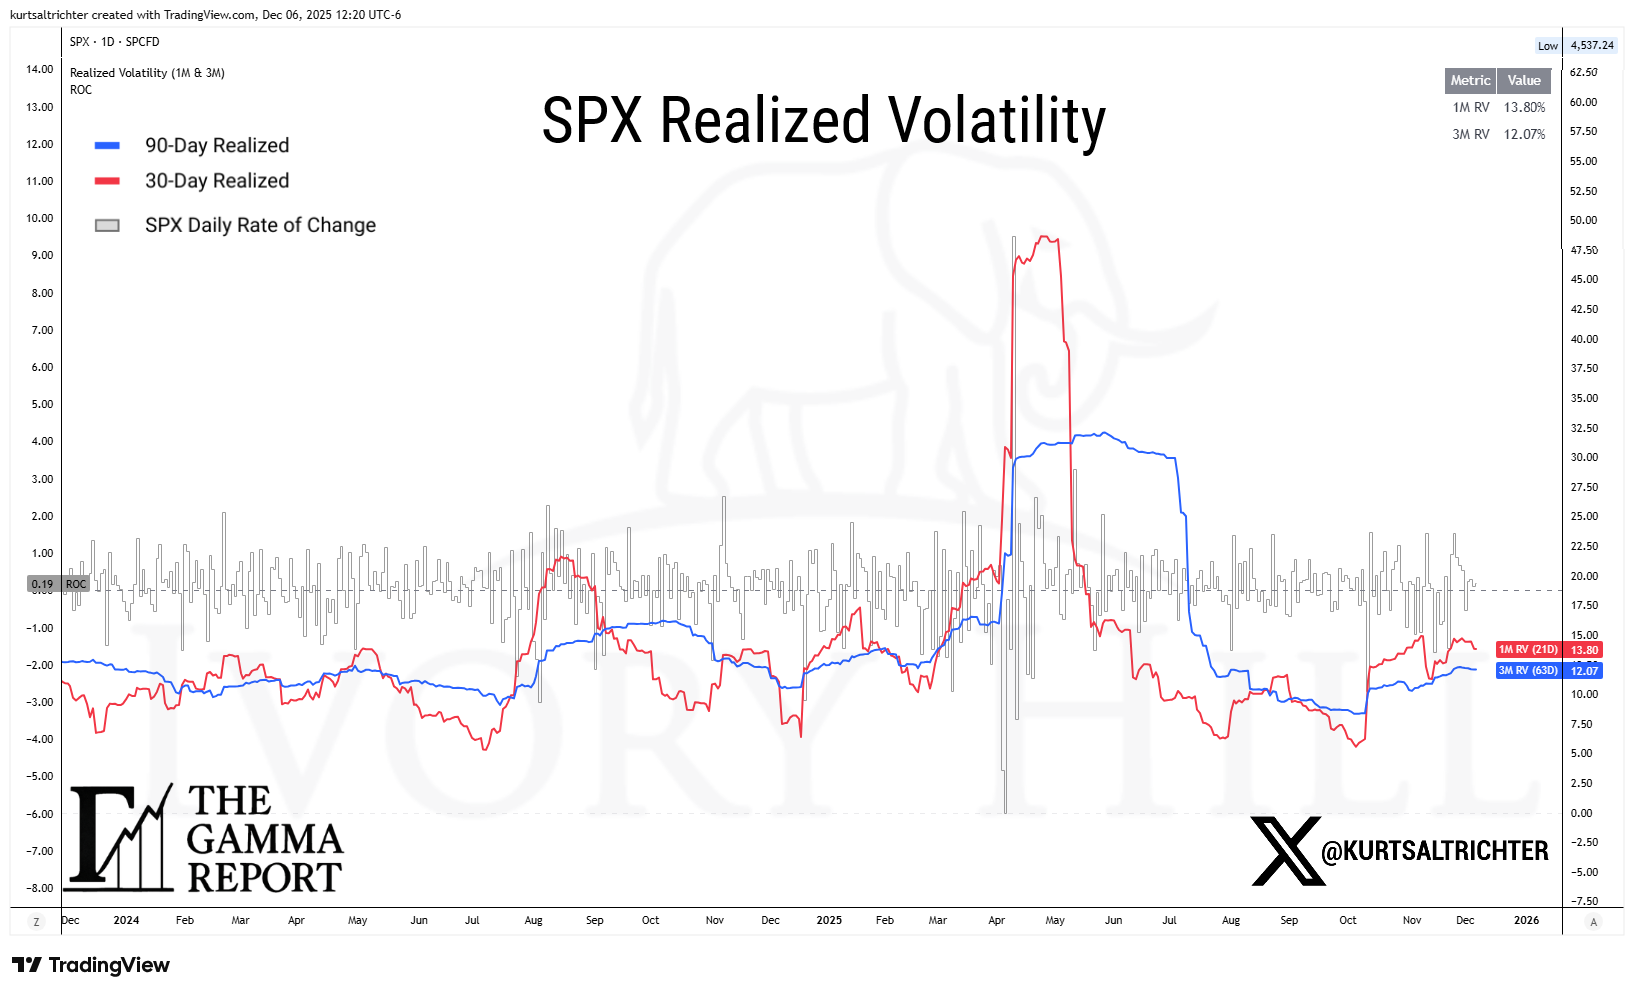
This is the type of vol setup that gives vol control funds room to start adding back exposure. And they have. Markets trade on the slope of volatility, not the headline number. When short-term vol stops rising, the tape becomes easier to own.
Flow Signal: Neutral
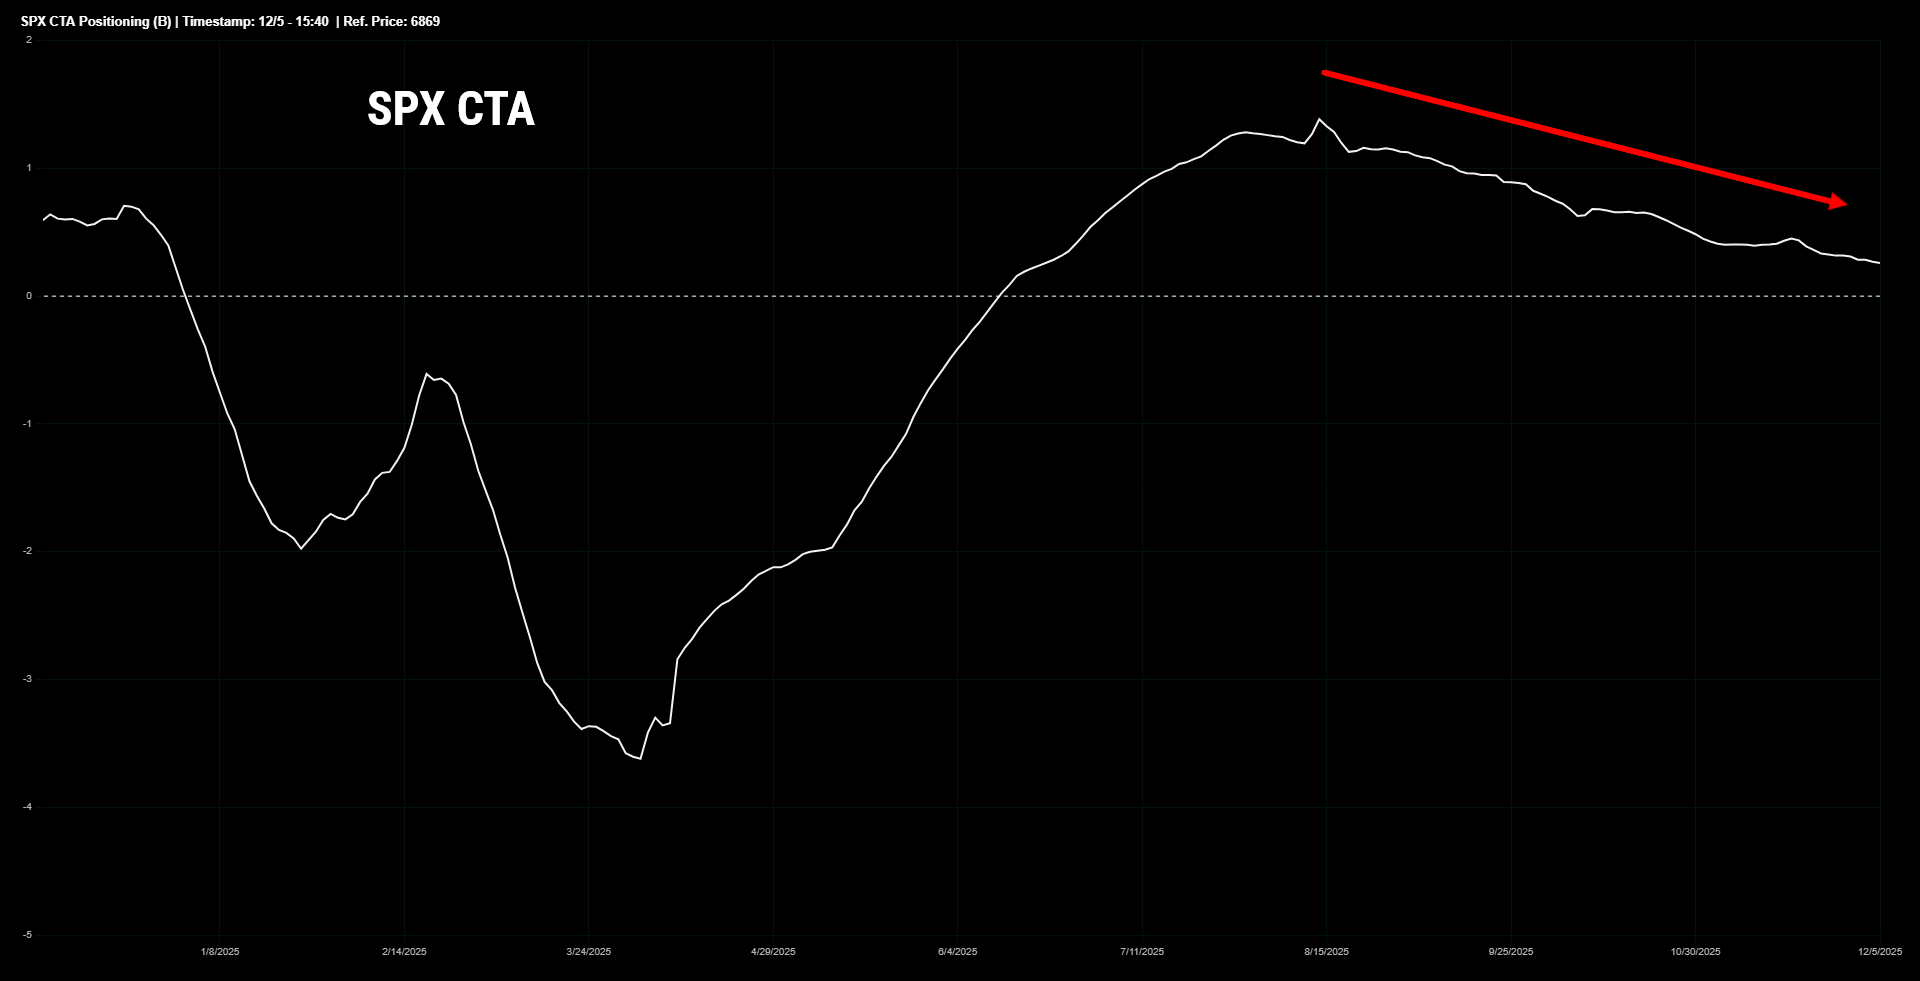
Systematic flows are not providing the aggressive tailwind we had earlier in the quarter, but they are no longer a headwind.
CTA exposure kept grinding lower, which is what happens when the trend matures. They are still long. They just are not the incremental buyer they were in August and September.
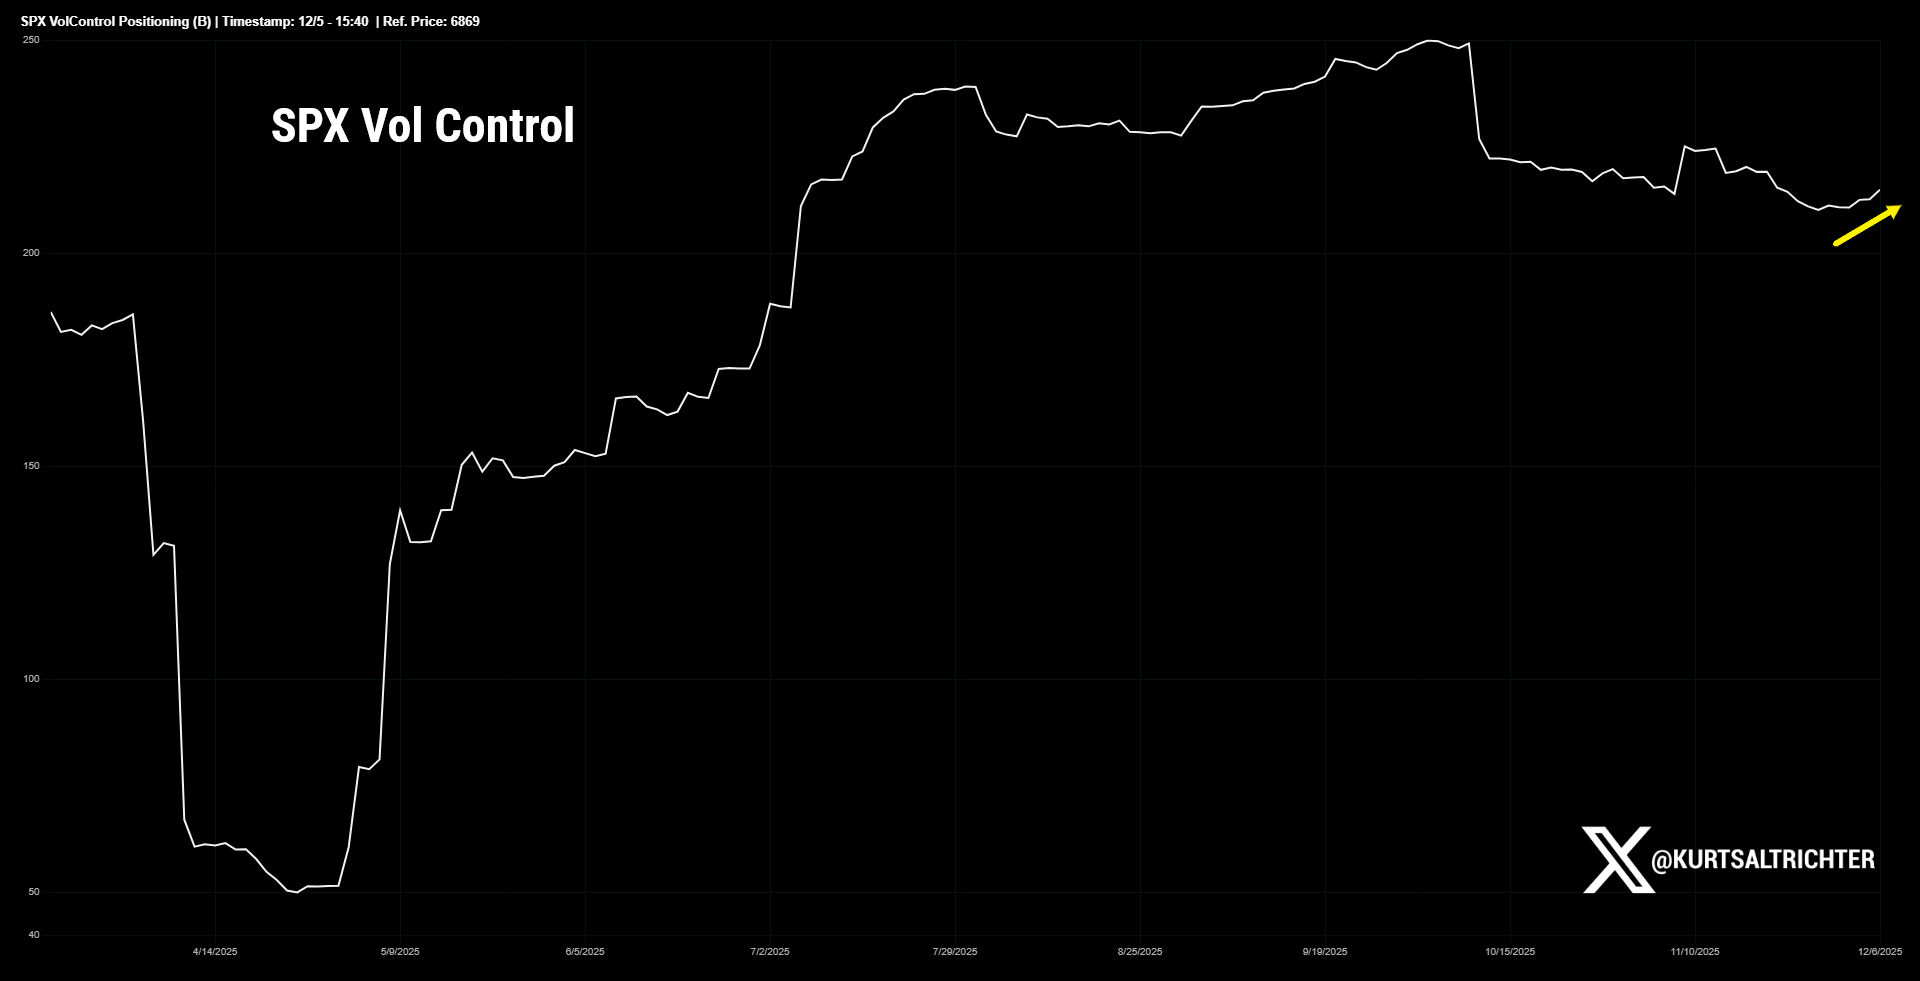
Vol control is the more interesting piece. After weeks of trimming as realized vol firmed, notional exposure stabilized and even turned higher on Friday. It is small, but it is the first uptick in a while. That is precisely what you expect when gamma stays positive and realized volatility cools.
If you have been following this report, you should now be able to point out the sequencing of events: Positive gamma leads to lower realized volatility, which triggers Vol Control buying, which can strengthen breadth and the overall trend, leading to CTA buying.
Neutral is the correct call here. CTAs are drifting lower. Vol control is curling higher. This mix removes pressure instead of adding it.
Breadth Signal: Bearish
Breadth remains the weakest part of the structure.
About 60% of S&P 500 names are above their 200-day moving average. Better than the low 50s we saw in mid-November, but still stuck under the same yellow congestion zone that stopped advances in 2022, 2023, and 2024.
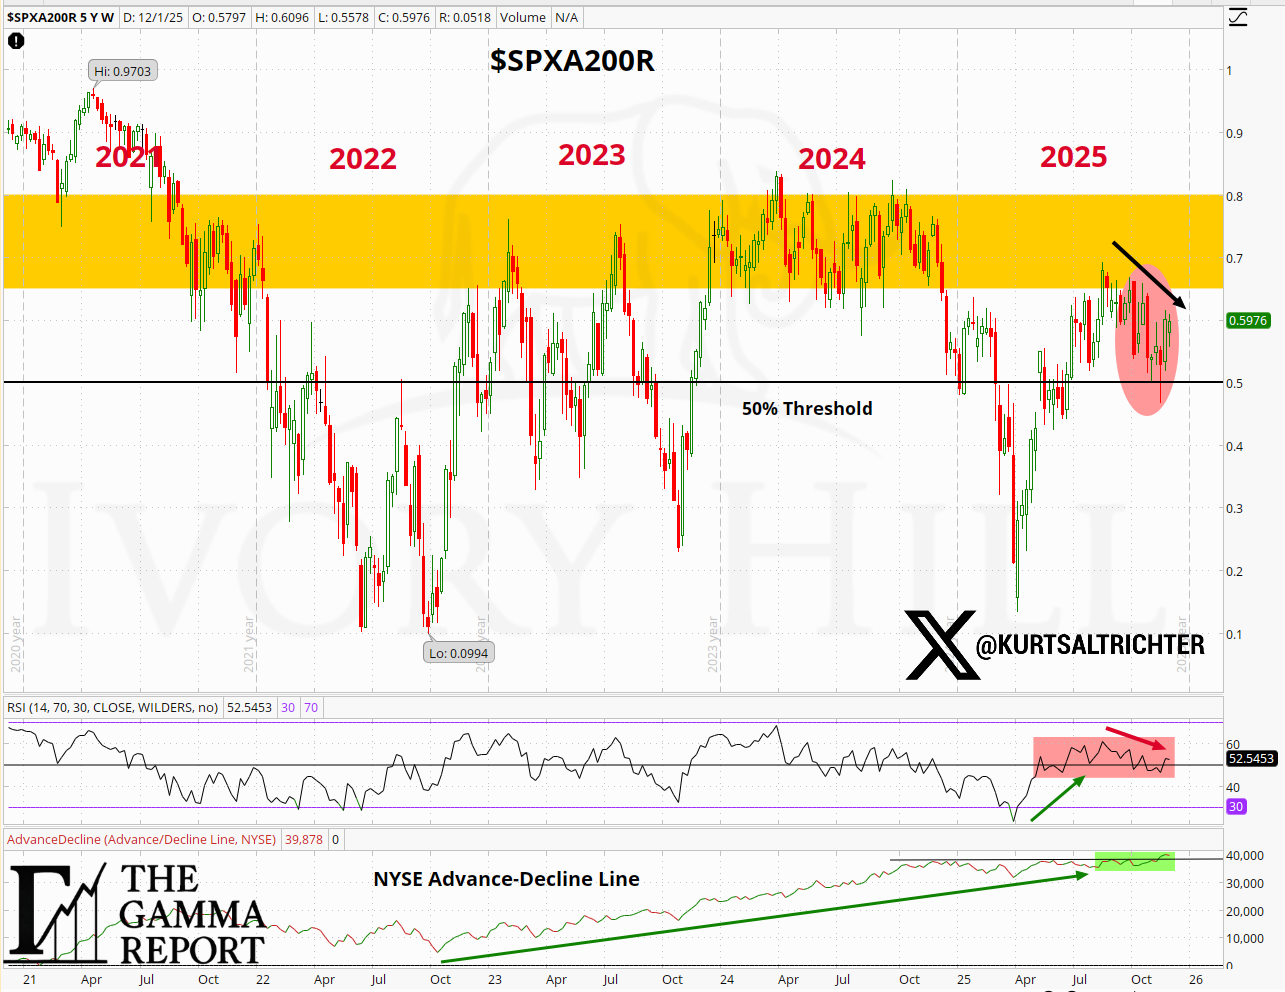
The RSI for breadth rolled over. The NYSE advance-decline line flattened. Price pushed toward the top of the range while participation cooled. This is what a top-heavy market looks like. Remember, this is literally just one variable in the model.
Until breadth breaks out of this multi-year congestion zone, the model has no choice but to keep the signal Bearish.
Weighted Composite and Regime
The weighted composite finished the week firmly Bullish.
Both the daily and weekly models ended the week in Risk On, indicating the improvement in structure was broad enough and consistent enough to put both timeframes in the same posture. When the daily and weekly models align, the message is simple. The environment supports taking risks as long as you size it correctly and respect the ranges.
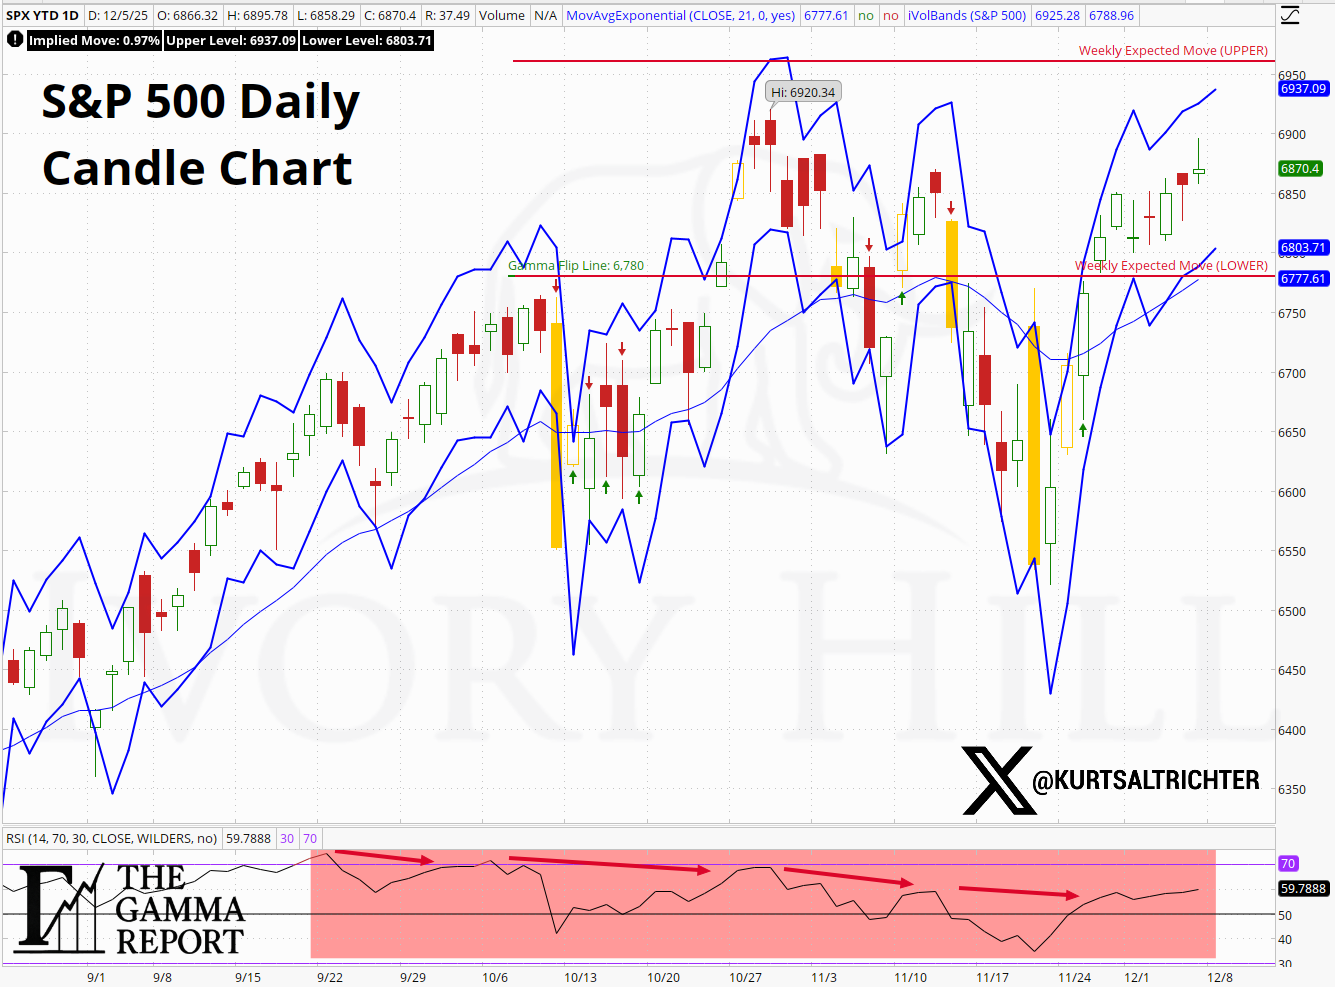
The Daily Candle Chart shows the index trading above the gamma flip line at 6780, reclaiming the 21-day moving average, and pressing toward the upper middle of the weekly expected move. There is nothing fragile about this setup. Positive gamma gives the market a cushion. Cooling realized vol reinforces that cushion. Flows are no longer a drag.
The regime being Risk-On is not an invitation to chase price. It is a signal that the structure supports the trend and that dips are more likely to be bought than sold. The model is not guessing. It is reacting to an environment that is finally leaning in the same direction across most major components.
How to Use the Weekly Expected Move
Most investors treat expected moves as trivia. This is a mistake. Expected moves define the playing field. They tell you where the price can travel without breaking the volatility regime.
For the upcoming week, the expected move spans:
Upper band: near 6960
Lower band: near 6780
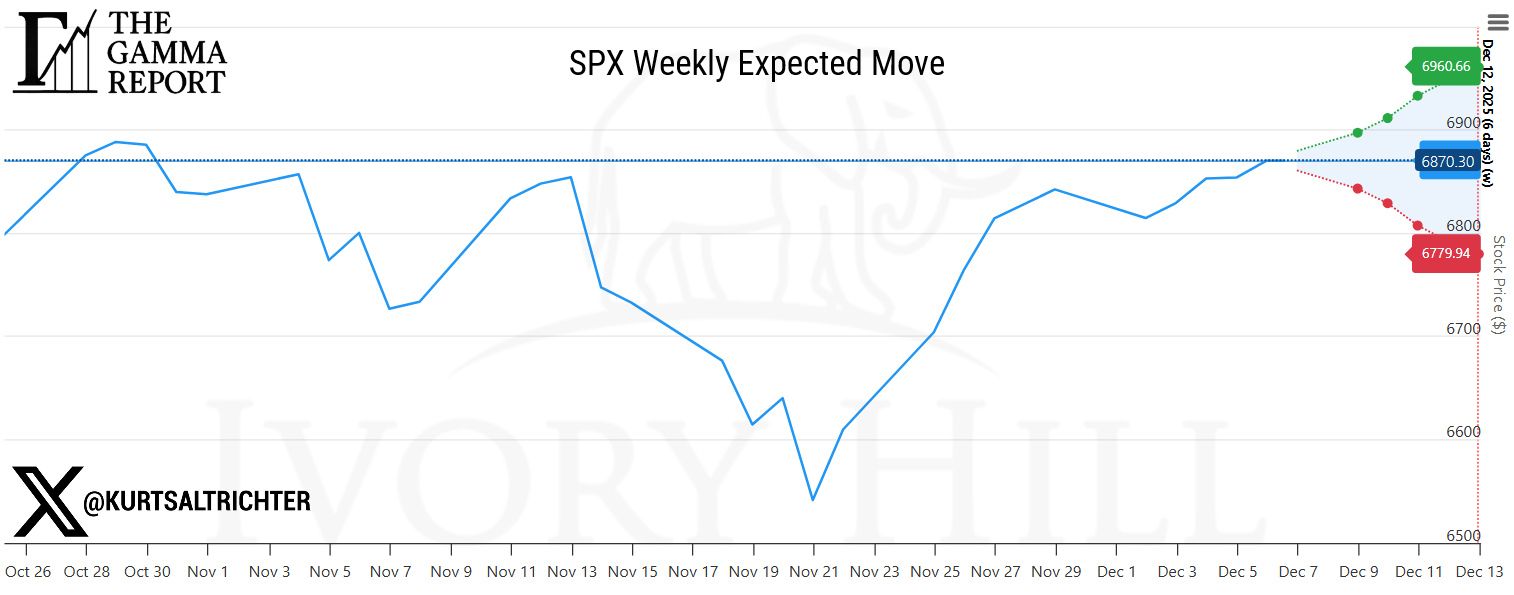
That 6780 level is essential. It is nearly identical to the gamma flip line. When a key level from dealer positioning lines up with the lower boundary of the expected move, you have a structural floor. If price trades down into that area, you expect dealer hedging to stabilize the tape and push realized vol lower. That is precisely what a positive gamma regime does.
The upper band around 6960 defines what the market can do on the upside without breaking the volatility expectations. If price pushes through the upper band with expanding realized vol, that would signal a shift toward overshoot dynamics. If price approaches the upper band with declining vol, it tells you the move is being absorbed rather than stressed.
Expected moves are not predictions. It is a volatility fence. The closer price gets to either boundary, the more you should expect hedging flows to matter. Inside those boundaries, the tape behaves normally. Outside those boundaries, the structure changes, and you need to respect that.
The Daily Candle Chart and the Weekly Expected Move Chart together give you a graphical roadmap. SPX is trading toward the center of the range, above the flip line, with positive gamma reinforcing stability. That is why both models are Risk On. That is why the structure supports staying invested. And that is why we will monitor the expected move lines every week. They tell you where the game is being played.
Daily Regime Change Tracker
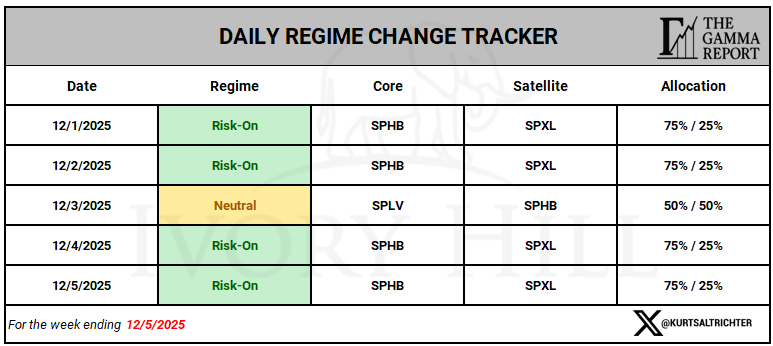
Here is how the structure scored in real time:
Monday 12/1: Risk-On
Tuesday 12/2: Risk-On
Wednesday 12/3: Neutral
Thursday 12/4: Risk-On
Friday 12/5: Risk-On
Wednesday’s move into Neutral was brief and reflected a midweek sag in the composite score before strength returned. The model tightened exposure, then expanded it again as vol cooled and gamma stayed supportive.
This is how a rules-based risk process behaves. No guessing. Just reacting to the evolving structure.
Tactical Allocation Performance
Since the tactical allocation series began on October 10:
S&P 500: about 5.05%
Daily Tactical Sleeve: about 2.83%
Weekly Tactical Sleeve: about 0.35%
Both sleeves lag the index. That is normal in a tape that ripped higher while the model respected negative gamma and firming volatility in October and early November.
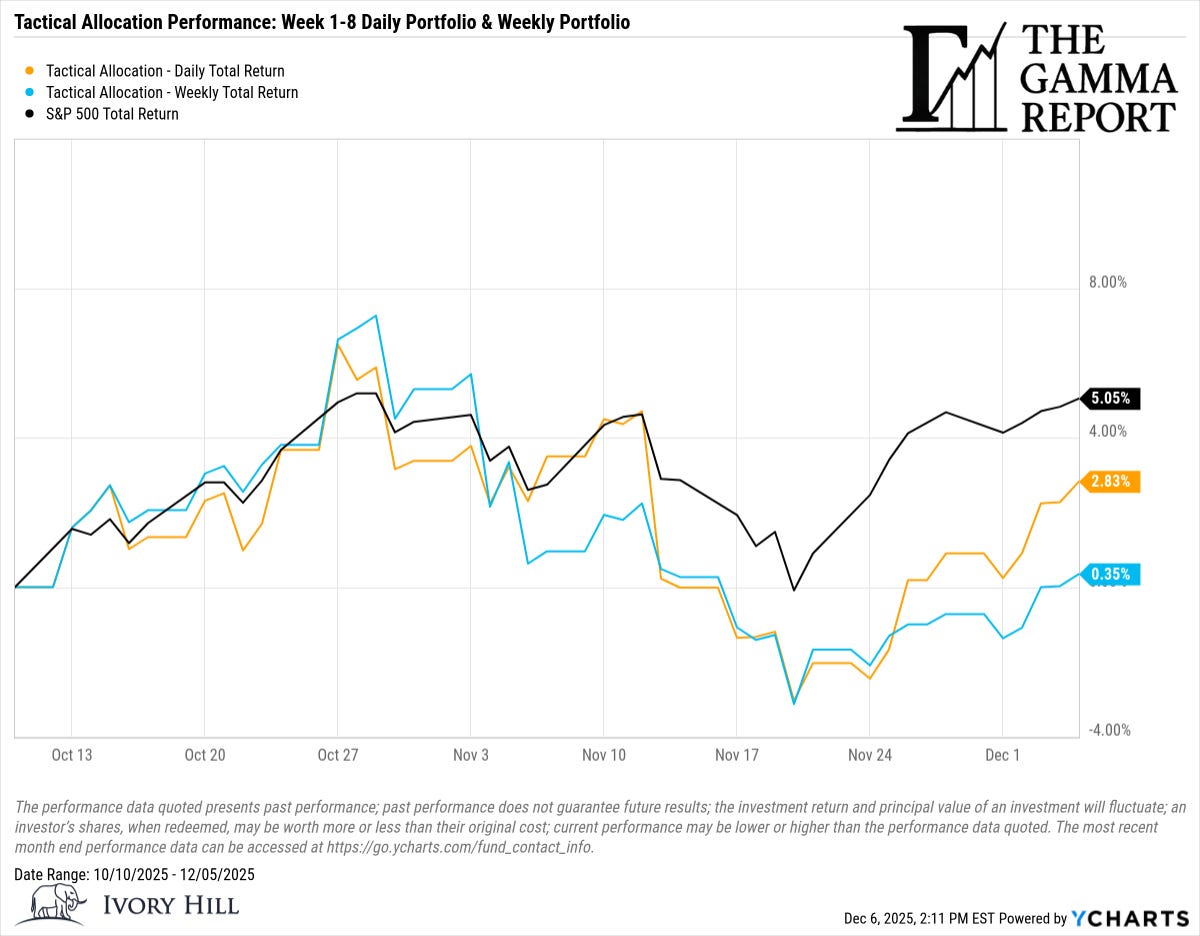
The gap tightened once the market structure improved. In last week’s report, the Daily model lagged the SPX by almost 4%, and is now trailing by 2.22%. Not bad, considering the market was only up 0.37% for the week. Gamma flipped positive. Vol cooled. Flows stabilized. The model leaned into Risk-On. The daily sleeve moves first. The weekly sleeve follows with less noise and fewer trades.
Neither sleeve is designed to beat the S&P 500 in a runaway rally, but it could in the right environment. The goal is simple. Stay aligned with the regime, avoid large drawdowns, and compound over full cycles.
If you have been following this report, and you quickly scroll past everything and go straight to the performance section, this report will not help you at all. In fact, I would consider this the least important part of this analysis. This report is for traders who respect process, who understand that the left side of the equal sign determines the right, not the other way around.
Bottom Line
The structure improved again and continues to move away from the fragile setup we dealt with in October and November.
Dealers remain deep in positive gamma
Realized volatility continues to cool
Vol control stopped cutting and started buying
CTA flows are steady, but no longer a headwind
Breadth is still capped, but off the lows
The composite score turned Bullish
Both tactical models shifted into Risk On
This is a market that wants higher prices. It is not a market that rewards complacency. Positive gamma gives you stability, not immunity. The expected move gives you your risk boundaries.
Respect both.
Feel free to use me as a sounding board.
And remember - The one fact pertaining to all conditions is that they will change.
Follow me on X for more updates.
Best regards,
Schedule a call with me by clicking HERE
Kurt S. Altrichter, CRPS®
Fiduciary Advisor | President
Disclosure
The Gamma Report is published by Ivory Hill, LLC. All opinions and views expressed in this report reflect our analysis as of the date of publication and are subject to change without notice. The information contained herein is for informational and educational purposes only and should not be considered specific investment advice or a recommendation to buy or sell any security.
The data, models, and tactical allocations discussed in this report are designed to illustrate market structure and positioning trends and may differ from portfolio decisions made by Ivory Hill, LLC or its affiliates. Investing involves risk, including the possible loss of principal. Past performance is not indicative of future results.
Ivory Hil, LLC, and its members, officers, directors, and employees expressly disclaim any and all liability for actions taken based on the information contained in this report.