

The S&P 500 is still deep in negative gamma, closing Friday at 6,369. The flip line is at 6,678. That is 309 points between here and a market that starts behaving better. The “gamma hole” is getting deeper.
What the Market Is Pricing This Week
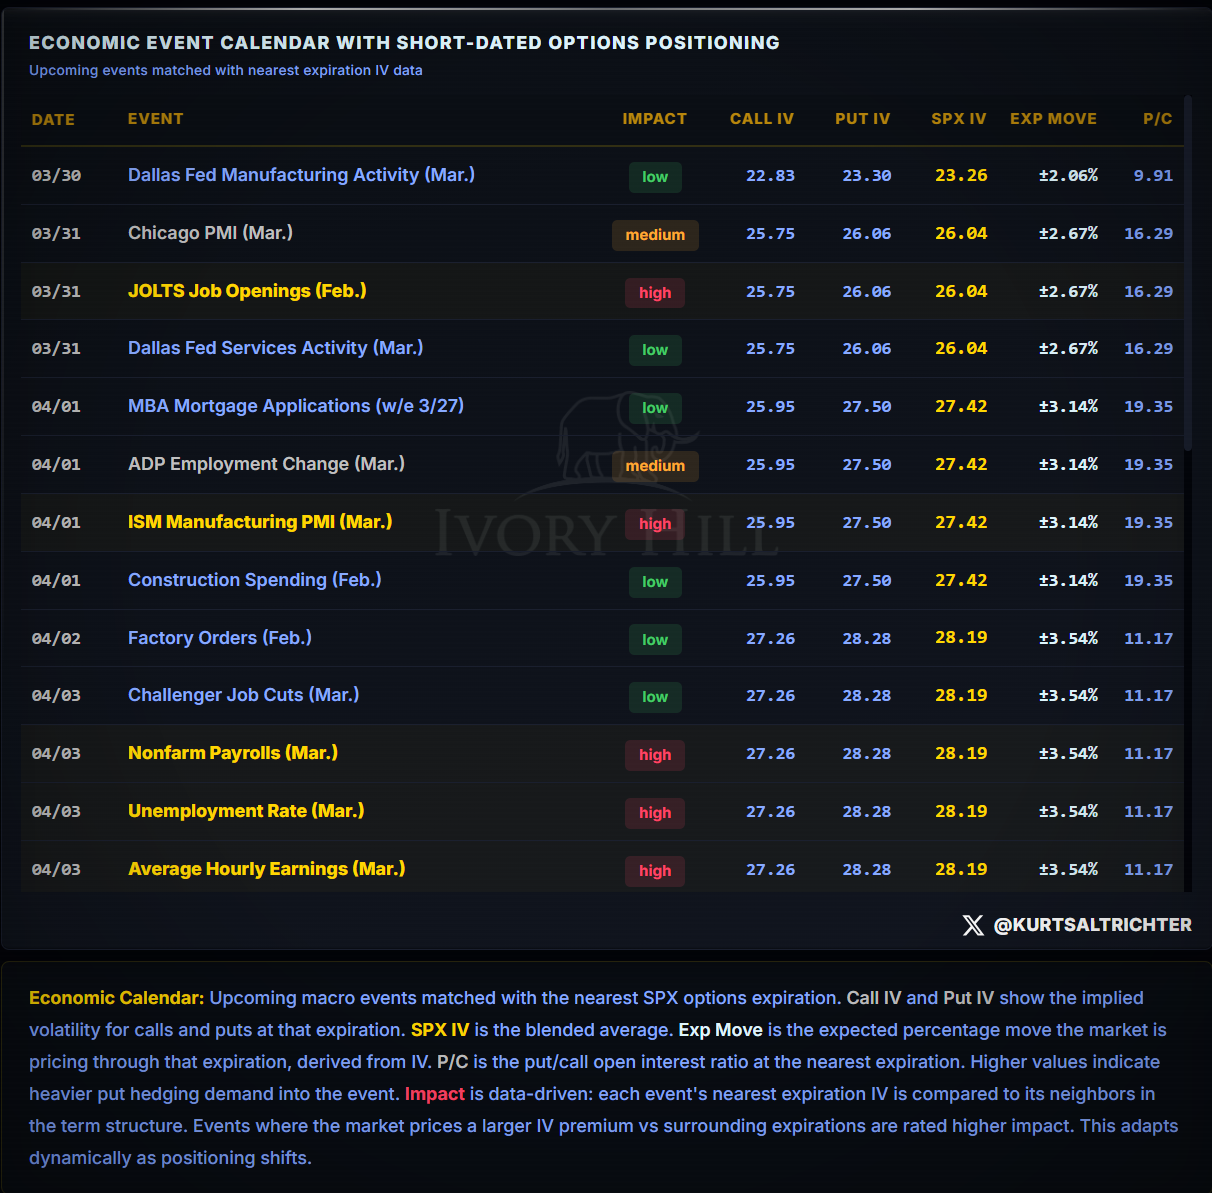
JOLTS Tuesday. Every month, the government counts how many job openings exist across the entire U.S. economy. Expectations are for around 7.6 million open positions. Why this report matters: When businesses post jobs, they believe the future will be good enough to continue growing their businesses. When those postings start disappearing, the chain reaction starts. Fewer jobs means fewer paychecks. Fewer paychecks means less money spent at restaurants, bars, car dealerships, and home improvement stores. Less spending means weaker business revenues. Weaker revenues means weaker corporate earnings. Weaker earnings means lower stock prices. A soft JOLTS number is not just a data point. It can be an early warning that the economic engine is cooling. In negative gamma, that kind of print does not get absorbed quietly. It gets amplified hard in both directions.
Iran Is One Problem. This Market Has Three.

The Ivory Hill RiskSIGNAL remains red (sell), and we are still sitting 40-51% short-term T-bills and will likely sell more equities this week if conditions continue to deteriorate.
ISM Manufacturing Wednesday. Every month, purchasing managers at American factories get asked one simple question: Is business getting better or getting worse right now? These are the people who are actually placing large orders, managing large inventories, and deciding whether to ramp up or slow down their spending. We are talking about the purchasing manager at a mid-size auto parts manufacturer who controls $50 to $100 million in annual spending, or the equivalent at a Caterpillar or 3M where that number runs into the billions. When they say things are getting worse, they are already slowing down orders, stretching out delivery timelines, and telling suppliers to hold shipments. That is real economic activity stopping in real time. And when that happens, factories produce less, order fewer raw materials, and start cutting worker hours or headcount. That feeds directly back into the jobs market, corporate profits, and eventually your 401k balance. Expectations are for a reading around 49.5, which means the people running American factories still think things are getting worse. The options market is pricing a bigger move around ISM than JOLTS. Wednesday has more potential to move prices than Tuesday.
Payrolls Friday. This is the one everyone watches. The government releases three numbers at once: how many jobs were added, what unemployment looks like, and whether wages are rising. Expectations are for around 140,000 jobs added, with unemployment holding at 4.1%. If job growth disappoints, it confirms what JOLTS and ISM were already warning about. The economy is slowing. But if wages come in hot at the same time, the Fed is stuck. Rising wages don’t help when inflation is rising, because they put more pressure on the Fed, which won’t be able to cut rates to help a slowing economy, even if it wanted to. A slowing economy with no Fed relief on the way is the scenario the market fears most right now. The biggest expected move of the week, but we won’t see this reaction until Monday because the market is closed on Friday.
Dealer Gamma and Market Structure
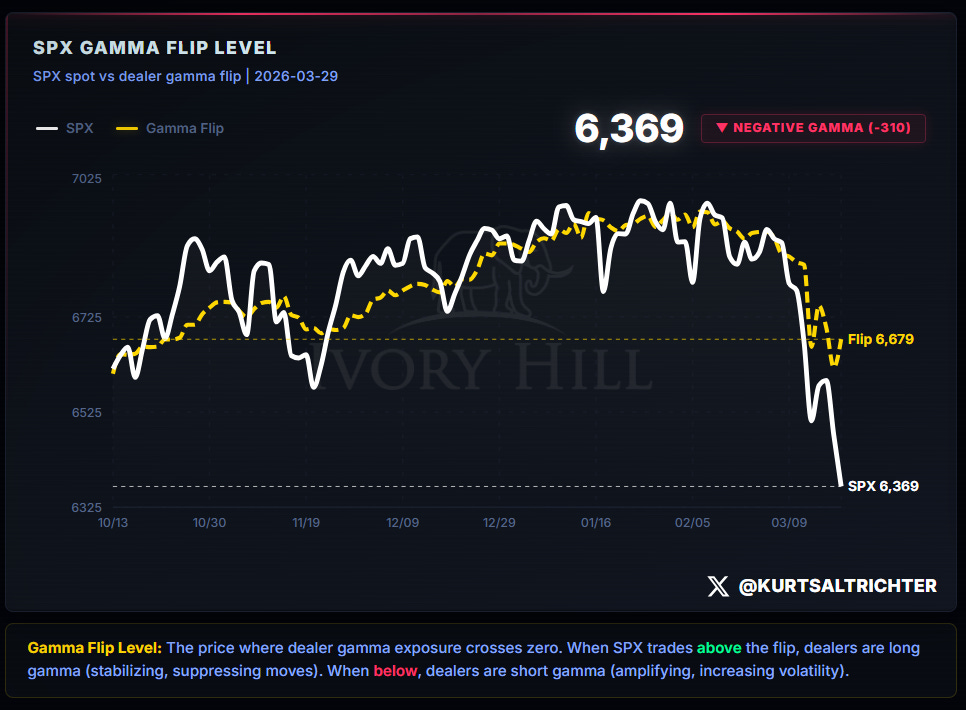
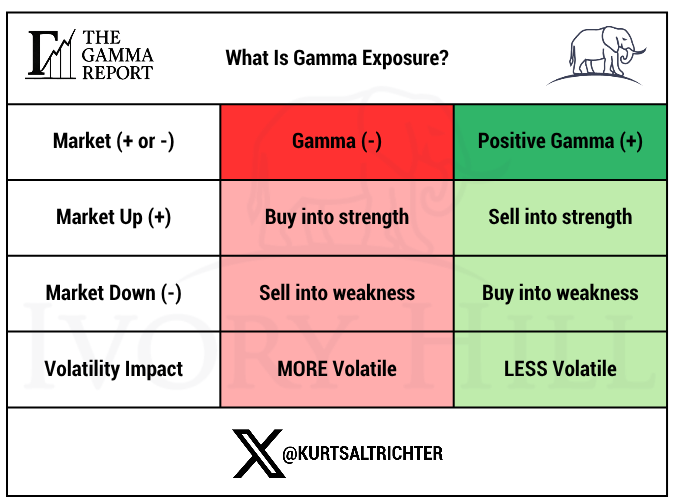
The options market has a specific price level where dealer behavior flips. Above that level, dealers naturally buy when the market dips and sell when it rallies, which keeps things calm and contained. Below it, they do the opposite. They sell when the market drops and buy when it bounces. That means every move gets bigger than it otherwise would be. Right now, we are below that level and have been for weeks. Dealers are not stabilizing this market. They are amplifying it.
The amount of negative positioning in the options market right now is the largest it has been in months.
SPX Live Price and Key Gamma Levels
Key levels to start the week:
Gamma Flip: 6,679
Weekly Expected Move upper: 6,611
Weekly Expected Move lower: 6,127
Monday Expected Move upper: 6,490
Monday Expected Move lower: 6,248
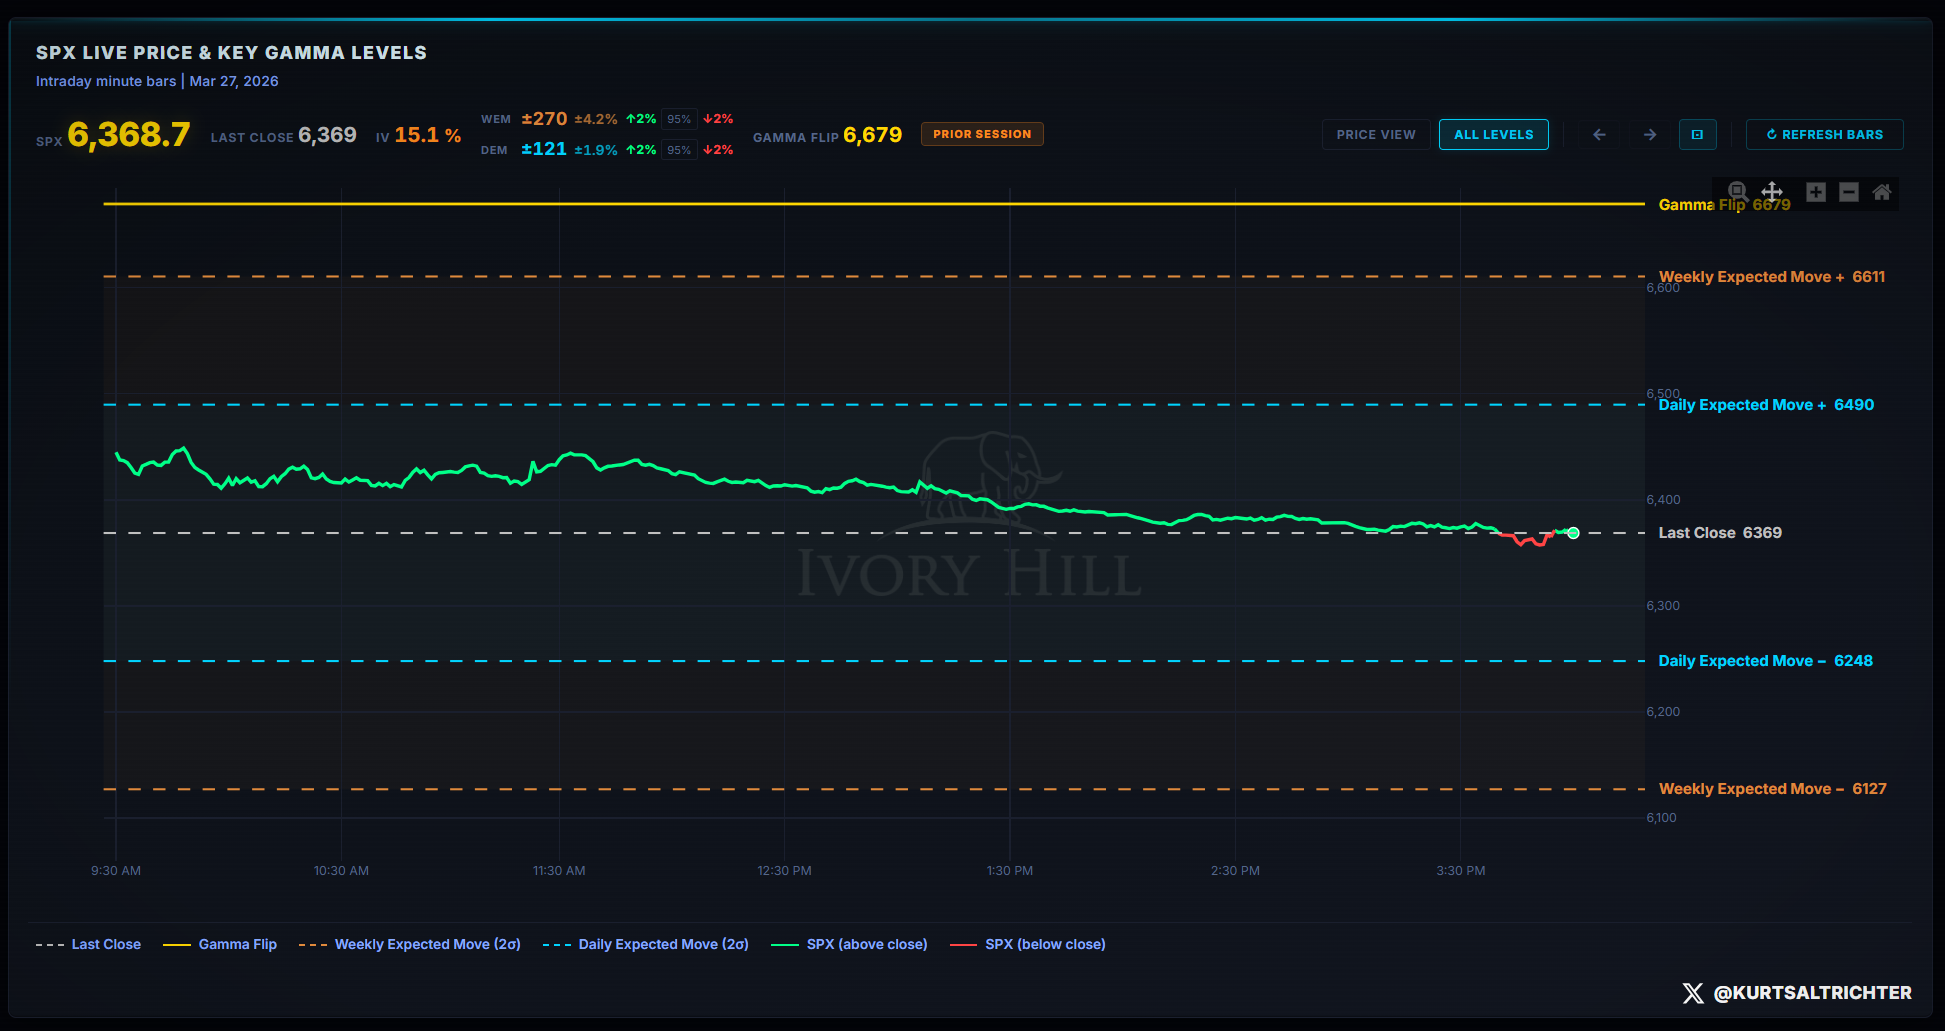
Notice that both the daily (green lines) and weekly (orange lines) expected moves sit below the flip line (yellow line). The options market is telling you it does not expect the S&P 500 to reclaim that level this week. Until it does, this is a grinding, low-conviction tape that chops in both directions.
Realized Volatility
1-month RV: 14.69. 3-month RV: 12.92. HIGH-VOL REGIME.
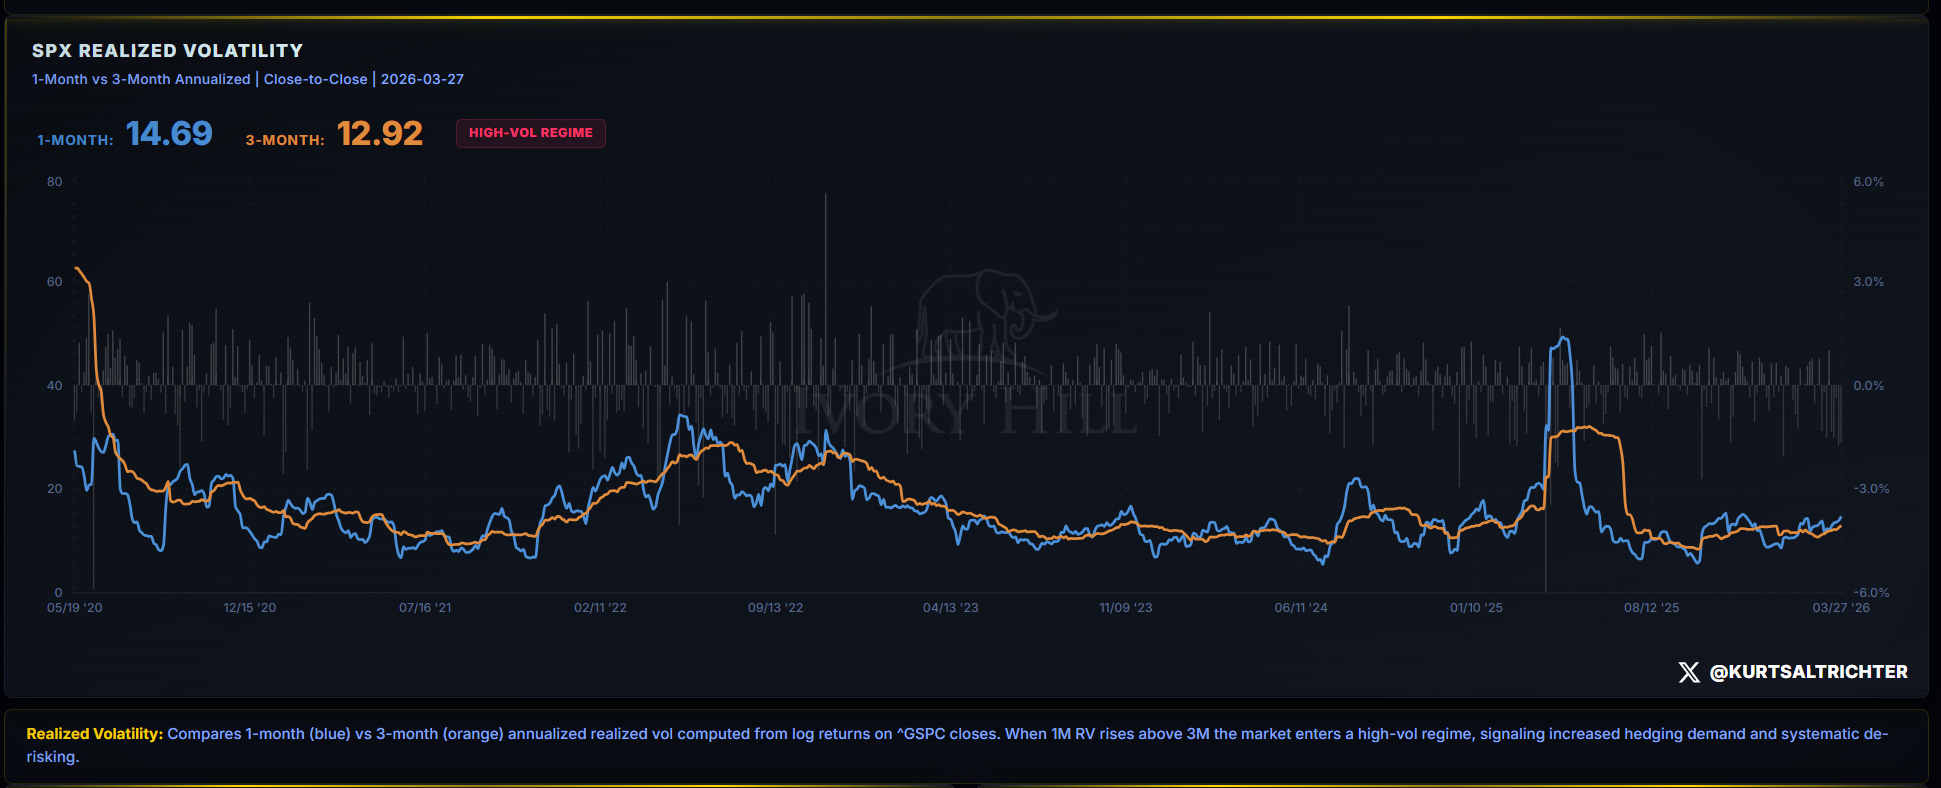
Short-term volatility (blue line) is running hotter than long-term volatility (orange line). That is important because a specific group of large institutional funds, called vol-control funds, is required by their own rules to automatically sell their stock holdings when short-term volatility exceeds long-term volatility. They are not making a judgment call on the economy or earnings. They are following a computer program. And right now that formula is telling them to sell. Until short-term volatility cools back down below the long-term reading and stays there, those funds keep reducing exposure. That is a persistent mechanical headwind for this market.
The RV signal is Neutral by definition of the model. The direction it is moving is not.
Flows
CTA trend: Falling. Vol-control trend: Falling. Flow Signal: Bearish.
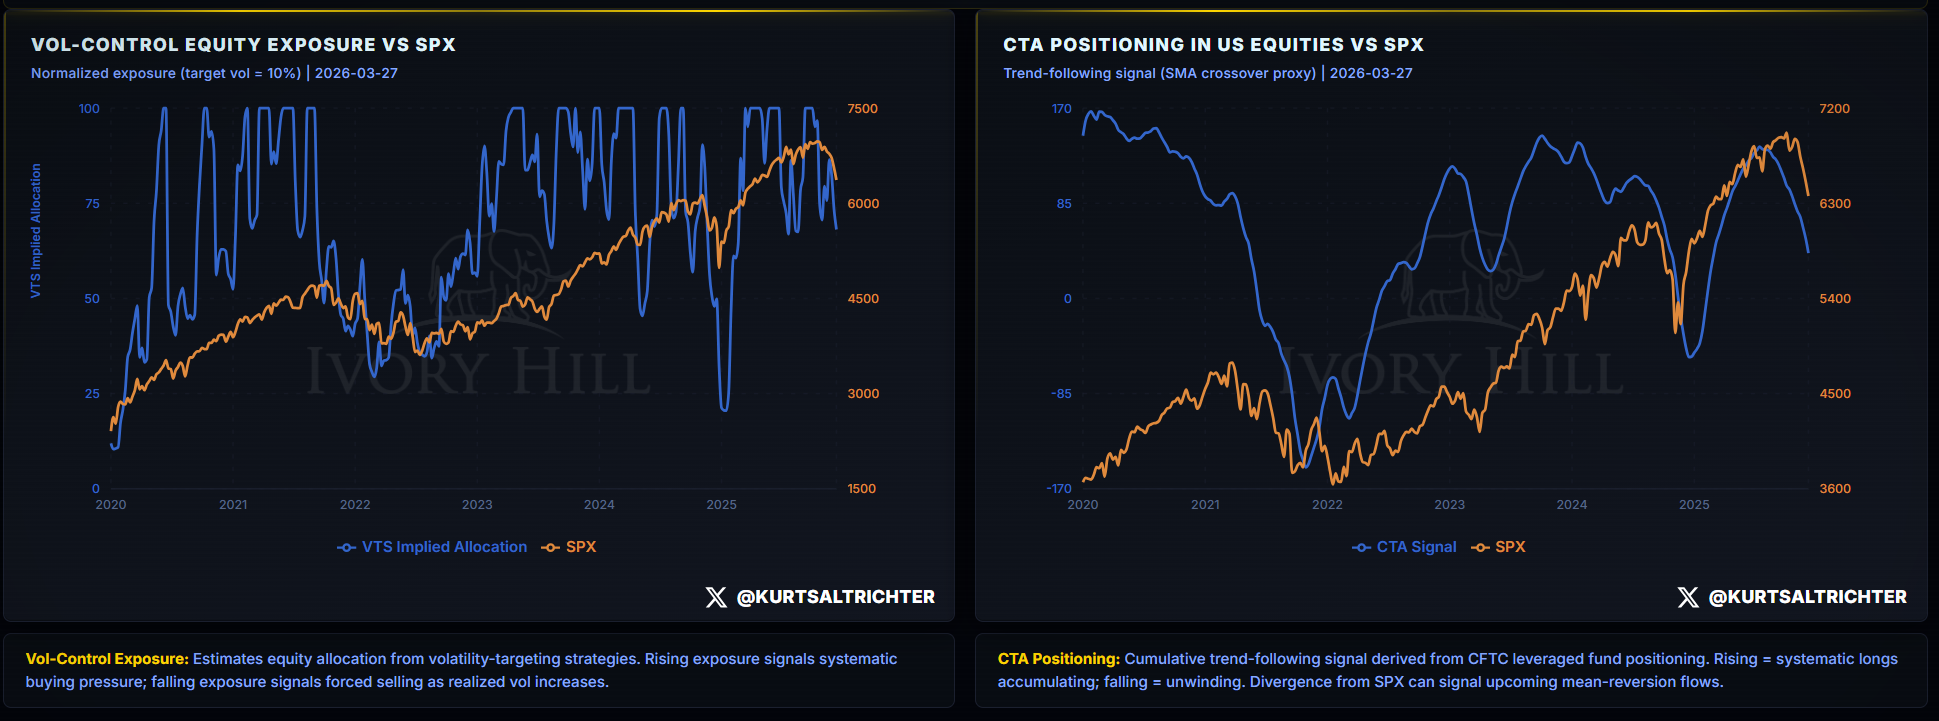
Two large groups of systematic funds drive this signal. CTAs are trend-following funds. When markets rise, they buy. When markets fall, they sell. Simple as that. They have been selling for weeks. Two weeks ago, they briefly slowed down, and the signal ticked to Neutral for one week. Last week, they went straight back to Bearish. That pause did not produce a bid. It produced a head fake for the bulls. Vol-control funds are covered above. Both sets of rules currently tell these funds to reduce their stock exposure.
Short-side crowding keeps building. That is not a reason to buy today. It is a reason to know that when this regime turns, it will turn fast.
Breadth and Participation
Breadth: 45.1%. Breadth Signal: Bearish.
This measures how many stocks inside the S&P 500 are actually in uptrends versus downtrends. Right now, only 43% of S&P 500 companies are trading above their own long-term average price. That means the majority of the index is already deteriorating beneath the surface. Healthy markets have broad participation. This one does not.
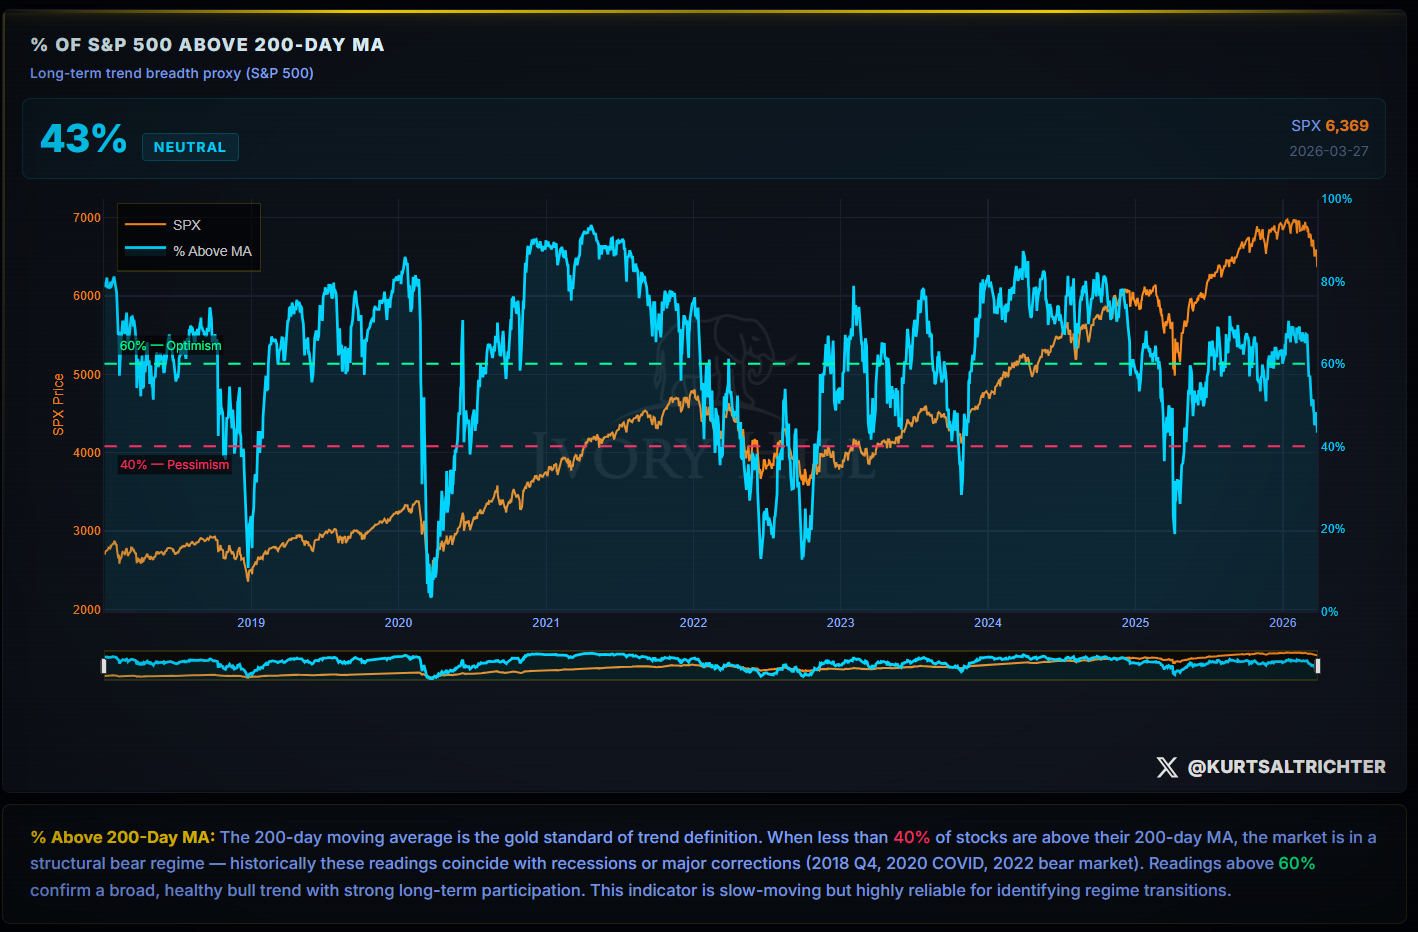
Six weeks ago, this reading was 68%. It has fallen every single week since. That is not rotation into different sectors. That is the market getting weaker underneath.
The level to watch is 40%. That is the threshold historically associated with recessions and major corrections. 2018. 2020. 2022. We are getting very close.
Composite Signal and Regime
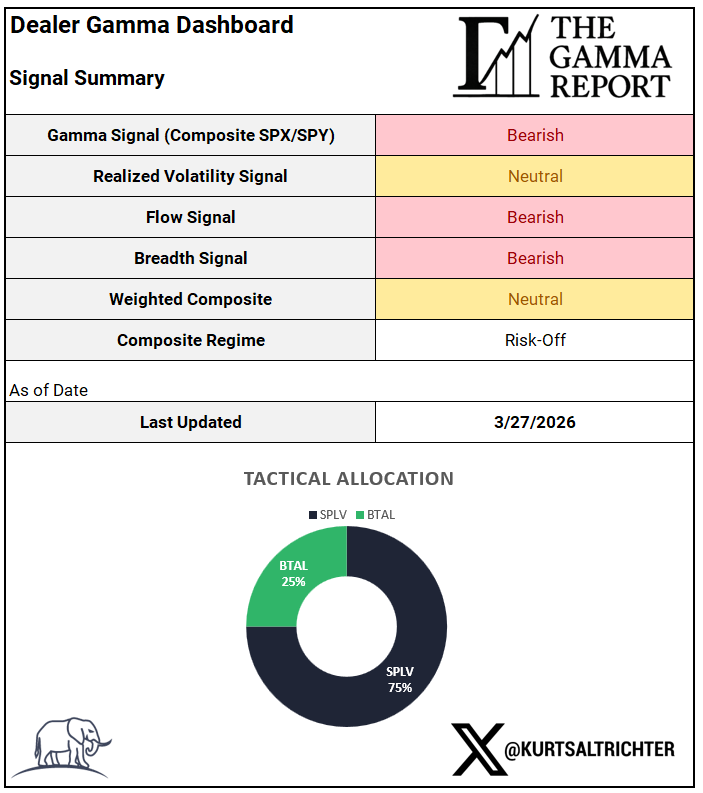
Gamma: Bearish. Realized Volatility: Neutral. Flows: Bearish. Breadth: Bearish. Weighted Composite: Neutral. Regime: Risk-Off.
Three Bearish. One Neutral. Zero Bullish. Allocation unchanged: 75% SPLV / 25% BTAL.
Three things change this allocation. The S&P 500 reclaims 6,678 and holds it. Short-term realized volatility falls back below long-term and stays there. Breadth recovers above 60%. Zero out of three are moving in the right direction.
Performance
Weekly rebalance: -3.63% YTD. S&P 500: -6.68%. Daily rebalance: -11.61%.
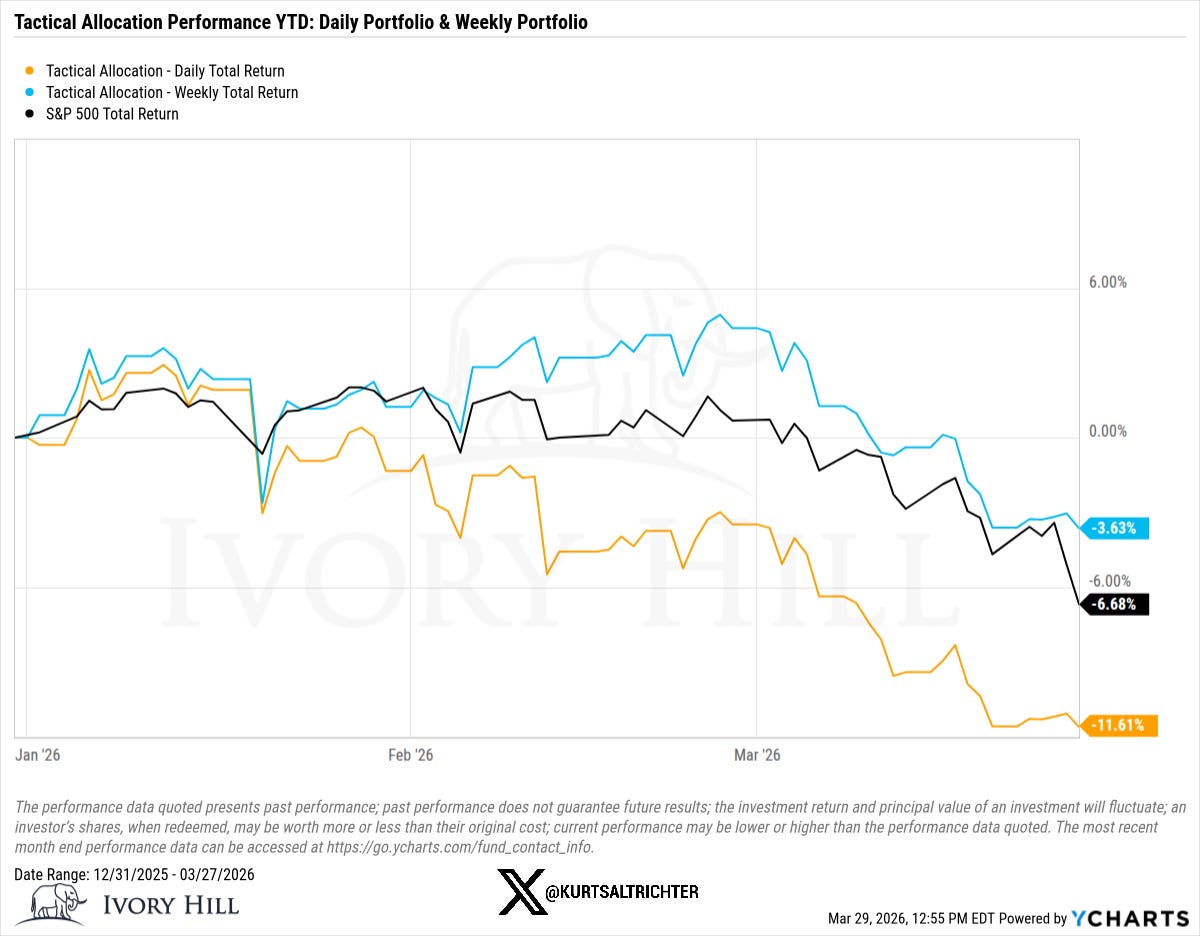
Down 3.63% against an index that is down 6.68% in a pretty volatile start to the year. The defensive posture is doing its job. The model is fully invested at all times to reflect market structure.
Bottom Line
Negative gamma is the deepest it has been in months. Short-term volatility is still running above long-term. Systematic funds are still selling. Breadth is still deteriorating. Three Bearish signals.
JOLTS Tuesday. ISM Wednesday. Payrolls Friday. In negative gamma, whatever the tape delivers gets amplified, in both directions. So your job is to monitor the market, and as long as it stays within the weekly expected move box, you have no reason to allow your emotions to get the best of you.
Nothing has changed for the better. Several things have gotten worse. The allocation stays where it is until the structure says otherwise.
And remember - The one fact pertaining to all conditions is that they will change.
Feel free to use me as a sounding board.
Follow me on X for more updates.
Best regards,
Schedule a call with me by clicking HERE
Kurt S. Altrichter, CRPS®
Wealth Advisor | President
Disclosure
The Gamma Report is published by Ivory Hill, LLC. All opinions and views expressed in this report reflect our analysis as of the date of publication and are subject to change without notice. The information contained herein is for informational and educational purposes only and should not be considered specific investment advice or a recommendation to buy or sell any security.
The data, models, and tactical allocations discussed in this report are designed to illustrate market structure and positioning trends and may differ from portfolio decisions made by Ivory Hill, LLC or its affiliates. Investing involves risk, including the possible loss of principal. Past performance is not indicative of future results.
Ivory Hill, LLC, and its members, officers, directors, and employees expressly disclaim any and all liability for actions taken based on the information contained in this report.